

Among the most controversial policy topics in the United States over the last several decades has been health care reform. Legislated contentiously throughout President Barack Obama’s first fourteen months in office, the Affordable Care Act, the ACA, the most complicated health care legislation in American history, became law on March 23, 2010. Reference Rigby, Clark and Pelika1 The ACA addressed health care issues by many means, but the two most controversial were these: an individual mandate that all uninsured Americans purchase health insurance and a requirement that all states expand their Medicaid programs to meet a new and far more generous nationwide eligibility standard or lose existing federal Medicaid dollars. While many commentators hailed the ACA as a landmark on the path to universal health insurance, others bitterly criticized the individual mandate and the expansion of Medicaid. In the early going, the individual mandate, which seemed to regulate “inactivity rather than activity” on an ultimately rejected, constitutional premise, received the greatest opposition. Reference Starr2
Implementing the ACA while also defending it has been an ordeal for President Obama and his fellow Democrats. Reference Emanuel3 The law, vilified by conservatives, has survived numerous attempts at outright repeal by the House of Representatives, but it has endured Supreme Court challenges less than fully intact, and many states have simply refused to comply with the bill’s expectations. This last problem, state non-participation, has brought state choice into scholarly focus.
The ACA’s ongoing troubles provide an unusual opportunity for cross-state comparison of initial implementation choices—arguably the best such opportunity since passage of the Personal Responsibility and Work Opportunity Reconciliation Act of 1996, the law that created Temporary Assistance for Needy Families, better known as TANF. Reference Soss, Schramm, Vartanian and O’Brien4 Like TANF, the ACA has required nearly simultaneous implementation choices across the 50 states. Although the ACA (and thus state choice) continues to evolve over time, initial choices were clustered in time.
While much of the ACA was not scheduled to take effect until 2014, initial implementation began in late 2010. States had several choices to make regarding the ACA, including the option to accept or decline an expanded Medicaid benefit—federal money through 2017 to pay 100 percent of a state’s Medicaid costs attributable to expansion and from 2020 no less than 90 percent—and the choice of whether to create a state-run insurance market or to join a federal insurance exchange. Notably, several states challenged the constitutionality of the ACA shortly after passage. Reference Farley5 The ruling resulting from the federal case National Federation of Independent Business v. Sebelius, 567 U.S.__, 132 S. Ct. 2566 (2012), 6,7 largely upheld the ACA’s constitutionality in a fractured and complicated decision. In a five-to-four decision, the Court let the individual mandate stand as a “tax” rather than a “penalty,” the term used in the law. In addition, the Supreme Court upheld the 2014 ACA Medicaid expansion, but in a seven-to-two decision ruled unconstitutionally coercive the federal government’s planned withholding of all Medicaid funds from states choosing not to expand Medicaid. This ruling effectively negated the fiscal threat non-compliant states had been facing.
Since the 2012 ruling, efforts to defund and delay the law have continued both directly, through legislative maneuvers and lawsuits, and indirectly, through the activities of political action committees. Most recently, in the spring of 2015, one of these lawsuits culminated in a Supreme Court ruling, King v. Burwell, 576 U.S.___ 14-114 (2015), 8 once again threatening to undermine the integrity and standing of the law. This time, the primary debate was over the “plain” language allowing for tax credit subsidies to individuals in state-established exchanges. 9 Supporters of the ACA argued that the “language just reflects Congress’s assumption, unchallenged at the time, that the states would establish their own exchanges.” Reference Bagley10 Opponents contended that any exchange established not by a state but, instead, by the federal government would not be entitled to subsidies. Reference Adler and Cannon11,12 At the time of the ruling, nearly a third of all states had created their own exchanges, meaning that roughly two-thirds of the states and more than six million people were at risk for losing the federal subsidy. 13 Ultimately the Court upheld the law, finding the provisions in question best interpreted in full context. 14
The ACA in its initial implementation phase required states to make, inter alia, two decisions: whether to create a state insurance exchange (seventeen states did), and whether to expand Medicaid (27 states and the District of Columbia did). Some decisions were of an entirely different sort; as of 2012, 27 states had decided either to file a lawsuit or to join an existing lawsuit challenging the ACA, and 21 states had adopted legislation in some fashion declaring opposition to the act.
Much of the existing research attempting to explain state policy decisions prompted by the ACA has focused on a single choice—that is, whether states decided to expand Medicaid. Reference Barrilleaux15,Reference Mayer and Kenter16 The federal offer seemed a good one. Why would any state refuse? In the refusing states much public-health need would be left unmet. 17,18,19 Hospital revenues would miss a boost, one especially helpful for the safety-net hospitals essential to regional networks. 20,21 And many patients not poor enough to qualify for “old” Medicaid would find themselves too poor to qualify for new federal insurance subsidies; those new subsidies had been designed only for poor patients not poor enough for the “new” Medicaid. Reference Haeder and Weimer22
Many early studies assumed the decision not to expand Medicaid was a function of partisan politics underscored by ideological cleavages. 23,Reference Hall24,Reference Rigby25 Partisanship would make the balancing of conflict and incentive difficult, even futile. Reference Haeder and Weimer26 Emanuel suggested that the intense political partisanship around the early implementation of the ACA created the most poisonous political environment in the United States since the Civil War. 27
Recent scholarship has tried to tease out additional factors. Reference Jacobs and Callaghan28,Reference Richardson and Yilmazer29 Plein has cited overt partisan politics, especially in hotbeds of Tea Party influence. Reference Plein30 Oddly, though, states with the greatest Tea Party influence happen to be home to some of the poorest and unhealthiest populations in the country, populations that the ACA was designed to assist. Brill, on the other hand, has cited general public disdain for the health care system as a whole — a system which, compared to the systems of other developed nations, is among the most expensive, among the least supportive of public-health programs, Reference Brill31,32 and, judged by outcomes, among the middle-ranking. Reference Brill33
These ironies have invited more nuanced measures. Rigby created an index of state resistance that looks at party control, public opinion, state capacity, and magnitude of policy change required and ultimately found that partisanship is the most significant predictor of state decisionmaking. 34 Along these same lines and similar in design to the methodology employed here, Jacobs and Callaghan developed an additive scale that utilizes gubernatorial statements, Medicaid-related grants, and recent state changes in Medicaid policy. 35 Jacobs and Callaghan also examined political-party control, state affluence, previous policy trajectories, and administrative capacity in an effort to answer why states expand Medicaid and ultimately found strong support for partisan influence as well as evidence of other factors at play. 36 Barrilleaux and Rainey took a slightly different approach, looking at both politics and need as indicators of why states may choose to expand Medicaid, and found that partisanship is critical to state decision-making as it relates to Medicaid expansion. Reference Barrilleaux and Rainey37 Haeder and Weimer reached a similar conclusion about the influence of partisanship while also uncovering evidence of different factors influencing decision-making by taking an historical look at state insurance data and trends. 38
Our work builds on these early examinations of state decision-making in the initial implementation of the ACA by creating an additive index of support measures not yet examined in the literature. Independent variables are further informed by the above-mentioned works and separated within the model into political and socioeconomic indicators. In contrast to much of what is found in the early implementation literature, our model presents a more nuanced examination to help determine if state decision-making as it relates to the ACA is about more than just partisan politics.
Methods
We asked two research questions. First, has state implementation of ACA provisions been driven more by politics than by public-health need? And, second, does a robust composite measure offer more insight than a simple measure?
To answer these questions we studied the correlation of a state’s attitudes, as graded by six criteria, and its political and socioeconomic conditions.
States showed support if they took regulatory or legislative action implementing reforms prescribed by the ACA, if they created their own exchanges as prescribed by the ACA rather than defaulting to the federal government’s exchange, or if they expanded Medicaid as prescribed by the ACA or had already expanded under waivers and did not then defect from expansion in opposition to the ACA. One point was added for each of these three actions.
States showed opposition if they enacted laws to limit, alter, or block state or federal efforts to implement the ACA or passed nonbinding resolutions to declare their opposition, 39 if they refused to expand Medicaid, or if they joined National Federation of Independent Business v. Sebelius. One point was deducted for each of these three actions.
Our dependent variable ranged from
 $+3$
(most supportive) to
 $-3$
(least supportive).
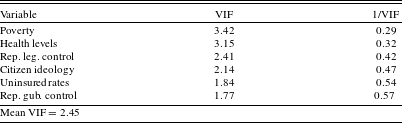
Data were drawn from PoliData, 40 the United Health Foundation, 41 the 2012 American Community Survey, 42 and Berry and colleagues. Reference Berry, Ringquist, Fording and Hanson43 Data were collected for 2012 or to the year nearest 2012, by which year all states had formulated initial responses to the ACA. Data were imported into Stata/IC 12 and then verified and checked for collinearity and heteroskedasticity.
We chose six independent indicator variables:
Party of the governor, referenced from PoliData 44 and their Election Yearbook for the United States, was operationalized as a dummy variable where Republican was set to 1. All other cases were coded as 0.
Party of legislative control, referenced from PoliData, 45 we operationalized as a dummy variable coded as 1 if, following the 2012 election cycle, the Republican Party controlled both chambers of a legislature. Nebraska’s legislature, unicameral and nonpartisan, had a Republican-identifying majority and was coded as 1. All other cases were coded as 0.
Citizen ideology, measured in the manner of Berry and colleagues 46 with higher scores indicating a more liberal ideology.
Percent of population living in poverty, measured using household income compared to a threshold varying by number of individuals in a household and scored above or below a national poverty standard renewed annually based on the Consumer Price Index.
Percent of population lacking health insurance, referenced from the 2012 American Community Survey. 47
Population health status, referenced from an index created by the United Health Foundation. 48
To probe the correlates of support for the ACA we tested six hypotheses:
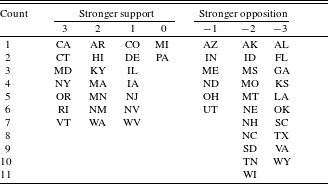
Dependent variable scores by state.

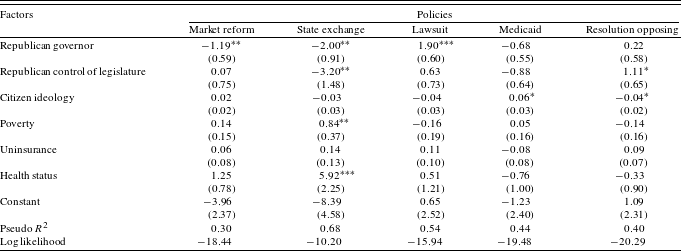
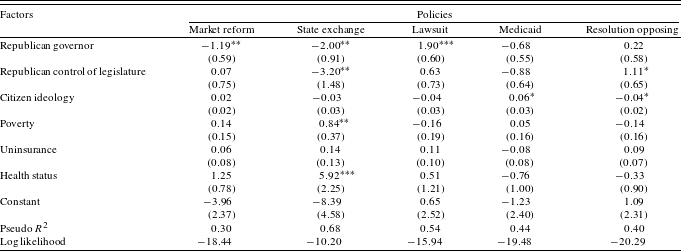
State level factors and policies: probit-regression analysis.
Notes: Standard errors in parentheses. Levels of statistical significance:
 $^{\ast }0.1$
;
 $^{\ast \ast }0.05$
;
 $^{\ast \ast \ast }0.01$
.
 $N=50$
.
-
H1 A state with a Republican governor was less likely to be supportive.
-
H2 A state with a Republican-controlled legislature was less likely to be supportive.
-
H3 The more liberal its ideology the more likely a state was to be supportive.
-
H4 The higher its poverty rate the more likely a state was to be supportive.
-
H5 The greater its percentage of uninsured the more likely a state was to be supportive.
-
H6 The less healthy its citizenry the more likely a state was to be supportive.
From these six hypotheses we constructed three models through whose testing we answered our research questions.
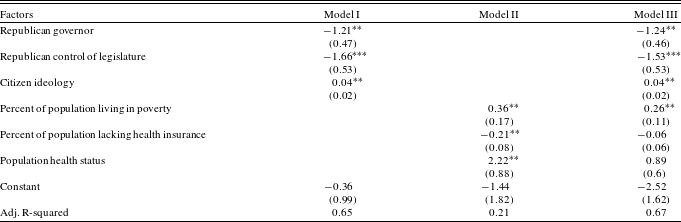
Partisan politics, public-health need, and their interaction: regression analysis of three models.

Notes: Standard errors in parentheses. Levels of statistical significance:
 $^{\ast }0.1$
;
 $^{\ast \ast }0.05$
;
 $^{\ast \ast \ast }0.01$
.
 $N=50$
.
Results
Table 1 shows 50 states along a continuum from strong support to strong opposition; two states appeared neutral with scores of zero. Table 2 shows a probit regression of our six independent indicator variables across criteria of ACA support. Table 3 shows regression results for three models. Model I used political variables only; Model II used socioeconomic variables only; Model III used all variables.
Model I showed gubernatorial and legislative control by Republicans and less liberal ideology among a citizenry to have been correlated with state opposition to the ACA.
Model II showed the significance of each socioeconomic indicator; however, both poverty and health status operated contrary to their respective hypotheses. The greater its percentage of uninsured and the less healthy its citizenry the less likely a state had been to support the ACA.
Model III, containing all variables, showed the significance of the Republican-control and citizen ideology variables persisting. Percent of population living in poverty was also, as in Model II, significant. The other variables were not.
The Republican control of either the executive or legislative branch correlated with a nearly 1.5-point decrease in support for the ACA, while Republican control of both branches correlated with in a nearly 3-point decrease. Opposition-minded leaders may have been less willing or able to oppose the ACA in states with a more moderate citizenry.
Political ideology variables were statistically significant more frequently across each model than were any of the socioeconomic variables. Percent of population lacking health insurance failed to show significance in any of the component models. Taken as a whole, our findings showed partisan politics dominating public-health need.
Conclusion
Our findings highlight how politically influenced state decision-making is as it relates to health care reform and the Affordable Care Act. Our findings also highlight the interplay between public-health need and politics, showing the relative unimportance of public-health need as a driver of state policy choices. While citizens may expect leaders to support policies that address the needs of the population or its subsets, politics may overshadow any such focus. All else being equal, states with relatively high rates of uninsured citizens were more likely to support the ACA, but all else was rarely equal, and politically conservative states even with great public-health need overall were less likely to do so, an observation suggesting a correlation between public-health need and traditionalist political culture. While “political culture” itself is problematic from a measurement perspective, Reference Clynch49 this putative correlation deserves additional investigation. Our research also suggests that more inclusive measures of state choice would prove useful in future study.
Appendix
Descriptive statistics.

Determinants of support for the Affordable Care Act full model correlations.

Variance inflation factor test results.

Determinants of support for the Affordable Care Act component model correlations.