Textile dyes have received great interest within the context of environmental pollution and, because they are resistant to environmental conditions such as light, temperature, microbial attack and oxidizing agents, they render biological treatments difficult to apply and elimination of the dyes is not always effective (Panneer Selvam et al., Reference Panneer Selvam, Preethi, Basakaralingam, Thinakaran, Sivasamy and Sivanesan2008; Khan et al., Reference Khan, Dahiya and Ali2012; Drumond Chequer et al., Reference Drumond Chequer, de Oliveira, Ferraz, Cardoso, Zanoni, de Oliveira and Günay2013; da Silva Lacerda et al., Reference da Silva Lacerda, López-Sotelo, Correa-Guimarães, Hernảndez-Navarro, Sảnchez-Bảscones and Navas-Gracia2015). Thus, wastewater is frequently heavily laden with dyes (Hou et al., Reference Hou, Mac, Zhang, Tang, Fan and Wan2011; Khan et al., Reference Khan, Dahiya and Ali2012; Drumond Chequer et al., Reference Drumond Chequer, de Oliveira, Ferraz, Cardoso, Zanoni, de Oliveira and Günay2013; Yaseen & Scholz, Reference Yaseen and Scholz2019). This is particularly problematic for the countries that, having limited water resources, use wastewater for irrigation (Gumel et al., Reference Gumel, Usman and Ado2015; Dickin et al., Reference Dickin, Schuster-Wallace, Qadir and Pizzacalla2016), causing accumulation of dyes in the soils. The toxicity to plants and soil microflora as well as transfer within the food chain after mobilization by plants are, in the medium and long term, major ecological risks (Ajmal & Khan, Reference Ajmal and Khan1985; Khan et al., Reference Khan, Dahiya and Ali2012; Drumond Chequer et al., Reference Drumond Chequer, de Oliveira, Ferraz, Cardoso, Zanoni, de Oliveira and Günay2013; Ma et al., Reference Ma, Xi, He, Ayoko, Zhu and Zhu2016; Gombert et al., Reference Gombert, Biaudet, de Seze, Pandard and Carré2017).
Sorption affects the mobility and bioavailability of organic pollutants in soils (Alexander, Reference Alexander1994; Warren et al., Reference Warren, Allana, Carter, House and Parker2003; Yang et al., Reference Yang, Duan, Liu, Wu, Li, Dong, Zhu and Dionysiou2020a, Reference Yang, Huang, Wu, Li, Dong and Li2020b). It depends on the overall soil structure and the presence of clay minerals, the nature of the pollutant and physicochemical conditions (notably pH and humidity) (Nam et al., Reference Nam, Kim and Oh2003; Kah & Brown, Reference Kah, Brown and Ware2006; Yang et al., Reference Yang, Wu, Liu, Chen, Ahmed and Zhu2018; Chen et al., Reference Chen, Wu, Zhu, Dang, Bi and Pei2020b; Liu et al., Reference Liu, Wu, Yang, Rehman, Ahmed and Zhu2020; Yang et al., Reference Yang, Huang, Wu, Li, Dong and Li2020b; Ye et al., Reference Ye, Huang, Wu, Wu, Ma and Liu2020). The increase in retention on the porous solid phase of the soil reduces dispersion risk for these pollutants (Chen et al., Reference Chen, Liu, Bi, Rehman, Dang and Wu2020a; Yang et al., Reference Yang, Duan, Liu, Wu, Li, Dong, Zhu and Dionysiou2020a), but can in turn make it difficult for microbial agents present in the soil to remove them (Kah & Brown, Reference Kah, Brown and Ware2006; An et al., Reference An, Xiao, Di, Dong and Tang2017).
In this study, rhodamine B, a basic dye of the xanthene class, was examined (Grauer et al., Reference Grauer, Malter, Yariv and Avnir1987; Raha et al., Reference Raha, Ivanov, Quazi and Bhattacharya2009). Xanthene dyes, the most known compound of which is fluorescein, are endowed with intense fluorescence. The use of rhodamine B is well established as a marker during maritime accidents or as a tracer for underground rivers (Li et al., Reference Li, Liu and Zhu2010; Bhattacharyya et al., Reference Bhattacharyya, SenGupta and Sarma2014). Due to its solubility in water, it is frequently used in the textile industry for the dyeing of wool, silk and cotton (Shakir et al., Reference Shakir, Elkafrawy, Ghoneimy, Beheir and Refaat2010; Khan et al., Reference Khan, Dahiya and Ali2012; Xu et al., Reference Xu, Wu and Gu2014). The toxicity of rhodamine B is greatly enhanced by the presence of substituents on aromatic rings, in particular diethylamine groups. In the presence of nitrite ions, there is a high probability of the formation of N-diethylnitrosamine, an extremely carcinogenic agent (Gray et al., Reference Gray, Irvine and Kakuda1979; Abidi, Reference Abidi1982; Steinheimer & Johnson, Reference Steinheimer, Johnson and Subitzky1986). Sorption of rhodamine-type dyes by clay minerals has been documented extensively in the past, but most of these studies have focused on the sorption of these dyes on clay minerals of the smectite group (Grauer et al., Reference Grauer, Malter, Yariv and Avnir1987; Tapia Estevez et al., Reference Tapia Estevez, López Arbeloa, López Arbeloa and López Arbeloa1993; Gemeay, Reference Gemeay2002; López Arbeloa et al., Reference López Arbeloa, Chaudhuri, López Arbeloa and López Arbeloa2002; Klika et al., Reference Klika, Weissmannová, Čapková and Pospíšil2004; Panneer Selvam et al., Reference Panneer Selvam, Preethi, Basakaralingam, Thinakaran, Sivasamy and Sivanesan2008; Bhattacharyya et al., Reference Bhattacharyya, SenGupta and Sarma2014; Ma et al., Reference Ma, Xi, He, Ayoko, Zhu and Zhu2016). Montmorillonite, the most common mineral of the smectite group, has been used widely as an adsorbent of rhodamine B. The other members of this group (i.e. beidellite, nontronite, saponite, hectorite and sauconite) are similar swellable 2:1-layer structures, but with various layer-charge locations and chemical compositions (Emmerich et al., Reference Emmerich, Wolters, Kahr and Lagaly2009). The negative layer charge in both montmorillonite and hectorite derives mainly from the isomorphic substitution in the octahedral sheet, while in beidellite, saponite, nontronite and sauconite, the layer charge is derived mainly from the isomorphic substitution in the tetrahedral sheet (Hetzel & Doner, Reference Hetzel and Doner1993; Christidis & Eberl, Reference Christidis and Eberl2003; Emmerich et al., Reference Emmerich, Wolters, Kahr and Lagaly2009). Due to their large specific surface area, large cation-exchange capacity (CEC) and swelling properties, smectites play an important role in the physical and chemical properties of soils (Borchardt, Reference Borchardt, Dixon and Weed1977; Hetzel & Doner, Reference Hetzel and Doner1993; Schnetzer et al., Reference Schnetzer, Johnston, Premachandra, Giraudo, Schuhmann, Thissen and Emmerich2017; Yang et al., Reference Yang, Duan, Liu, Wu, Li, Dong, Zhu and Dionysiou2020a). Several authors have reported that the layer-charge density, the location of the deficit charge and the nature of the interlayer cation influence significantly the cation-exchange properties, intercalation and swelling behaviour of the smectites (Maes et al., Reference Maes, Stul and Cremers1979; Sato et al., Reference Sato, Watanabe and Otsuka1992; Lagaly, Reference Lagaly and Mermut1994; López Arbeloa et al., Reference López Arbeloa, Tapia Estevez, López Arbeloa and López Arbeloa1997; Kaufhold et al., Reference Kaufhold, Dohrmann, Ufer and Meyer2002; Christidis & Eberl, Reference Christidis and Eberl2003; Laird, Reference Laird2006; Emmerich et al., Reference Emmerich, Wolters, Kahr and Lagaly2009; Karmous et al., Reference Karmous, Ben Rhaiem, Robert, Lanson and Ben Haj Amara2009). Hence, it would be useful to improve our understanding of the sorption mechanisms of these dyes onto other members of the smectite family, such as beidellites. Therefore, the aim of the present study was to study the physicochemical phenomena that govern the interactions between rhodamine B and a beidellite-rich clay fraction. The kinetics and equilibrium isotherms of sorption of rhodamine B onto beidellite were studied and described using several models. The effects of various parameters such as pH, solid/solution ratio and the presence of competing ions were evaluated here because previous studies have shown that the sorption of basic dyes onto smectites is influenced by these factors (Grauer et al., Reference Grauer, Malter, Yariv and Avnir1987; López Arbeloa et al., Reference López Arbeloa, Tapia Estevez, López Arbeloa and López Arbeloa2002; Li et al., Reference Li, Liu and Zhu2010; Hou et al., Reference Hou, Mac, Zhang, Tang, Fan and Wan2011; Bhattacharyya et al., Reference Bhattacharyya, SenGupta and Sarma2014; Ma et al., Reference Ma, Xi, He, Ayoko, Zhu and Zhu2016). The results of this study may contribute to a better understanding of the processes controlling the mobility of this pollutant in soils with clay fractions dominated by beidellites.
Materials and methods
Clay-sample preparation
The natural clay used was provided by the Algerian bentonite company (Bental; Mostaganem Province, Algeria). It was first sieved to 50 μm and dispersed under stirring for 2 h at a room temperature in 0.2 mol L–1 HCl solution. The clay suspension was washed several times with distilled water until it was dispersed and then was purified by sedimentation/decantation. The <2 μm fraction was separated according to Stokes’ law, exchanged three times with 1 mol L–1 NaCl solution and washed with distilled water using a high-speed centrifuge until chloride-free (AgNO3 test). The clay fraction obtained, denoted Na-Bd, was dried at 60°C for 24 h and then ground and sieved to 0.1 mm.
The K- and Li-saturated clays (K-Bd and Li-Bd) were prepared by exchanging the Na-Bd sample with 1 mol L–1 KCl or LiCl solution, respectively, after centrifugation and removal of the excess solution. Saturation was performed twice. The clays obtained were washed until chloride-free (AgNO3 test).
Characterization techniques
Mineralogical identification was performed using X-ray diffraction (XRD) with a Bruker D8 Advance diffractometer operating at 40 kV and 20 mA and with Cu-Kα radiation (λ = 1.5418 Å). The XRD analyses involved randomly oriented powder specimens (Na-saturated clay dried at 60°C for 24 h (Na-Bd) and K-saturated clay heated at 110°C for 2 h) and oriented aggregates of air-dried specimens (Na-Bd, Na-Bd saturated with glycerol at 80°C for 48 h and Na-Bd calcined at 550°C). Oriented specimens of Na-Bd after sorption of rhodamine B were also studied. All XRD traces were recorded under ambient conditions. The localization of the negative charge in the structure of the smectite was determined using the Greene-Kelly test (Lim & Jackson, Reference Lim and Jackson1986), based on the Hofmann & Klemen (Reference Hofmann and Klemen1950) effect. The Li-saturated fraction (Li-Bd) was dried at room temperature and then heated at 300°C for 2 h. Afterwards, the sample was saturated with glycerol at 80°C for 48 h before XRD measurements.
Infrared transmittance spectra were recorded on a Jasco FT/IR-4200 type A infrared spectrometer in the frequency range 500–4000 cm–1 (with 4 cm–1 resolution). A total of 2 mg of clay material was added to 198 mg of KBr to form pressed pellets. The chemical composition of the Na-Bd clay was obtained using X-ray fluorescence (XRF) spectrometry (ARL 9400 Sequential XRF XP spectrometer). The CEC was determined using the conductometric method (Chiu et al., Reference Chiu, Huang, Uang and Huang1990) using a Consort™ 860 Multi-parameter Analyzer.
Rhodamine sorption on the clay material
Rhodamine B, a basic dye, the International Union of Pure and Applied Chemistry (IUPAC) name for which is [9-(2-carboxyphenyl)-6diethylamino-3-xanthenylidene]-diethylammonium chloride, was purchased from Sigma-Aldrich (CAS Number: 81-88-9, M = 479.01 g mol–1). Absorbance scans of rhodamine B in the visible range in aqueous solution were performed with an ultraviolet–visible (UV–VIS) spectrophotometer (Jenway 6305). Maximum absorbance (λmax) of the dye was observed at 551 nm. The calibration curve at this wavelength was established as a function of rhodamine B dye concentrations.
The sorption experiments were conducted in batch mode at room temperature (17–20°C) and at pH values between 5.5 and 6.5. The residual dye concentrations of each solution were determined from the absorbance at λmax. The amount of rhodamine B sorbed by Na-Bd clay at any time (Qt; mmol g–1) was assessed using Eq. 1:
 $${Q_t} = {\rm \;}\lpar {{C_0\;\ndash \;C_t}} \rpar {\rm \;}\displaystyle{{V} \over {m}}{\rm \;}$$
where C 0 and Ct (mmol L–1) are the initial and liquid-phase concentrations of the rhodamine B solution at any time t (min), respectively, V (L) is the volume of the dye solution and m (g) is the mass of Na-Bd clay used.
The concentrations of rhodamine B solutions were chosen taking into consideration the concentration range of the dye solutions in synthetic textile wastewater, prepared by several authors to simulate real textile effluents (Yaseen & Scholz, Reference Yaseen and Scholz2019). The effect of competing cations was studied with regards to Ca2+ and Mg2+ ions, which are usually encountered in the wastewaters of the textile industry (Fersi et al., Reference Fersi, Gzara and Dhahbi2005; Yaseen & Scholz, Reference Yaseen and Scholz2019) and are the predominant exchangeable cations in most soils (Curtin et al., Reference Curtin, Syers and Smillie1987; Krám et al., Reference Krám, Hruška, Wenner, Driscoll and Johnson1997). Finally, each experiment was repeated at least twice under identical conditions.
The determination of dye sorption kinetics onto the Na-Bd clay was performed in polyethylene Erlenmeyer flasks, at various time intervals, on a series of suspensions of 30 mg of clay in 50 mL of aqueous solution with initial dye concentrations of 0.05 and 0.20 mmol L–1. These concentrations were chosen because dye concentrations in textile wastewaters range from 10 to 200 mg L–1 (Gahr et al., Reference Gahr, Hermanutz and Oppermann1994; Yaseen & Scholz, Reference Yaseen and Scholz2019). The suspensions were agitated on a rotary shaker. At the end of each contact time, the residual concentration of dye in the supernatant was analysed after centrifugation.
The influence of pH on dye sorption was studied in the pH range 3–9 in suspensions containing 30 mg of Na-Bd clay in 50 mL of 0.2 mmol L–1 dye solution. The pH was adjusted with 0.1 mol L–1 HCl or NaOH solutions, after which the suspensions were stirred for 2 h. The solids were separated by centrifugation and the dye concentrations in the supernatant, C e (mmol L–1), were determined.
The effect of the solid/solution ratio was examined in a series of aqueous solutions of 50 mL of dye at 0.2 mmol L–1 containing 10–40 mg of Na-Bd clay. After stirring for 2 h, the solutions were separated from the solid by centrifugation and the remaining dye concentrations in the supernatant (C e; mmol L–1) were determined. Sorption isotherms, in the presence or absence of Ca2+ or Mg2+ ions, were constructed using suspensions of 15 mg of Na-Bd clay in 50 mL solutions with increasing dye concentrations from 0.02 to 0.32 mmol L–1. The competitive adsorption of Ca2+ or Mg2+ ions on Na-Bd clay added in the form of CaCl2.2H2O and MgSO4.7H2O was estimated for the  ${{{\rm dye}} \over {{\rm Ca\;or\;Mg}}}$ ratio of 1:10 (Ca2+ and Mg2+). The suspensions were agitated for 2 h and then centrifuged. In the supernatant, the total equilibrium concentration (C e) of the dye was determined.
Results and discussion
Characterization of the fine fraction separated from the raw clay
XRD mineralogical identification
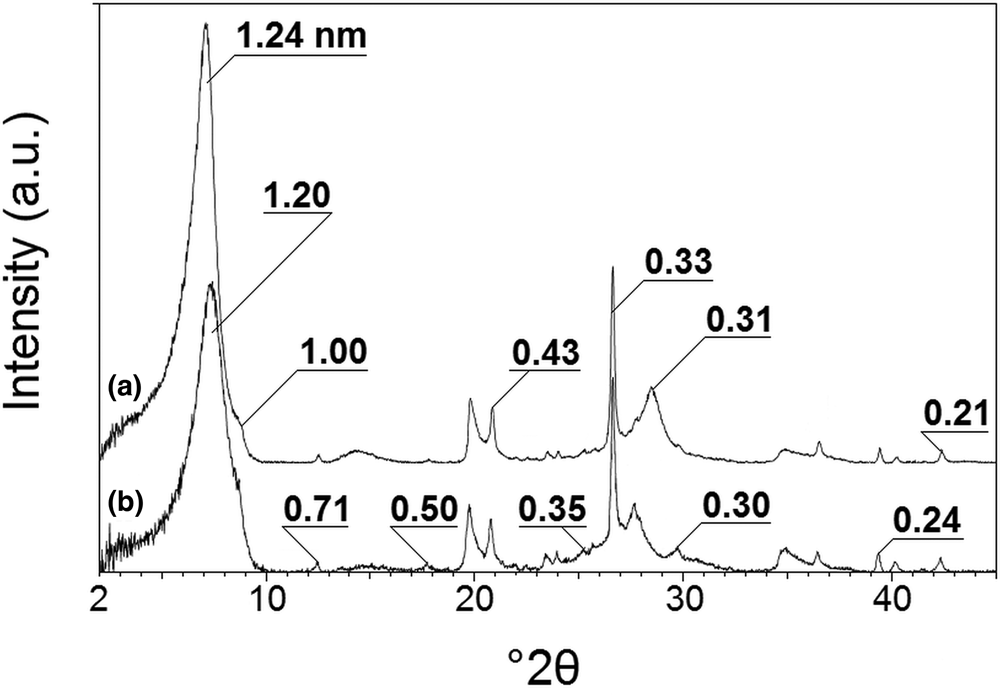
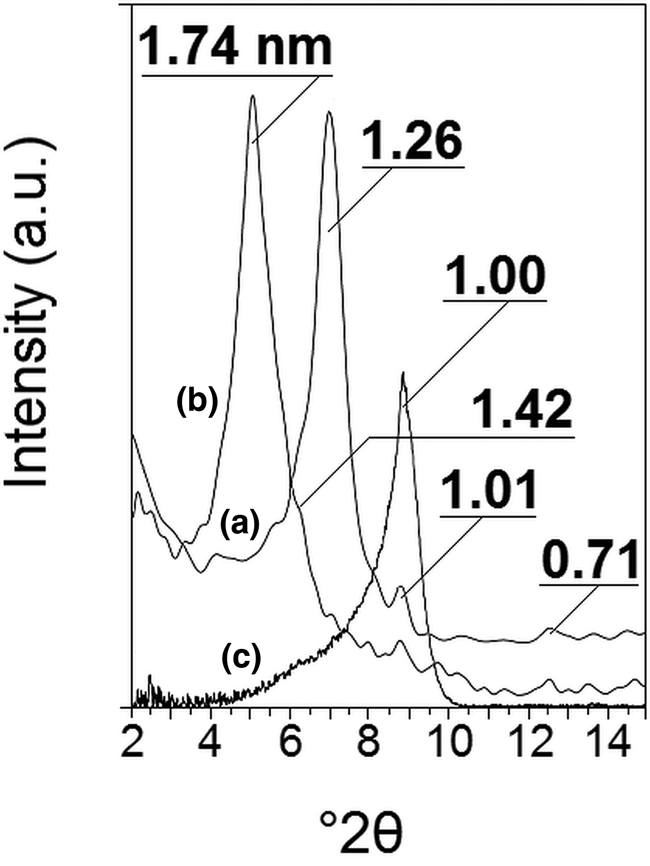
The Na-Bd showed a first-order diffraction d 001 of ~1.24–1.26 nm (Figs 1a & 2a), similar to that of Na-smectites or Na-vermiculites with a single layer of water in their interlayer space (Bergaya et al., Reference Bergaya, Stroiazzo, Trauth and Van Damme1986; Sato et al., Reference Sato, Watanabe and Otsuka1992). However, the 1.24 nm peak shifted to 1.20 nm after K-saturation and heating to 110°C (Fig. 1b), which suggests the predominance of smectite in the fine fraction, as vermiculite would collapse to 1.00 nm upon this test. K-saturated smectites and vermiculites pre-heated at 65, 100 and 200°C collapse to ~1.00 nm in a dry atmosphere (Sayegh et al., Reference Sayegh, Harward and Knox1965; Harward et al., Reference Harward, Carstea and Sayegh1969). Differences between the groups occur, however, upon rehydration. The smectites expand to a thickness equivalent to one layer of water in their interlayer space (d 001 spacing in the range of 1.15–1.25 nm) at a relative humidity of >20%. The vermiculites tend to remain collapsed regardless of the humidity level.
XRD traces of randomly oriented powders: (a) Na-Bd dried at 60°C for 24 h and (b) K-Bd heated at 110°C for 2 h.

XRD traces of air-dried oriented aggregates: (a) Na-Bd, (b) Na-Bd saturated with glycerol at 80°C for 48 h and (c) Na-Bd calcined at 550°C for 4 h.

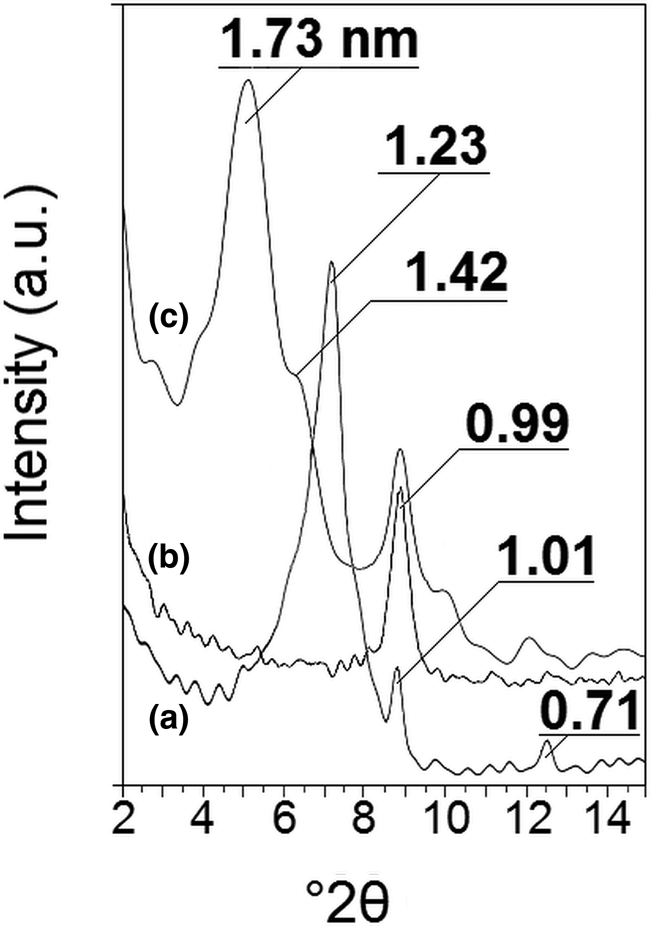
In addition, the basal spacing d 001 of the glycerol-solvated Na-Bd sample was 1.74 nm (Fig. 2b), close to the value for glycerol-saturated smectites (1.75–1.82 nm), confirming the presence of smectite. Vermiculites swell to ~1.43 nm after solvation (Suquet et al., Reference Suquet, de la Calle and Pezerat1975; Sato et al., Reference Sato, Watanabe and Otsuka1992). The appearance of low-intensity diffraction peaks at 1.00, 0.50 and 0.33 nm and at 0.71, 0.35 and 0.24 nm (Fig. 1) indicates the presence of minor illite and kaolinite, respectively (Hubert et al., Reference Hubert, Caner, Meunier and Lanson2009). Note that in the XRD trace of Na-Bd clay calcined at 550°C (Fig. 2c), the characteristic reflection of kaolinite at 0.71 nm (001) disappeared due to dehydroxylation. Dehydroxylation of kaolin minerals occurs in the temperature range of 450–650°C, yielding nearly amorphous metakaolin (Brindley & Nakahira, Reference Brindley and Nakahira1959; Pai et al., Reference Pai, Wang, Wang and Houng1999; Kakali et al., Reference Kakali, Perraki, Tsivilis and Badogiannis2001). Finally, the diffraction maxima at 0.43 and 0.33 nm (Fig. 1) are attributed to quartz (Hubert et al., Reference Hubert, Caner, Meunier and Lanson2009). Application of the Greene-Kelly test demonstrates the Na-Bd clay expanded to 0.173 nm (Fig. 3), indicating the presence of beidellite, nontronite or saponite with a dominant tetrahedral charge (Hofmann & Klemen, Reference Hofmann and Klemen1950; Lim & Jackson, Reference Lim and Jackson1986; Kloprogge et al., Reference Kloprogge, Jansen and Geus1990; Kloprogge, Reference Kloprogge2006). The presence of two glycerol-expanded phases (Figs 2b & 3c), with basal spacings of 1.74 and 1.42 nm, suggests that the smectite had a mostly tetrahedral charge (Harward et al., Reference Harward, Carstea and Sayegh1969; Mermut et al., Reference Mermut, Ghebre-Egziabhier and Arnaud1984; Sato et al., Reference Sato, Watanabe and Otsuka1992).
XRD traces of air-dried oriented aggregates: (a) Li-Bd, (b) followed by heating at 300°C for 2 h and (c) saturated with glycerol at 80°C for 48 h.

Chemical analysis
Elemental analysis of the Na-Bd clay (Table 1), in agreement with the XRD analysis, showed that the minor K2O content might be ascribed to illite (Bergaya et al., Reference Bergaya, Stroiazzo, Trauth and Van Damme1986; Çoban & Ece, Reference Çoban and Ece1999). In addition, the Fe and Mg contents are too small to account for nontronite (Fe-rich smectite) and saponite (Mg-rich smectite) (Suquet et al., Reference Suquet, Malard and Pezerat1987; Casal et al., Reference Casal, Merino, Ruiz-Hitzky, Gutierrez and Alvarez1997; Köster et al., Reference Köster, Ehrlicher, Gilg, Jordan, Murad and Onnich1999), which is in accord with the predominance of beidellite in the Na-Bd clay fraction.
Chemical analysis of Na-Bd.

LOI = loss on ignition.
Cation-exchange capacity
The CEC of the Na-Bd clay was 71 meq 100 g–1. This value is relatively low compared to beidellites of other origins (Goodman et al., Reference Goodman, Russell, Fraser and Woodhams1976; Bergaya et al., Reference Bergaya, Stroiazzo, Trauth and Van Damme1986; Suquet et al., Reference Suquet, Malard and Pezerat1987; Çoban & Ece, Reference Çoban and Ece1999); this difference might be mainly due to the presence of illite and kaolinite in the fine fraction; those have low CEC values. Typical CEC values are 3–15 meq 100 g–1 for kaolinites and 10–40 meq 100 g–1 for illites (Caillère et al., Reference Caillère, Henin and Rautureau1982).
FTIR analysis
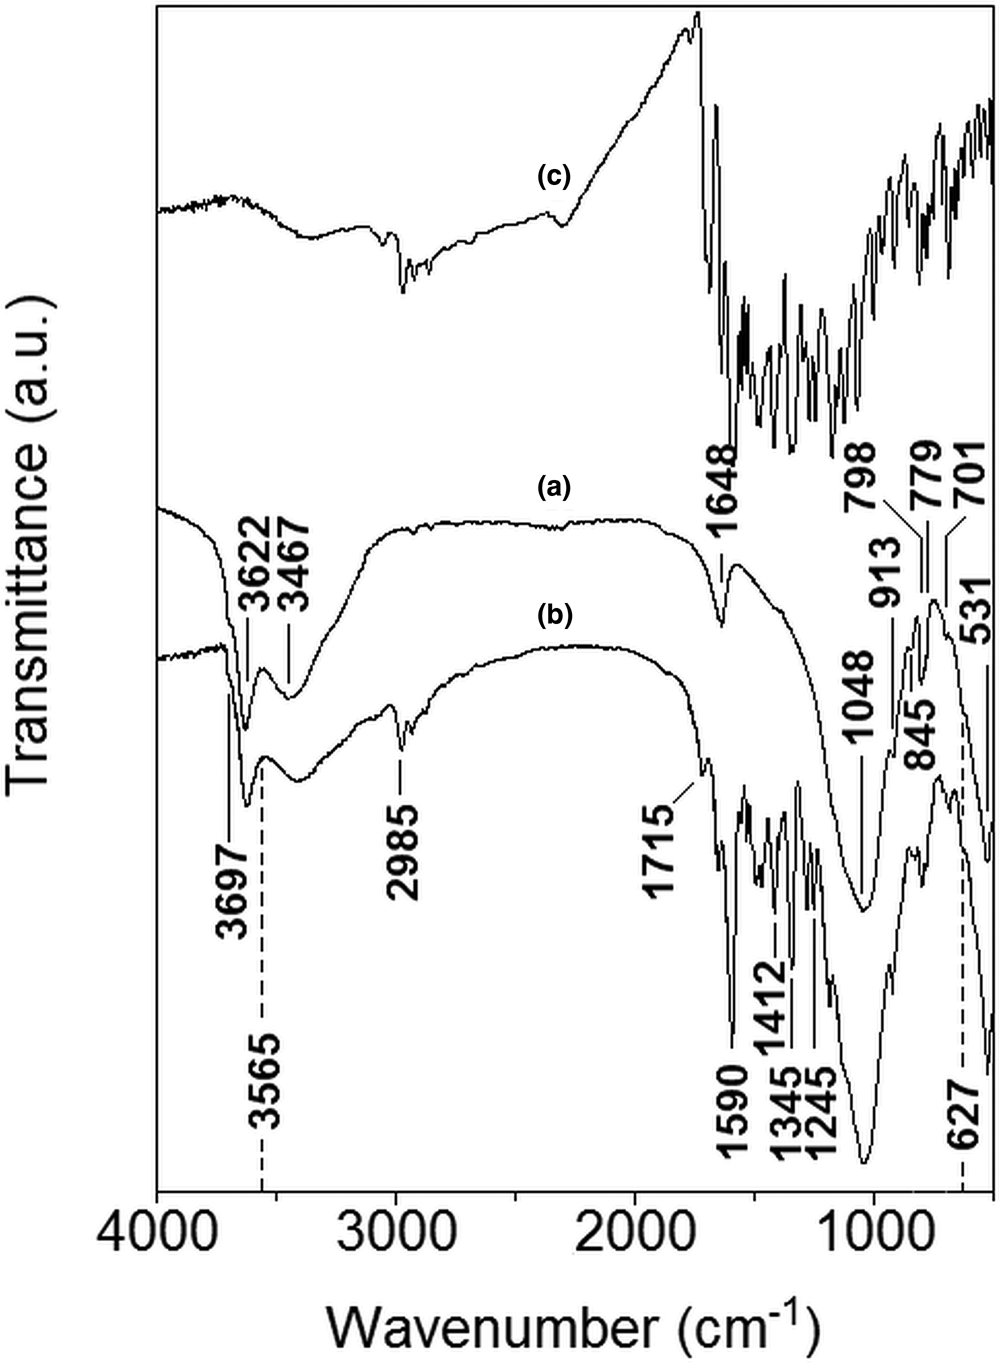
The FTIR spectrum of the Na-Bd clay fraction is shown in Fig. 4a. The low-intensity bands at 3697 and 701 cm–1, attributed to kaolinite (Farmer & Russell, Reference Farmer and Russell1967; Bishop et al., Reference Bishop, Madejová, Komadel and Fröschl2002; Schuttlefield et al., Reference Schuttlefield, Cox and Grassian2007), suggest the presence of small amounts of this mineral. The absence of bands near 3565 and 820 cm–1, assigned to stretching and bending vibrations, respectively, of Fe–Fe–OH in nontronites (Goodman et al., Reference Goodman, Russell, Fraser and Woodhams1976; Mermut et al., Reference Mermut, Ghebre-Egziabhier and Arnaud1984; Vantelon et al., Reference Vantelon, Pelletier, Michot, Odile and Thomas2001; Bishop et al., Reference Bishop, Madejová, Komadel and Fröschl2002), implies that nontronite is absent. The bands at 3622 and 913 cm–1, due to stretching and bending vibrations, respectively, of Al–Al–OH, are characteristic of dioctahedral clays (Farmer, Reference Farmer and Farmer1974; Mermut et al., Reference Mermut, Ghebre-Egziabhier and Arnaud1984; Kloprogge et al., Reference Kloprogge, Jansen and Geus1990; Madejová et al., Reference Madejová, Komadel and Čičel1994; Vantelon et al., Reference Vantelon, Pelletier, Michot, Odile and Thomas2001, Kloprogge, Reference Kloprogge2006). The bands at 3461 and 1648 cm–1, respectively, are attributed to stretching and bending vibrations of the intercalated and adsorbed water molecules (Kloprogge et al., Reference Kloprogge, Jansen and Geus1990; Çoban & Ece, Reference Çoban and Ece1999; Schuttlefield et al., Reference Schuttlefield, Cox and Grassian2007). The intense band centred at ~1048 cm–1, due to the Si–O stretching vibrations, is typical of layer silicates (Farmer, Reference Farmer and Farmer1974; Kloprogge et al., Reference Kloprogge, Jansen and Geus1990). According to Goodman et al. (Reference Goodman, Russell, Fraser and Woodhams1976), the substitution of Si by Al in tetrahedral sites causes the Si–O stretching band to shift from 1014 cm–1 in talc to 1005 cm–1 in saponite (Farmer, Reference Farmer and Farmer1974), and from 1070 cm–1 in pyrophyllite to 1041 cm–1 in beidellite (Farmer & Russell, Reference Farmer and Russell1967). The weakness of the Al–Mg–OH absorption band near 845 cm–1 (Vantelon et al., Reference Vantelon, Pelletier, Michot, Odile and Thomas2001; Bishop et al., Reference Bishop, Madejová, Komadel and Fröschl2002; Christidis et al., Reference Christidis, Dellisanti, Valdre and Makri2005; Schuttlefield et al., Reference Schuttlefield, Cox and Grassian2007) suggests small amounts of Mg2+ in the octahedral sites. The low-intensity bands at 798 and 779 cm–1, characteristic of quartz (Mermut et al., Reference Mermut, Ghebre-Egziabhier and Arnaud1984; Bishop et al., Reference Bishop, Madejová, Komadel and Fröschl2002; Kloprogge, Reference Kloprogge2006), are consistent with the presence of quartz impurity. Finally, the bands at 627 and 531 cm–1 correspond to Al–OH vibrations in Al-rich smectites and Si–O–Al deformation vibrations, respectively (Farmer, Reference Farmer and Farmer1974; Goodman et al., Reference Goodman, Russell, Fraser and Woodhams1976; Kloprogge et al., Reference Kloprogge, Jansen and Geus1990; Kloprogge & Frost, Reference Kloprogge and Frost1999; Kloprogge, Reference Kloprogge2006), suggesting the presence of beidellite in the Na-Bd clay fraction.
FTIR spectra: (a) Na-Bd before rhodamine B sorption, (b) Na-Bd after rhodamine B sorption and (c) rhodamine B.

Based on XRD, elemental analysis and FTIR spectroscopy, it may be concluded that the fine fraction can be considered to be a beidellite with small amounts of illite, kaolinite and quartz.
Sorption of rhodamine B
Kinetics of sorption
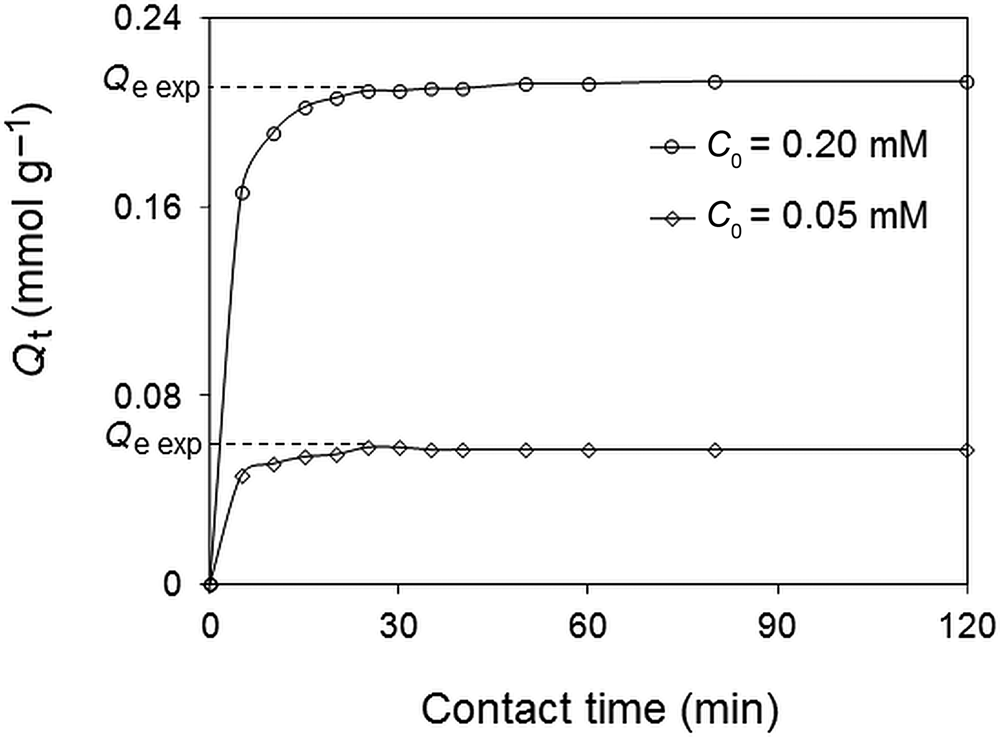
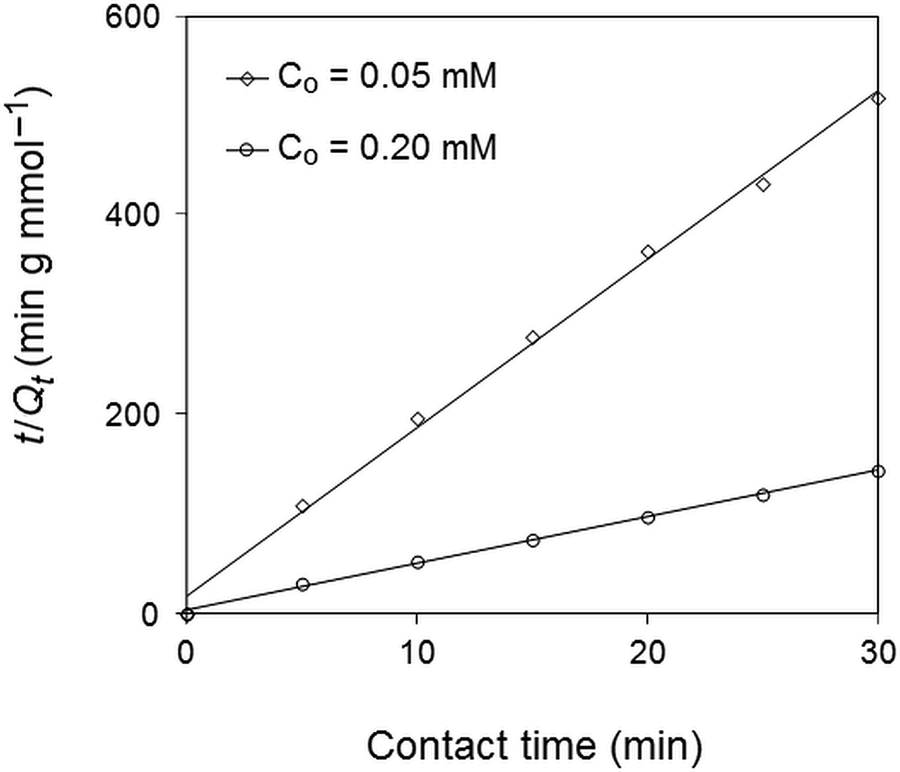
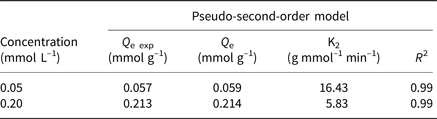
The effect of contact time on rhodamine B sorption by the Na-Bd clay is shown in Fig. 5. The sorption was fast and the amounts of rhodamine B retained increased with the increase in the initial concentration, similarly to the results of previous studies (Hou et al., Reference Hou, Mac, Zhang, Tang, Fan and Wan2011; Bhattacharyya et al., Reference Bhattacharyya, SenGupta and Sarma2014). The duration of the experiments was extended to 120 min, although equilibrium was achieved within <30 min, as was demonstrated by the constant residual concentration of the dye in solution. The sorption was rapid in the beginning and became slower with time due to the resistance to the transfer of the dye species on the surface of the clay particles. The pseudo-second-order model (Eq. 2; Ho & McKay, Reference Ho and McKay1999) described the sorption kinetics well (Fig. 6). Indeed, the coefficients of determination (R 2) were very close to 1, and the calculated Q e values from the pseudo-second-order model are much closer and in good agreement with the experimental Q e values (Q e exp) (Fig. 5 & Table 2):
 $$\displaystyle{t \over {Q_t}} = \displaystyle{ 1 \over {{\rm K_2}Q}_{\rm e}^ 2 }} + \displaystyle{{t} \over {{Q_{\rm e}}}}{\rm \;}$$
where Q e and Qt (mmol g–1) represent the amounts of dye sorbed at equilibrium and at any contact time t (min) of sorption, respectively, and K2 (g mmol–1 min–1) is the pseudo-second-order rate constant.
Effect of contact time on the sorption of rhodamine B onto the Na-Bd clay.

Pseudo-second-order kinetics model for rhodamine B sorption onto the Na-Bd clay.

Kinetic parameters for the sorption of rhodamine B on the Na-Bd clay.

These results corroborate previous findings by other authors concerning the sorption of rhodamine B on montmorillonite (Panneer Selvam et al., Reference Panneer Selvam, Preethi, Basakaralingam, Thinakaran, Sivasamy and Sivanesan2008; Bhattacharyya et al., Reference Bhattacharyya, SenGupta and Sarma2014; Ma et al., Reference Ma, Xi, He, Ayoko, Zhu and Zhu2016). The values of the rate constants (K2) obtained graphically from Fig. 6 were 16.43 and 5.83 g mmol–1 min–1 for initial concentrations of 0.05 and 0.2 mmol L–1, respectively (Table 2). The rate constant K2 decreased with increasing initial concentrations of rhodamine B. This is probably because of the significant competitive sorption of rhodamine B ions on Na-Bd clay fraction sorption sites at high rhodamine B concentrations. These results are in good agreement with earlier observations on the sorption of rhodamine B onto sodium montmorillonite (Panneer Selvam et al., Reference Panneer Selvam, Preethi, Basakaralingam, Thinakaran, Sivasamy and Sivanesan2008).
Influence of pH
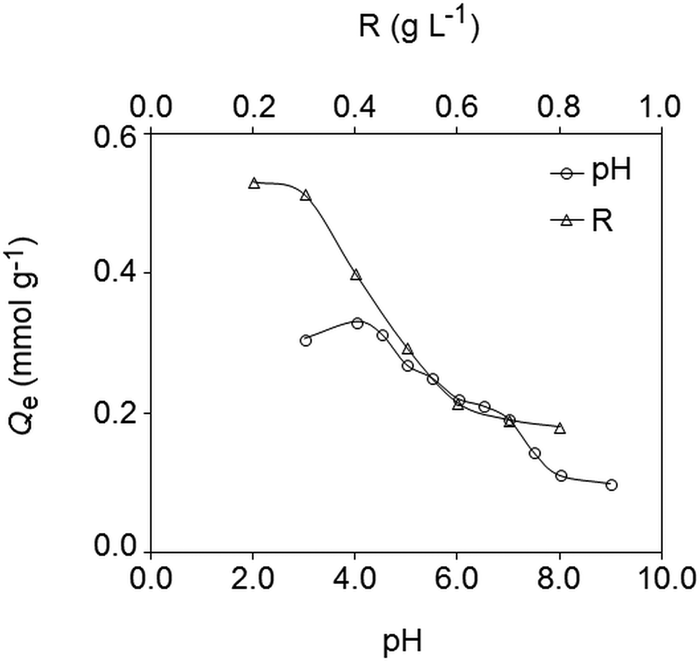
The rhodamine B sorption by the Na-Bd clay as a function of pH is shown in Fig. 7. At solution pH 3–4, the pH range in which the major species of rhodamine B in the solution is RhBH+ (Grauer et al., Reference Grauer, Malter, Yariv and Avnir1987; Bhattacharyya et al., Reference Bhattacharyya, SenGupta and Sarma2014), the sorption capacity for rhodamine B increases. The reason for this enhanced sorption, in agreement with several previous observations (Bhattacharyya et al., Reference Bhattacharyya, SenGupta and Sarma2014; Ma et al., Reference Ma, Xi, He, Ayoko, Zhu and Zhu2016), is due to a decrease in competition with H3O+ for sorption sites. In the pH range 4–9, the dye sorption decreases in accord with previous studies (Hou et al., Reference Hou, Mac, Zhang, Tang, Fan and Wan2011; Bhattacharyya et al., Reference Bhattacharyya, SenGupta and Sarma2014; Ma et al., Reference Ma, Xi, He, Ayoko, Zhu and Zhu2016). According to Grauer et al. (Reference Grauer, Malter, Yariv and Avnir1987), at pH values >4, rhodamine B occurs both in the form of positively charged RhBH+ and neutral RhB± (zwitterion form) ions. The proportion of this dipolar species (RhB±) increases with pH at the expense of RhBH+ ions. In the case of zwitterions, the presence of the negative charge makes their penetration into the interlayer space of the clay very difficult.
Effect of pH and solid/solution ratio (R) on the sorption of rhodamine B on the Na-Bd clay.

Effect of solid/solution ratio
Τhe sorption of the dye on Na-Bd is affected by the solid/solution ratio (R) (Fig. 7). The equilibrium sorption capacity increases by a factor of 2.9 for a decrease of R from 0.8 to 0.2 g L–1, which is in accord with previous studies (López Arbeloa et al., Reference López Arbeloa, Chaudhuri, López Arbeloa and López Arbeloa2002; Li et al., Reference Li, Liu and Zhu2010; Bhattacharyya et al., Reference Bhattacharyya, SenGupta and Sarma2014). This increase is attributed to the fact that when the mass of the adsorbent increases, the crystallites tend to agglomerate, which reduces the total surface area of the adsorbent and increases the diffusional path length for the dye cations to reach the active sites.
Sorption isotherms
Experimental results for rhodamine B sorption onto the Na-Bd clay were fitted with the Freundlich and Langmuir models, which are often used to describe adsorption processes and in which linear forms are expressed in Eqs 3 and 4, respectively (Freundlich, Reference Freundlich1906; Langmuir, Reference Langmuir1916), and the nonlinear form of the Sips is expressed in Eq. 5 (Sips, Reference Sips1948):
 $${\rm \;Ln\lpar }{Q}_{\rm e}\rpar = {\rm Ln\lpar }{\rm K}_{\rm F}\rpar + \displaystyle{ 1 \over {{\rm n}_{\rm F}}}{\rm Ln\lpar }{C}_{\rm e}\rpar $$
 $$\displaystyle{{{C}_{\rm e}} \over {{Q}_{\rm e}}} = \displaystyle{{{ C}_{\rm e}} \over {{\rm Q}_{\rm L}}} + \displaystyle{ 1 \over {{\rm Q}_{\rm L}{\rm b}_{\rm L}}}{\rm \;}$$
 $${Q}_{\rm e} = {\rm \;}\displaystyle{{{\rm Q}_{\rm S}{\rm K}_{\rm S}{C}_{\rm e}^{{ 1 \over {{\rm n}_{\rm S}}}} } \over { 1 + {\rm K}_{\rm S}{C}_{\rm e}^{{ 1 \over {{\rm n}_{\rm S}}}} }}{\rm \;}$$
where C e (mmol L–1) is the residual concentration of rhodamine B at equilibrium; Q e (mmol g–1) is the amount of rhodamine B sorbed; KF and nF are Freundlich constants related to the sorption capacity and affinity constants of the sorbent, respectively; QL and bL are the Langmuir constants related to the maximum monolayer sorption capacity and the sorption equilibrium constant, respectively; and KS (L mmol–1)1/ns, QS (mmol g–1) and nS are Sips constants related to the affinity constant, maximum sorption capacity and the Sips parameter that qualitatively characterizes the heterogeneity of the adsorbate–adsorbent system.
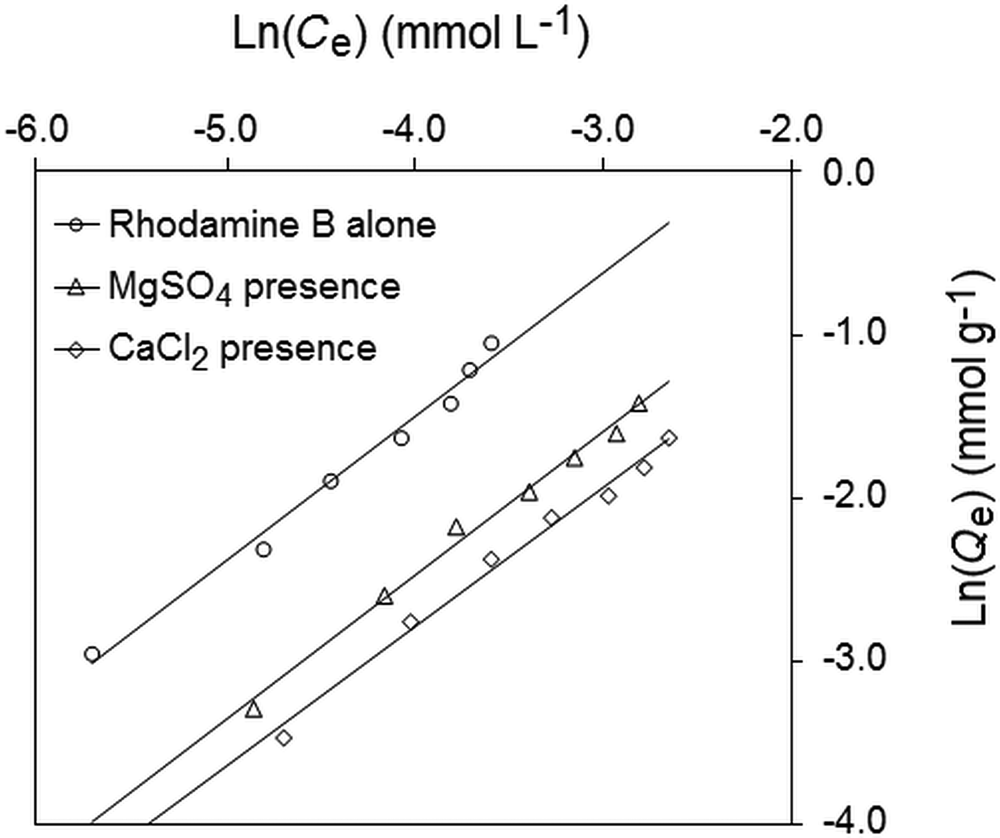
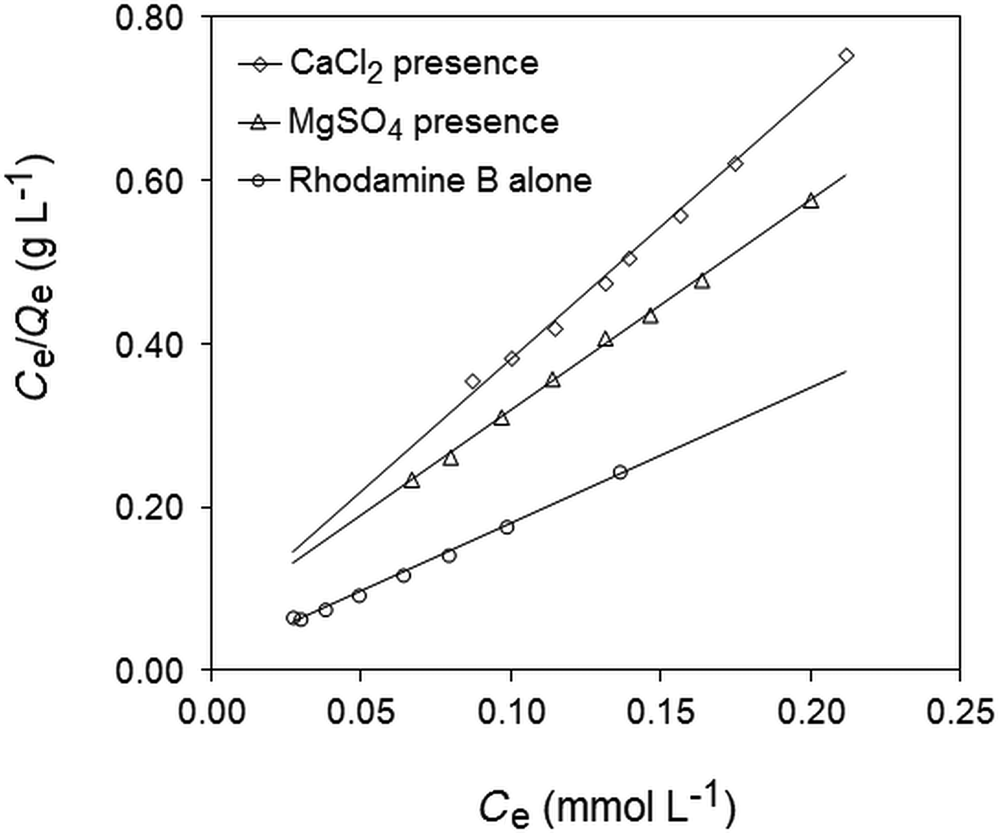
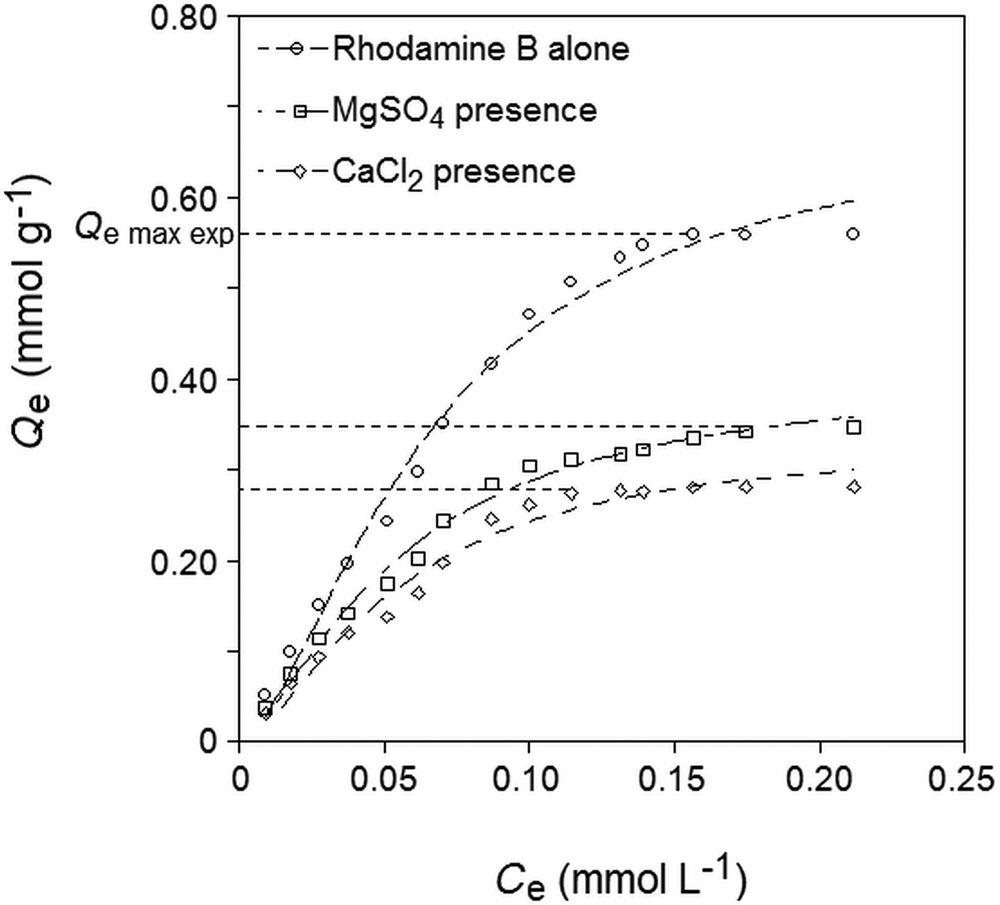
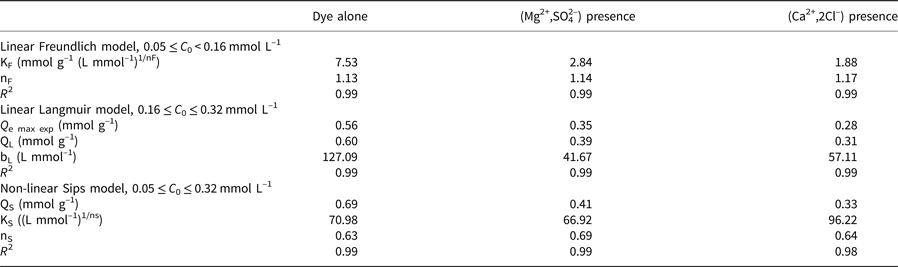
The Freundlich isotherm model, in the range of initial concentrations <0.16 mmol L–1, was suitable for describing the sorption of rhodamine B on the Na-Bd clay (Figs 8 & 9). For concentrations ≥0.16 mmol L–1, the Langmuir isotherm better describes the sorption of the dye. In addition, the non-linear Sips isotherm fits well to the experimental data over the whole range of initial concentrations of rhodamine B (Fig. 10), with the coefficients of determination (R 2) very close to 0.99 (Table 3). However, the values of the maximum sorption capacity (QS) estimated from this model were greater than the experimental values (Q e max exp) (Fig. 10 & Table 3).
Linear Freundlich sorption isotherms for the sorption of rhodamine B on the Na-Bd clay.

Linear Langmuir sorption isotherms for the sorption of rhodamine B on the Na-Bd clay.

Sorption isotherms of rhodamine B onto the Na-Bd clay. Experimental results (symbols) and fitting the data with the Sips model (dashed lines).

The isotherm parameters for the sorption of rhodamine B.

Use of the equations of straight lines allowed Freundlich and Langmuir constants to be calculated, which are grouped in Table 3. The maximum sorption capacity (Q max exp) of the Na-Bd clay observed (Table 3), in the absence of competitive ions, was 0.56 mmol g–1, which is less than its measured CEC (0.71 mmol g–1). This suggests that rhodamine B sorption proceeded mainly through cation exchange, in accordance with earlier observations (Grauer et al., Reference Grauer, Malter, Yariv and Avnir1987; Klika et al., Reference Klika, Weissmannová, Čapková and Pospíšil2004). The difference between the amount of the dye sorbed on the Na-Bd clay and its CEC might be attributed, on the one hand, to the competitive effect of the H3O+ ions, given that the operation of sorption was performed at slightly acidic pH values (5.5–6.5) and, on the other hand, to the presence in the solution of the two rhodamine B species (RhBH+ and RhB±). The neutral species is scarcely sorbed on the Na-Bd clay. In addition, the sorption of rhodamine B was affected by the presence of Ca2+ or Mg2+ ions (Table 3), because the sorption capacity of the Na-Bd clay was significantly reduced. Indeed, the Freundlich and Langmuir equilibrium coefficients, KF and QL, which characterize the sorption capacity and the maximum monolayer sorption capacity, respectively, are larger when competing ions are not present. This might be explained by the strong competition between rhodamine B and the ions on the sites available for sorption. As the Ca2+ and Mg2+ ions had greater valence and concentration, their competitive effect on the sorption sites was more significant.
Table 4 summarizes the monolayer sorption capacities of the few smectites for rhodamine B recorded in the literature. The large sorption capacity obtained indicates that the rhodamine B particles had a high affinity for the Na-Bd clay fraction.
Comparison of the sorption capacities of some smectites for rhodamine B.

a pH was not mentioned.
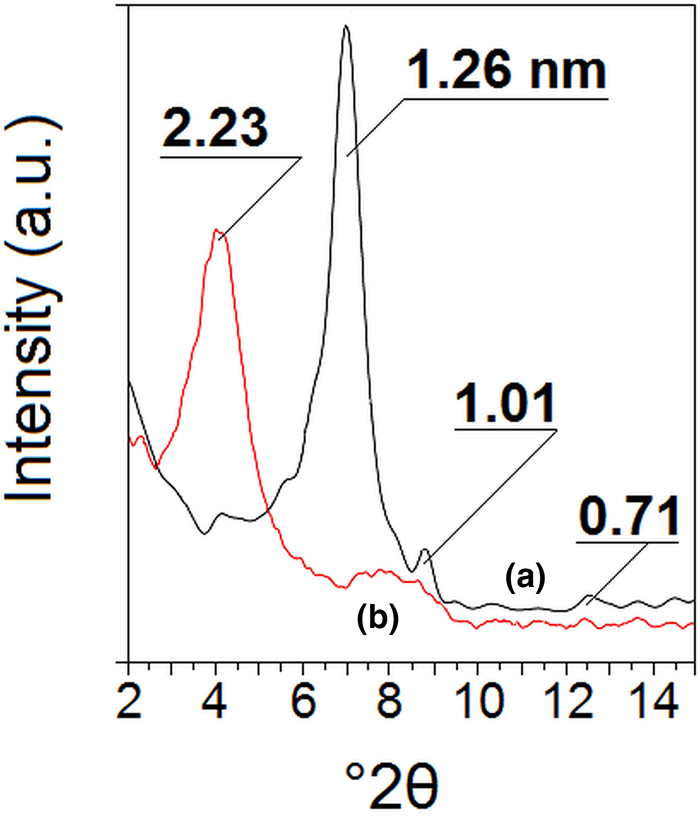
The XRD traces of the Na-Bd clay fraction before and after rhodamine B sorption (Fig. 11) revealed that the reflection at 1.26 nm expanded to 2.23 nm. This result is in good agreement with previous studies for rhodamine B intercalation into montmorillonite (Klika et al., Reference Klika, Weissmannová, Čapková and Pospíšil2004), and it confirms that, under the applied experimental conditions, the exchange phenomena between the sheets are mainly responsible for the retention of this dye.
XRD traces of air-dried oriented aggregates of the Na-Bd clay fraction: (a) before rhodamine B sorption and (b) after rhodamine B sorption.

The FTIR spectrum of the Na-Bd clay fraction after rhodamine B sorption (Fig. 4b) clearly showed several bands belonging to rhodamine B (Fig. 4c), which were absent from the spectrum of the Na-Bd clay before sorption (Fig. 4a). These bands, at 1245, 1345, 1412, 1590, 1715 and 2985 cm–1, have been attributed to rhodamine B (Grauer et al., Reference Grauer, Malter, Yariv and Avnir1987; Pandurangappa & Kumar, Reference Pandurangappa and Kumar2011), indicating that some rhodamine B species were sorbed within the interlayer space of the clay and on the external surface.
Conclusion
The study of the interactions between the fine fraction of a natural clay, largely composed of beidellite, and the basic dye rhodamine B showed that sorption was fast and obeyed pseudo-second-order kinetics. Ion exchange was the main mechanism of the sorption. The maximum sorption capacity was 0.56 mmol of dye per gram of clay. The dye sorption was sensitive to pH changes and was affected by the presence of Ca2+ and Mg2+ ions. These results suggest that beidellite-rich clay minerals, dispersed in soil solutions, might increase the adsorption of rhodamine B from solution. The proximity between the negative charge on the tetrahedral sheet and the interlayer space in beidellite creates a strong electrostatic interaction with this contaminant. It is therefore possible to consider that beidellites could sustainably trap the rhodamine-type dyes within their interlayer spaces. However, desorption studies are necessary to confirm this hypothesis. Finally, the Na-Bd clay fraction might represent an efficient, low-cost alternative for the removal of basic dyes from textile industry wastewaters.