I. INTRODUCTION
Magnesium (Mg) and its alloys as the lightest structural metallic materials have attracted great attention in the aerospace and transport industries in the near decades.Reference Wang, Xu, Wu, Chen, Peng, Jin, Xin, Zhang, Liu, Chen, Chen, Deng and Wang1 However, compared with steels and aluminum (Al) alloys, the relatively low strength and poor ductility of Mg alloys at ambient temperature due to their hexagonal close packed crystal structure hinder their widespread applications. The most common approach of developing Mg alloys with superior performance is micro-alloying.Reference Tong, Zhang, Zhang, Jiang, Xu, Kamado, Zhang, Meng, Cheng and Zhang2,Reference Xu, Pan, Nakata, Qiao, Chi, Zheng and Kamado3 For example, Mg-rare earth (RE) series alloys have attracted increasing attention due to their ultra-high strength and high ductility.Reference Xu, Zheng, Xu, Wu, Wang, Fan and Kamado4,Reference Liu, Chen and Han5 However, the addition of large amounts of heavy RE elements increases the cost.Reference Zhang, Zhang, Xu, Liu, Jiao, Xu, Wang, Meng, Wu and Zhang6 Therefore, it is of significance to develop low cost and high performance magnesium alloys by selecting appropriate alloying elements. Partial substitution of expensive RE by other elements is one way to reduce the cost and has been focused in the recent investigations.Reference Pourbahari, Emamy and Mirzadeh7,Reference Pourbahari, Mirzadeh and Emamy8 For example, the Mg–3Gd–3Al–1Zn (wt%) alloy exhibited much finer microstructure and superior mechanical properties compared with the Mg–6Gd–1Zn (wt%) alloy.Reference Pourbahari, Emamy and Mirzadeh7,Reference Pourbahari, Mirzadeh and Emamy8 The combined addition of Al and Gd was more effective to refine microstructure and enhance the mechanical properties in the Mg–Gd–Al–Zn alloys.Reference Pourbahari, Mirzadeh and Emamy9,Reference Pourbahari, Emamy and Mirzadeh10
The Mg–Zn based alloy is a potential candidate for the development of high strength Mg alloys because high solubility of Zn in Mg could strengthen the matrix through precipitates via proper thermomechanical processesReference Kang, Wang, Deng, Nie, Bai and Li11 or heat treatment.Reference Mendis, Oh-ishi, Kawamura, Honma, Kamado and Hono12 Calcium (Ca) with a large reservoir on earth has a low price, which is capable of reducing flammability,Reference Kim, Chang, Kim and You13 improving oxidation resistance,Reference You, Park and Chung14,Reference Wu, Fan, Gao, Zhai and Zhu15 and enhancing creep resistance.Reference Vogel, Kraft and Arzt16 Additionally, the addition of Ca can effectively refine the microstructure and improve the formability after deformation.Reference Chino, Ueda, Otomatsu, Sassa, Huang, Suzuki and Mabuchi17,Reference Zhang, Guan, Wang, Zhu and Chang18 RE elements’ addition in the Mg alloy can weaken the basal texture or result in the formation of RE texture component.Reference Stanford and Barnett19,Reference Stanford, Atwell and Barnett20 Cerium (Ce) or lanthanum (La), which is relatively cheap compared with heavy RE elements, attracts much attention due to their high efficiency of texture weakening.Reference Du, Zheng, Qiao, Peng and Jiang21 0.02 at.% La addition in the Mg–Zn alloy resulted in a significant texture weakening and gave rise to a superior ductility with the elongation-to-fracture up to 35%.Reference Du, Zheng, Qiao, Peng and Jiang21 Previous investigations suggested that Ca and RE combined addition in Mg alloys optimized the microstructure and enhanced the mechanical properties obviously.Reference Wang, Huang, Chen, Deng, Tang, Jiang and Pan22 For example, a Mg–5.3Zn–0.2Ca–0.5Ce (wt%) extrusion with the tensile yield strength of 268 MPa and an elongation of 16.6% was producedReference Du, Qiao, Zheng, Wu and Xu23; the Mg–5.3Zn–0.5Ca–0.5Ce/La (wt%) alloy exhibited a yield strength of 316 MPa through extrusion and subsequent warming rolling.Reference Tong, Zhang, Zhang, Jiang, Xu, Kamado, Zhang, Meng, Cheng and Zhang2 Especially, we previously detected that the Mg–2.5Zn–0.3Ca–0.4La (wt%) alloy might be high strength and low cost Mg alloys, in which the yield strength of 325 MPa was obtained through extrusion at 350 °C.Reference Du, Qiao, Zheng, Wu and Xu24
It is commonly accepted that deformation parameters have a critical effect on the microstructure and mechanical properties of Mg alloys.Reference Jarzębska, Bieda, Kawałko, Rogal, Koprowski, Sztwiertnia, Pachla and Kulczyk25,Reference Zhang, Wang, Zha, Wang, Yang and Jiang26 For example, the high extrusion ratio resulted in a homogeneous microstructure, while the low extrusion ratio gave rise to the formation of the bimodal microstructure for the Mg–11Gd–4.5Y–1Nd–1.5Zn–0.5Zr (wt%) alloyReference Yu, Huang, Gan, Zhong, Hort and Meng27; the grain size was coarsened and mechanical properties were deteriorated for the Mg–9Gd–3Y–1.5Zn–0.8Zr alloy when deformed at high extrusion speedReference Liu, Zhang, Hu, Le, Bao and Cui28; low temperature deformation was beneficial for the strength improvement in the Mg–5.7Zn–0.54Zr (wt%) alloy.Reference Kim, Baek, Lee and Park29 Therefore, the optimization of deformation parameters is of significance to further enhance the mechanical properties of Mg alloys. However, the relationship between deformation parameters and microstructure evolution of Mg–Zn–Ca–La alloys is still unclear. Therefore, the present work investigated the deformation behaviors and microstructure evolution of the Mg–Zn–Ca–La alloy, in the objective of providing references for further microstructural optimization of the Mg–Zn–Ca–La alloy.
II. EXPERIMENTAL PROCEDURES
Commercial high-purity Mg (99.9%, mass fraction), Zn (99.9%), Mg–15% Ca, and Mg–30% La master alloys were melted at 720 °C in an electric resistance furnace under the protection of a mixed gas atmosphere of SF6 and CO2. The melts were kept at 720 °C for 10 min and then poured into the cooling crystallizer. The casting machine worked with the casting speed of 38 mm/min during the semicontinuous direct-chill casting process. The Mg–3Zn–0.3Ca–0.4La (wt%) alloy ingot with the diameter of 90 mm and the length of 1300 mm was fabricated. The detailed casting procedure was also described elsewhere.Reference Du, Qiao, Zheng, Wu and Xu24 The casting ingots were homogenized at 400 °C for 12 h by quenching into water, and then machined into cylindrical samples with a diameter of 8 mm and a height of 12 mm for the isothermal compression test. The compression tests were carried out on a Gleeble-1500 thermomechanical simulator testing system. The specimens were heated at a heating rate of 5 K/s to deformation temperatures and held for 1 min to obtain a stable and uniform temperature prior to deformation (Dynamic Systems Inc., Tarrytown, New York). The specimens were compressed to a height reduction of 60% (corresponding to a true strain of 1.0) at the temperatures of 250 °C, 300 °C, and 350 °C and average strain rates of 0.001, 0.01, 0.1, and 1 s−1, respectively. After hot compression, the specimens were immediately quenched into water within 5 s to preserve the microstructure.
For microstructural observations, the deformed samples were conventionally polished and etched in acetic picral. Microstructures of the as-compressed specimens were examined at the central part of the section parallel to the compression direction using optical microscopy (OM), a Hitachi S-4800 (Hitachi, Tokyo, Japan) scanning electron microscope (SEM). The average grain size and volume fraction of dynamical recrystallization were measured using Image-Pro Plus 5.0 software (Media Cybernetics, Rockville, Maryland).
III. RESULTS AND DISCUSSION
A. Compressive deformation behavior
Figure 1 presents the true compressive stress–strain curves of the as-homogenized Mg–Zn–Ca–La alloy. The flow curves exhibited typical characteristics of dynamic recrystallization. The stress was increased with the increase of strain at the initial stage of deformation due to work hardening, then a peak stress was reached. With the further increase of strain, flow stress decreased because the strengthening effect caused by work hardening was weaker compared with the softening effect from dynamical recrystallization. Finally, a steady state was achieved when work hardening and dynamic softening reached a balance.
True compressive stress–strain curves of the samples compressed at the strain rate of (a) 0.001 s−1, (b) 0.01 s−1, (c) 0.1 s−1, and (d) 1 s−1.
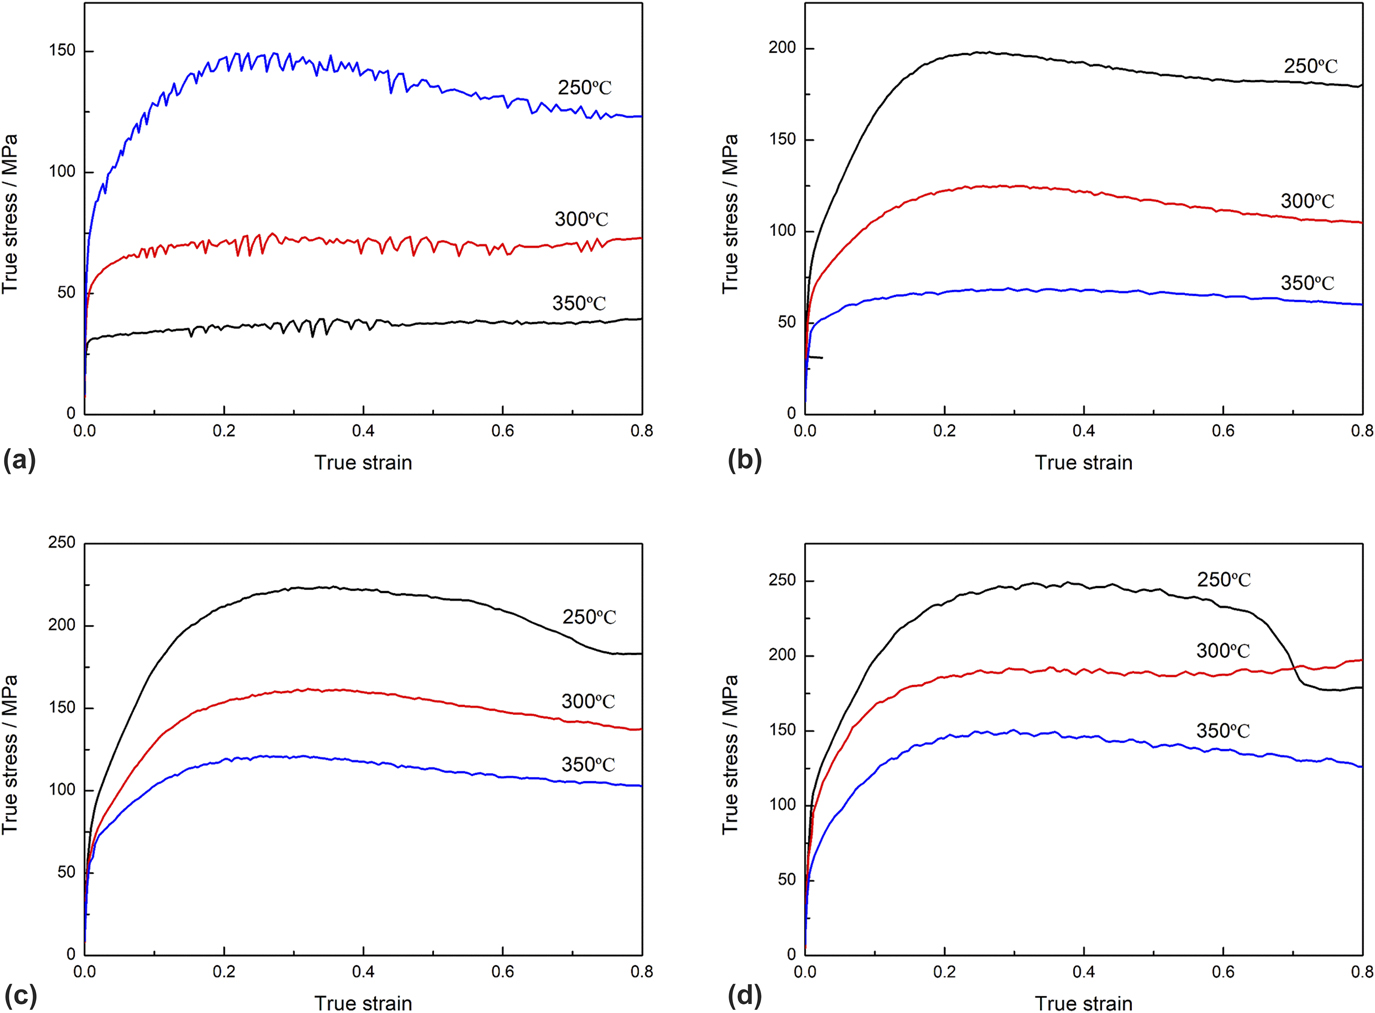
The samples compressed with high temperatures and low strain rates exhibited a low flow stress, which was because high temperature supplied high dislocation mobilityReference Ou, Nie and Zheng30 and low strain rate provided enough time for the accumulation of activation energy.Reference Liao, Wu, Zhou and Yang31 It should be noticed that the samples deformed with the strain rate of 0.001 s−1 exhibited an obvious serrated flow characteristic, which might be related to the dynamic strain aging effect.Reference Lu, Yin, Huang, Quan, Zeng, Zhou and Wang32 The solute atoms had enough time to diffuse to dislocation when deformed at low strain rate, which would exert a drag force for dislocation movement. Subsequent applied stress promoted the dislocation to overcome the drag force and move freely. Then the process repeated during deformation, leading to the serrations in the stress–strain curves. The sample deformed at 250 °C with the strain rate of 1 s−1 showed a very rapid decline after the strain of 0.6, which was related to the formation of the crack during deformation.
During hot compression deformation, the relationship of deformation temperature and strain rate on flow stress can be described by a hyperbolic sine-type constitutive equationReference Lv, Peng, Wang, An, Zhong, Tang and Pan33:
 $$\dot{\varepsilon } = A{\left[ {\sinh \left( {\alpha \sigma } \right)} \right]^n}\exp \left( {{{ - Q} / {RT}}} \right)\quad ,$$
where  $\dot{\varepsilon }$ is the strain rate (s−1), A is the structure factor, α is the material constant, σ is the peak stress (MPa), n is the stress exponent, Q is the deformation activation energy (kJ/mol), R is the gas constant (8.314 J/mol), and T is the absolute temperature during hot deformation.
To calculate the value of α in Eq. (1), the other two conventional equations were used to describe the relationship between deformation parameters and flow stress. Normally, the power law was used at the low stress level [Eq. (2)], while exponential law was used at the high stress level [Eq. (3)].
 $$\dot{\varepsilon } = {A_1}{\sigma ^{{n_1}}}\exp \left( {{{ - Q} / {RT}}} \right)\quad ,$$
 $$\dot{\varepsilon } = {A_2}\exp \left( {\beta \sigma } \right)\exp \left( {{{ - Q} / {RT}}} \right)\quad ,$$
where n 1 is the stress exponent and A 1, A 2, and β are the material constants. By taking the natural logarithm on both sides of Eqs. (2) and (3), simplified equations can be obtained as follows:
 $$\ln \dot{\varepsilon } = {n_1}\ln \sigma + \ln {A_1} - {Q / {\left( {RT} \right)\quad ,}}$$
 $$\ln \dot{\varepsilon } = \beta \sigma + \ln {A_2} - {Q / {\left( {RT} \right)}}\quad .$$
According to Eqs. (4) and (5),  ${n_1} = {{\partial \ln \dot{\varepsilon }} / {\partial \ln \sigma }}$,
 $\beta = {{\partial \ln \dot{\varepsilon }} / {\partial \sigma }}$, and α = β/n 1. The relationships of
 $\ln \dot{\varepsilon } - \ln \sigma$ and
 $\ln \dot{\varepsilon } - \sigma$ at different temperatures are plotted in Fig. 2. Therefore, the average values of n 1 and β were determined to be 8.5538 and 0.0641, respectively. Then the average α value of the alloy is calculated as α = β/n 1 = 0.0075 MPa−1.
Relationship between strain rate and flow stress (a)  $\ln \dot{\varepsilon } - \ln \sigma$ and (b)
 $\ln \dot{\varepsilon } - \sigma$.

The Zener–Hollomon (Z) parameter can integrate the effects of deformation temperature and strain rate on the flow stress during hot deformation, which can be expressed as followsReference Nie, Kang, Deng, Wang, Guo and Wang34:
 $$Z = \dot{\varepsilon }\exp \left( {{Q \over {RT}}} \right) = A{\left[ {\sinh \left( {\alpha \sigma } \right)} \right]^n}\quad .$$
By taking the natural logarithm on both sides of Eq. (6), the following equation could be obtained:
 $$n = {\left\{ {{{\partial \ln \dot{\varepsilon }} \over {\partial \ln \left[ {\sinh \left( {\alpha \sigma } \right)} \right]}}} \right\}_T}\quad ,$$
 $$Q = {\rm{Rn}}{\left\{ {{{\partial \ln \left[ {\sinh \left( {\alpha \sigma } \right)} \right]} \over {\partial \left( {{1 / T}} \right)}}} \right\}_{\dot{\varepsilon }}}\quad .$$
The relationships of  $\ln \dot{\varepsilon } - \ln \left[ {\sinh \left( {\alpha \sigma } \right)} \right]$ under different temperatures and ln[sinh(ασ)] − 1/T under different strain rates are plotted in Fig. 3. Then the average activation energy Q was estimated to be 188.9 kJ/mol, which was higher than that for lattice diffusion of magnesium (135 kJ/molReference Mirzadeh, Roostaei, Parsa and Mahmudi35). The high Q value for the Mg–Zn–Ca–La alloy might be attributed to the existence of precipitates and fine microstructure. Precipitates could effectively hinder dislocation motion during deformation and exerted resistant force for lattice self-diffusion, as pointed out in the SiC reinforced Al matrix.Reference Mirzadeh36 The fine dynamically recrystallized (DRXed) grains provided more grain boundaries acting as barriers to the movement of dislocations and lattice self-diffusion. Additionally, the addition of alloying elements had a significant effect on the activation energy, which was detected in steels and Al alloys.Reference Lino, Guadanini, Silva, Neto and Barbosa37,Reference Odoh, Mahmoodkhani and Wells38 0.2 wt% Cr addition in the Al–Mg–Si alloy hinders the movement of dislocation, which led to the increase of flow stress and activation energy due to the effect of solution strengthening.Reference Odoh, Mahmoodkhani and Wells38 Therefore, Ca or La in the Mg–Zn–Ca–La alloys with slow diffusion velocity compared with the matrix would serve as barriers to dislocation movement. Meanwhile, Ca or La preferred to segregate to dislocation or grain boundaries due to the large atomic radius,Reference Zeng, Zhu, Xu, Bian, Davies, Birbilis and Nie39 which could exert extra force for the mobility of dislocation or grain boundaries. It might be another reason for the high activation energy in the Mg–Zn–Ca–La alloy.
Variation of (a)  $\ln \dot{\varepsilon } - \ln \left[ {\sinh \left( {\alpha \sigma } \right)} \right]$ at different temperatures and (b) ln[sinh(ασ)] − (1/T) at different strain rates.

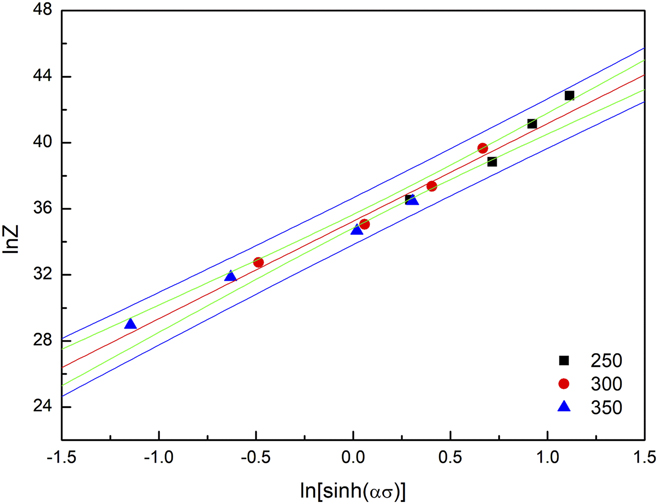
Then the Zener–Hollomon parameters were obtained, shown in Table I. According to Eq. (6), the values of the related parameters A and n of the constitutive equation can be determined by linear fitting curves of ln Z and ln[sinh(ασ)] (Fig. 4). By substituting activation energy Q into Eq. (6), the constitutive equation for the Mg–Zn–Ca–La alloy can be expressed as follows:
 $$\dot{\varepsilon } = 2.1807 \times {10^{15}}{\left[ {\sinh \left( {0.0075\sigma } \right)} \right]^{5.925}}\exp \left( { - {{188.9 \times {{10}^3}} \over {8.314T}}} \right)\quad .$$
Zener–Hollomon parameters for the Mg–Zn–Ca–La alloy compressed at different conditions.

Relationship between Zener–Hollomon parameter and peak stress in hot compression tests.

As can be seen in Fig. 4, these data points were close to the center of the fit line obtained by linear fit. The corresponding 95% confidence band for this fit was plotted by two lines adjacent to the fitting line. Meanwhile, the data points fell within the prediction band (the outer lines) corresponding to the 95% confidence band.
B. Processing map
The processing map was usually used to investigate the workability of metal materials and to analyze the evolution of the microstructure using power dissipation efficiency during deformation. The efficiency of power dissipation (η) can be expressed as followsReference Xu, Pan, Nakata, Qiao, Chi, Zheng and Kamado3:
 $$\eta = {J \over {{J_{\max }}}} = {{2m} \over {m + 1}}\quad ,$$
where  $m = {\left( {{{\partial \ln \sigma } \over {\partial \ln \dot{\varepsilon }}}} \right)_{\varepsilon {\rm{,}}T}}$ is the strain rate sensitivity coefficient. The value of η represented the energy of power dissipation used for dynamic recrystallization but could not characterize the ability of workability of materials because the energy of power dissipation located in the instability region of the material might have a large value. The instability region could be obtained by the instability criterion,Reference Sun, Liu, Wang, Shu-Bo, Xian and Wen-Bo40 which was described as follows:
 $${\xi _{\left( {\dot{\varepsilon }} \right)}} = {{\partial \ln \left[ {{m / {\left( {m + 1} \right)}}} \right]} \over {\partial \ln \dot{\varepsilon }}} + m \lt 0\quad ,$$
where  ${\xi _{\left( {\dot{\varepsilon }} \right)}}$ is the instability parameter related to strain rate and deformation temperature. An instability map defined instability domains with
 ${\xi _{\left( {\dot{\varepsilon }} \right)}} \lt 0$. In general, stability domains corresponded to dynamic recrystallization, which reflected better workability. Therefore, the stability domains were selected to be deformation window. However, the instability domains corresponded to adiabatic shear band and crack propagation.Reference Xu, Pan, Nakata, Qiao, Chi, Zheng and Kamado3 Therefore, the processing map could be constructed through the overprinting of the dissipation map and an instability map.
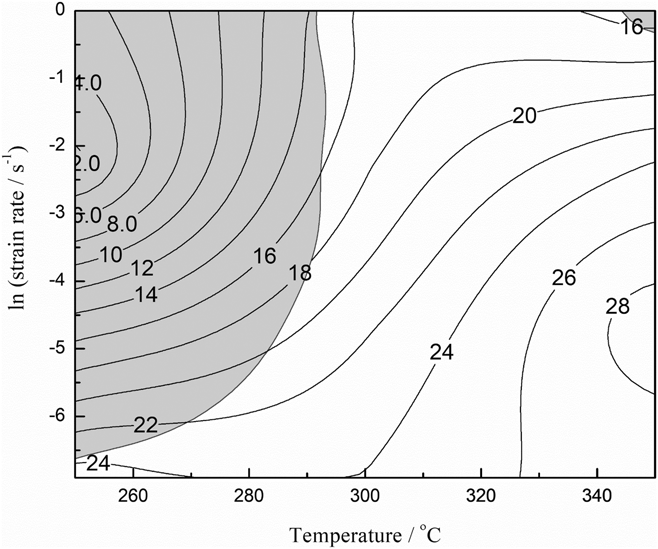
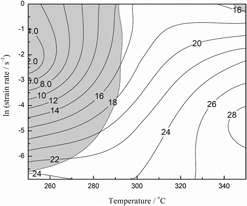
Figure 5 shows the processing map obtained at a compressive true strain of 0.8. The counter number signified the efficiency of power dissipation and the shaded area corresponded to the flow instability. It could be seen that the instability region was mainly distributed at temperature ranging from 250 to 300 °C and the strain rate ranging from 0.001 to 1 s−1. The power dissipation efficiency was high and no flow instability was detected when the deformation was at a temperature of 300–350 °C and a strain rate of 0.001–0.01 s−1. This was related to the stable microstructure of the alloy after hot deformation. The increase fraction of DRX would decrease dislocation density and reduce the stress concentration because high temperature enhanced the diffusion rate and thermal agitation of atoms and low strain rate provided enough time for dislocations to move.Reference Liu, Liu, Zhao, Huang and Chen41
Processing map of the Mg–Zn–Ca–La alloy compressed to a strain of 0.8 (the efficiency of power dissipation in percent is indicated by the contour values).

The optimum processing parameter domains for magnesium alloys were generally located at a high power dissipation efficiency between 35 and 45%, in which stable flow gave rise to a stable microstructure and improved workability via dynamic recrystallization.Reference Wang, Xu, Wang, Zheng, Cui and Yang42 However, the peak efficiency values obtained for the Mg–Zn–Ca–La alloy were approximately 30%, which indicated that incomplete dynamic recrystallization occurred during hot compression. Considering both the power dissipation efficiency and stability, the optimum hot working window was suggested to be the temperature of 350 °C and the strain rates between 0.001 and 0.01 s−1.
C. Microstructure analysis
Grain refinement could affect the mechanical properties of the magnesium alloys significantly, which was commonly achieved by dynamic recrystallization during hot deformation processing. Therefore, it is of significance to investigate the effects of deformation conditions on dynamic recrystallization. The kinetics of dynamic recrystallization can be expressed by the Avrami equationReference Yu, Zhang, Wang, Yin, Cui and Qi43:
 $${X_{{\rm{DRX}}}} = 1 - \exp \left[ { - k{{\left( {{{\varepsilon - {\varepsilon _{\rm{c}}}} \over {{\varepsilon ^ * }}}} \right)}^{{n_{\rm{m}}}}}} \right]\quad ,$$
where X DRX is the DRX volume fraction; εc is the critical strain of the initiation of DRX, which is the strain of the minimum point of −(∂2σ/∂σ∂ε); ε* is the strain for the maximum softening rate, which corresponds the strain of the lowest work hardening rate; k and n m are the material constants.
In addition, the relationship between X DRX and flow stress can be expressed as follows:
 $${X_{{\rm{DRX}}}} = {{{\sigma _{\rm{p}}} - \sigma } \over {{\sigma _{\rm{p}}} - {\sigma _{{\rm{ss}}}}}}\quad ,$$
where σp is the peak stress and σss is the steady-state stress. According to Eqs. (12) and (13), the mean values of k and n under different conditions are obtained to be 0.7267 and 2.1365, respectively. Thus, the kinetic model of DRX evolution of the Mg–Zn–Ca–La alloy can be expressed as follows:
 $${X_{{\rm{DRX}}}} = 1 - \exp \left[ { - 0.7267{{\left( {{{\varepsilon - {\varepsilon _{\rm{c}}}} \over {{\varepsilon ^ * }}}} \right)}^{2.1365}}} \right]\quad .$$
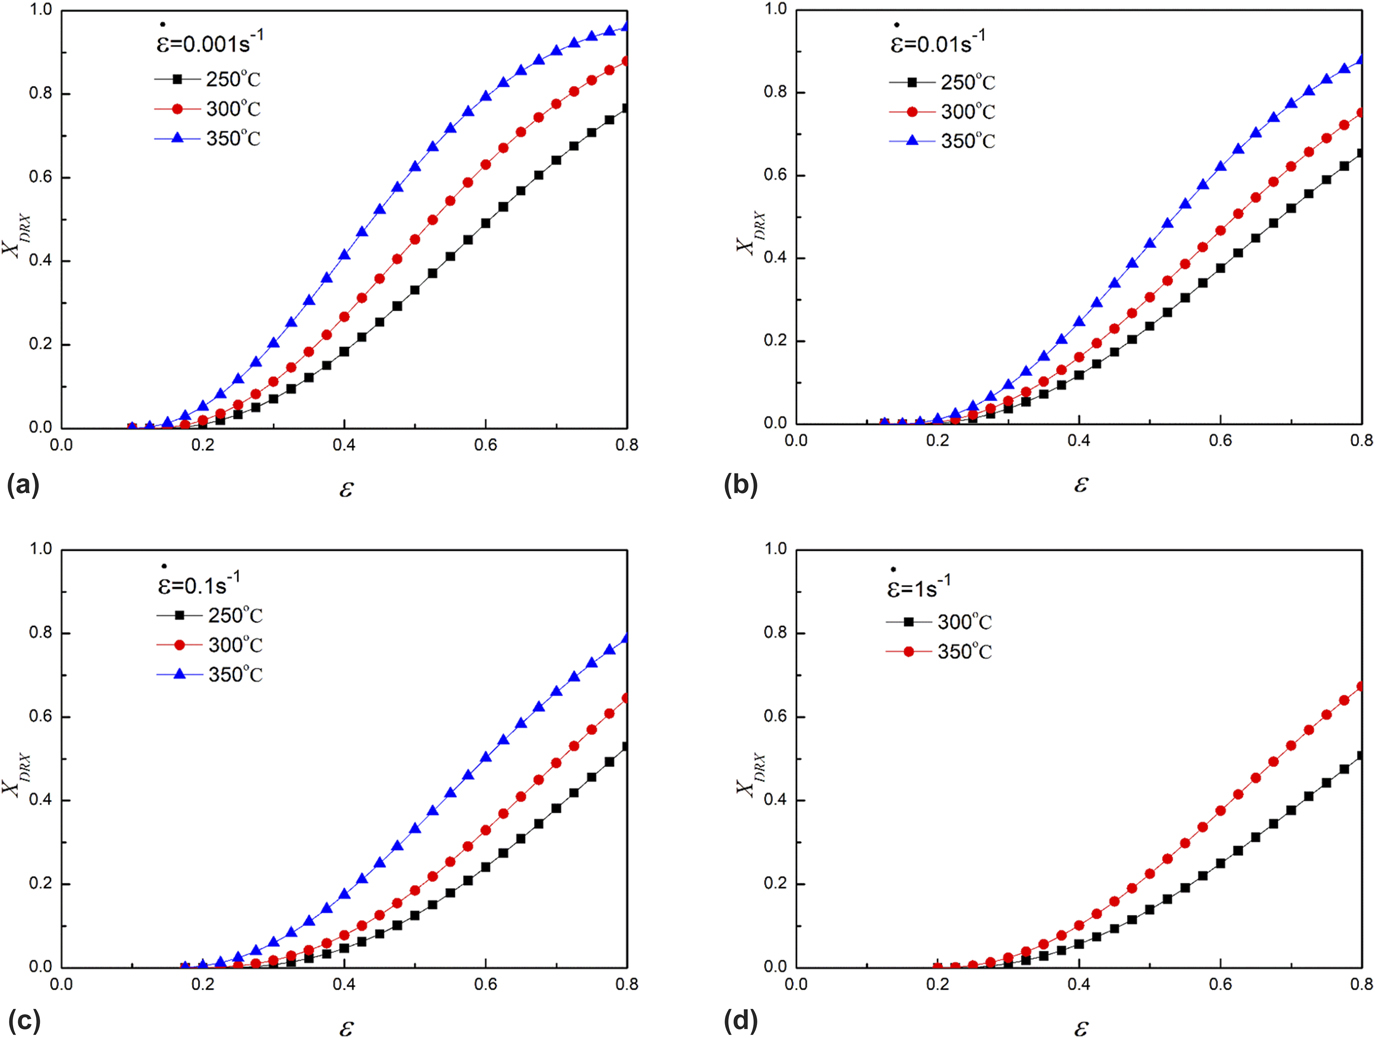
Then the variation of volume fraction of the DRXed region with deformation parameters can be theoretically predicted, as shown in Fig. 6. It is observed that the volume fraction of DRX increased with increasing strain. Moreover, the DRX volume fraction also strongly depended on the deformation temperatures and strain rates.
Predicted evolution of DRX volume fraction for samples deformed under different strain rates: (a) 0.001 s−1, (b) 0.01 s−1, (c) 0.1 s−1, and (d) 1 s−1.

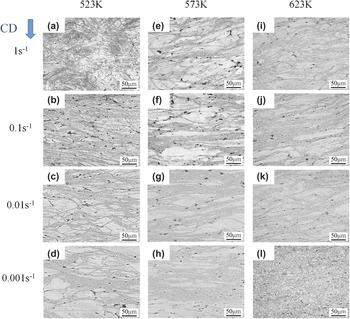
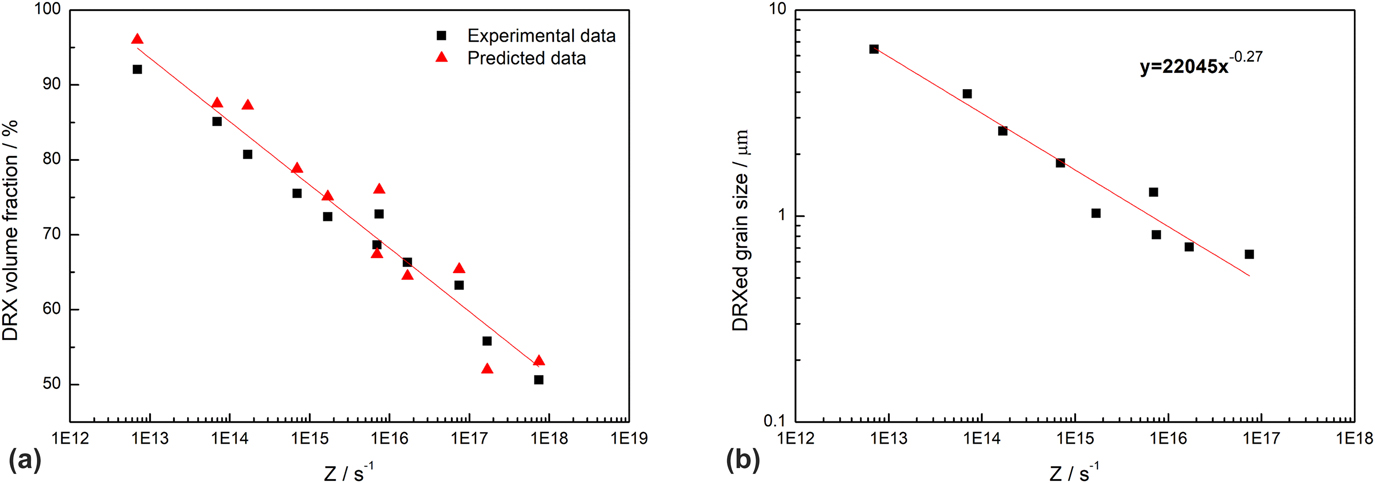
Figure 7 shows the optical microstructures of the as-compressed Mg–Zn–Ca–La alloys. When the samples were deformed at low temperature and high strain rate, large amounts of deformed microstructure were detected, as shown in Figs. 7(a) and 7(b). With the increase of deformation temperature from 250 to 350 °C and decrease of strain rate from 1 to 0.001 s−1, the fraction of dynamic recrystallization was increased. When the sample was deformed at the temperature of 350 °C and the strain rate of 0.001 s−1, dynamic recrystallization almost completed [Fig. 7(l)]. Figure 8(a) shows the relationship between Zener–Hollomon parameter and DRX volume fraction (V DRX), the black and red data points represented the experimental data and the predicted data according to the DRX kinetic model of the Mg–Zn–Ca–La alloy, respectively. It could be seen that the experimental data were basically consistent with the predicted data. Thus, the DRX kinetic model for the Mg–Zn–Ca–La alloy could be used to predict the DRX volume fraction of the Mg–Zn–Ca–La alloy.
OM images of the Mg–Zn–Ca–La alloy compressed with different deformation parameters: (a) 250 °C, 1 s−1; (b) 250 °C, 0.1 s−1; (c) 250 °C, 0.01 s−1; (d) 250 °C, 0.001 s−1; (e) 300 °C, 1 s−1; (f) 300 °C, 0.1 s−1; (g) 300 °C, 0.01 s−1; (h) 300 °C, 0.001 s−1; (i) 350 °C, 1 s−1; (j) 300 °C, 0.1 s−1; (k) 300 °C, 0.01 s−1; (l) 300 °C, 0.001 s−1. (CD represents compression direction).

Effect of Zener–Hollomon parameter on (a) recrystallized volume fraction and (b) DRX grain size of the Mg–Zn–Ca–La alloy.

The above microstructural observations indicated that the deformation temperature and the strain rate affect the evolution of dynamic recrystallization. Additionally, the DRXed grain size varied when deformed with different Zener–Hollomon parameters. Figure 8(b) shows the relationship between Zener–Hollomon parameter and DRX grain size. It could be seen that the DRXed grain size was decreased with the increase of Zener–Hollomon parameters. A linear exponential equation was proposed to describe the relationship between the DRX grain size and Z parameters, which could be expressed as followsReference Fatemi-Varzaneh, Zarei-Hanzaki and Beladi44:
 $${D_{{\rm{DRX}}}} = A{Z^{ - n}}\quad ,$$
where A is a material constant and n is the power law exponent. Prediction of grain size could be evaluated by power law exponent n. High n value indicated the fine DRX grain size against Z. BeerReference Barnett, Keshavarz, Beer and Atwell45 reported a range of 0.09–0.13 for n in the AZ31 alloy after various deformation modes. The n value of the Mg–Zn–Ca–La alloy in the present study was almost double (0.27) compared with the maximum value of n in AZ31, which indicated that the DRXed grains had a low growth rate for the Mg–Zn–Ca–La alloy. It should be related to the existence of the second phase.
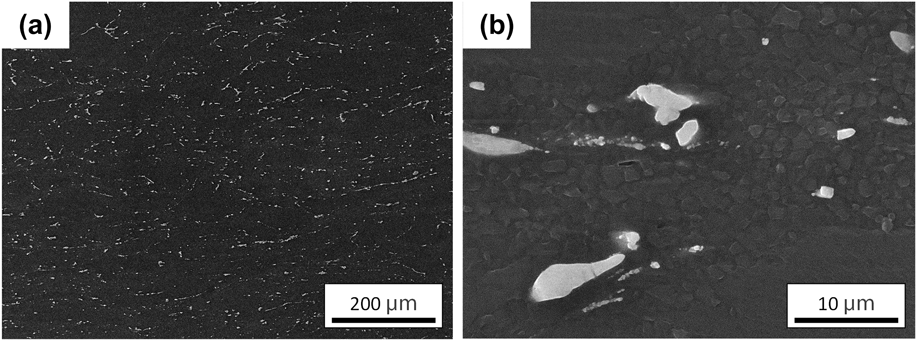
The distribution of the precipitates played an obvious role in the microstructure after dynamic recrystallization. The SEM images of the Mg–Zn–Ca–La alloy specimens compressed with the Zener–Hollomon parameter of 6.97 × 10¹⁴ to true strain of 1 are shown in Fig. 9. It could be seen that the coarse second phases were broken into small particles, which was covered by DRXed grains. This indicated that the second phase stimulated nucleation of dynamic recrystallization. Moreover, part second phases were fragmented to be small particles, which could act as obstacles for grain boundary mobility. Therefore, the existence of second phases in the Mg–Zn–Ca–La alloy was beneficial for grain refinement, which resulted in a small grain growth tendency by contrast to the AZ31 alloy.Reference Fatemi-Varzaneh, Zarei-Hanzaki and Beladi44
SEM images of the samples compressed with Zener–Hollomon parameters of 6.97 × 10¹⁴ to the true strain of 1: (a) low magnification and (b) high magnification.

According to the above discussion, it could be found that deformation parameters had a significant effect on the microstructure of the Mg–Zn–Ca–La alloy. The optimum hot working window was established at the temperature of 350 °C and the strain rate between 0.001 and 0.01 s−1. However, the DRXed grains size was large under this deformation condition, which might result in the deterioration of strength. The samples deformed with other deformation parameters such as low temperature exhibited fine DRXed grains, but the workability would be reduced. Therefore, the optimization of deformation parameters was of great significance to the improvement of the microstructure and mechanical properties of the Mg–Zn–Ca–La alloy.
IV. CONCLUSIONS
In the present work, the hot deformation behavior and processing map of the Mg–Zn–Ca–La alloy were investigated during compression at 250–350 °C with strain rates from 0.001 to 1 s−1. The main conclusions are summarized as follows:
(1) The average activation energy Q of the Mg–Zn–Ca–La alloy was calculated as 188.9 kJ/mol.
(2) The hot deformation behaviors of the Mg–Zn–Ca–La alloy can be described by constitutive equation in hyperbolic sine law as follows:
 $$\dot{\varepsilon } = 2.1807 \times {10^{15}}{\left[ {\sinh \left( {0.0075\sigma } \right)} \right]^{5.925}}\exp \left( { - {{188.9 \times {{10}^3}} \over {8.314T}}} \right)\quad .$$
(3) According to the established processing map, the optimum hot working window for the alloy was determined as follows: deformation temperature 350 °C and strain rate from 0.001 to 0.01 s−1.
(4) The kinetics of DRX evolution of the Mg–Zn–Ca–La alloy is determined as
 $${X_{{\rm{DRX}}}} = 1 - \exp \left[ { - 0.7267{{\left( {{{\varepsilon - {\varepsilon _{\rm{c}}}} \over {{\varepsilon ^ * }}}} \right)}^{2.1365}}} \right]\quad .$$
(5) Deformation parameters had a critical effect for microstructure optimization of the Mg–Zn–Ca–La alloy.
ACKNOWLEDGMENT
This study was supported by Shaanxi Provincial Department of Education Fund (No. 17JK0538).