INTRODUCTION
Estuarine ecosystems provide goods and services with high economic value (Costanza et al., Reference Costanza, Darge, Degroot, Farber, Grasso, Hannon, Limburg, Naeem, O'Neill, Paruelo, Raskin, Sutton and Vandenbelt1997). Throughout the world, estuaries and associated coastal waters support numerous essential fisheries (Beck et al., Reference Beck, Heck, Able, Childers, Egglestone, Gillanders, Halpern, Hays, Hoshino, Minello, Orth, Sheridan and Weinstein2001). These systems are particularly used by juveniles of many fish species in temperate areas (such as sea bass, sprat and flatfish; e.g. Martinho et al., Reference Martinho, Leitão, Neto, Cabral, Marques and Pardal2007; Selleslagh & Amara, Reference Selleslagh and Amara2008) because of the potential advantages they provide compared to adjacent areas: refuge from predators, good environmental conditions and high prey availability (Beck et al., Reference Beck, Heck, Able, Childers, Egglestone, Gillanders, Halpern, Hays, Hoshino, Minello, Orth, Sheridan and Weinstein2001). For these reasons, estuaries have been considered as nursery grounds which are favourable for the growth and survival of juvenile fish (e.g. Amara et al., Reference Amara, Selleslagh, Billon and Minier2009; Franco et al., Reference Franco, Fiorin, Zuchetta, Torricelli and Franzoi2010). Macrobenthic communities have been recognized as key components in the functioning of estuarine systems since they are one of the structuring elements of the food web (Herman et al., Reference Herman, Middelburg, Van de Koppel and Heip1999) and support higher trophic levels such as shrimps, crabs, birds and fish in most estuaries and near-shore marine environments (Barry et al., Reference Barry, Yoklavich, Cailliet, Ambrose and Antrim1996). Regarding fish, macrobenthos represents the main food items of many estuarine species (Gibson, Reference Gibson1994; Ysebaert et al., Reference Ysebaert, Meire, Coosen and Essink1998) and one of the main driving forces determining tidal migrations within shallow water areas (Gibson, Reference Gibson1994; Vinagre et al., Reference Vinagre, França and Cabral2006). These authors reported that the distribution and migrating behaviour of juvenile flatfish are influenced by the benthic invertebrate community, which constitutes their food supply. In order to interpret the functioning of an estuarine habitat and to analyse food webs, Bremner et al. (Reference Bremner, Rogers and Frid2006) reported that it is necessary to consider prey distribution and availability.
The relationship between organisms' distribution and their habitat is of central importance in ecology. Since estuaries provide diverse habitats in terms of spatial heterogeneity in physical and chemical conditions, the relationship between environmental factors and the distribution of organisms within estuaries has received a lot of attention (e.g. Ysebaert et al., Reference Ysebaert, Meire, Coosen and Essink1998). Diversity and/or density of macrobenthos are known to vary at many different temporal and spatial scales (Desprez et al., Reference Desprez, Ducrotoy and Sylvand1986; Ysebaert & Herman, Reference Ysebaert and Herman2002). In estuarine systems, these fluctuations have been often correlated with environmental variables (McLusky & Elliott, Reference McLusky and Elliott2004) with a strong importance of salinity and sediment composition at a spatial scale (e.g. Ysebaert & Herman, Reference Ysebaert and Herman2002). Knowledge of the spatial distribution patterns of macrobenthos along the estuarine gradient might help to identify the linkages between species distributions and ecological processes and therefore gain insight into the functioning of estuarine ecosystems (Thrush et al., Reference Thrush, Lawrie, Hewitt, Cummings, Gray, Ambrose and Szaniawska1999), which is essential for implementation of integrated estuarine management.
Along the French coast of the Eastern English Channel (EEC), estuaries are known to support a large number of fish and macrocrustacean species and have been described as important nursery areas, as well as residence habitats for permanent species (Selleslagh & Amara, Reference Selleslagh and Amara2008; Selleslagh et al., Reference Selleslagh, Amara, Laffargue, Lesourd, Lepage and Girardin2009). Due to their nursery function, a high density of food resource is assumed in EEC estuaries; however, this aspect has never been verified until now. Indeed, in spite of the important role of these habitats, detailed information concerning the structure and the dynamics of food resources are still scarce or unknown in these estuaries. Actually, only the two largest EEC estuaries have been studied: the Seine (Desroy et al., Reference Desroy, Janson, Denis, Charrier, Lesourd and Dauvin2007; Dauvin & Ruellet, Reference Dauvin and Ruellet2008) and the Somme (Desprez et al., Reference Desprez, Ducrotoy and Sylvand1986; Ducrotoy & Elkaim, Reference Ducrotoy and Elkaim1992). Considering that macrobenthic organisms represent the main prey items for fish and macrocrustaceans in EEC estuaries (Selleslagh, Reference Selleslagh2008), macrobenthos can be used to estimate food resources in these estuarine nurseries. Whereas most studies on European estuarine macrobenthic assemblages related only to a single estuary and seldom argued for the relative importance of systems as foraging grounds for higher trophic levels (i.e. fish and macroscrustaceans), in the present study we described and compared the macrobenthos, in terms of composition, density, spatial distribution and assemblages in relation with environmental variables, as well as predators, in three EEC estuaries: Canche, Authie and Somme. The aim of the present paper is to assess and compare the potential foraging ground value of the three estuaries during spring, which is the main period of estuarine colonization by juvenile fish species that use the EEC estuaries as nursery areas, examining their macrobenthic community as proxy for this function. The main hypothesis tested in this paper was that macrobenthic resource is high and similar in the three studied EEC estuaries.
MATERIALS AND METHODS
Study areas and sampling
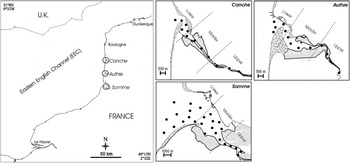
In the present study, three estuaries along the French coast of the EEC were investigated: the Canche (7.8 km2), the Authie (12.8 km2) and the Somme (40.5 km2) (Figure 1). These estuaries are characterized by a semi-diurnal and macrotidal regime, with an average tidal range of 6.9 m for the Canche, 7.2 m for the Authie and 9.8 m for the Somme. The water circulation is mainly dependent on the tides and on a small freshwater input (8, 11 and 35 m3. s−1 in Authie, Canche and Somme respectively). The three estuaries are subject to low anthropogenic disturbance (only a low influence from agriculture occurs) (Delpech et al., Reference Delpech, Courrat, Pasquaud, Lobry, Le Pape, Nicolas, Boët, Girardin and Lepage2010) and can be defined as clean systems (Amara et al., Reference Amara, Meziane, Gilliers, Hermel and Laffargue2007).
Location of the three studied estuaries. Dots represent sampling stations.

Depending on the estuary size, 12 stations were sampled in Canche, 13 in Authie and 26 in Somme (Figure 1). Stations were distributed along the estuarine gradient, where salinity ranged from 0 to 35, and selected in order to sample the entire estuarine areas. According to salinity, three parts were defined in each estuary: upper (0< salinity <5), middle (5< salinity <30) and lower (salinity >30). Sampling was performed in late April 2007. Sampling was carried out at high tide using a small ship and macrobenthos was collected using a Van Veen grab (sampling an area of about 250 cm2 to a sediment depth of ~10 cm). Seven sediment samples were collected in each station: three for sediment particle size analysis, three for macrobenthos and the seventh for organic matter (OM) content. Samples were preserved in plastic bags and transported to the laboratory.
The grain size distribution of sediment was analysed using a laser Beckman–Coulter LS 230 according to Loizeau et al. (Reference Loizeau, Arbouille, Santoago and Vernet1994). Different sub-samplings were analysed to improve the representativeness of the measurement. A classification was established using the proportion of silt and clay fraction (<50 µm) for finer sediments: sandy sediment contains less than 5% silt and clay, muddy sand 5–25%; sandy mud 25–75% and mud more than 75%. Sandy sediments were classified according to the following grain size: coarse sand when 500–2000 µm fraction was the most important (>50%), medium sand for 200–500 µm and fine sand for 50–200 µm.
Samples for macrobenthos analysis were washed and sieved over a 1 mm mesh in the laboratory. All organisms were stained with rose Bengal and preserved in 5% formaldehyde buffer for subsequent identification. Each organism was identified to species level, when possible, and enumerated using a binocular microscope. Densities were expressed in number of individuals per m2. For determination of organic matter (OM, g. g−1) content in sediment, samples were dried at 60°C for 24 hours and subsequently burned at 450°C for 5 hours.
Temperature (°C), salinity, pH, dissolved oxygen (% saturation) and turbidity (NTU) of water were measured using a Tetracon probe and 250 ml of water were collected for determination of chlorophyll-a (representative of primary production) in the laboratory. Chlorophyll concentrations (mg. m−3) were estimated according to the Lorenzen fluorimetric method (Lorenzen, Reference Lorenzen1967). In the three estuaries, fish and macrocrustacean (potential predators of macrobenthos) densities were estimated in early May 2007. At each station, sampling was performed using a 1.5 m beam trawl, with one tickler chain and 5 mm mesh size in the cod end, towed by a zodiac against the current at 2 knots for 15 minutes, covering an area of about 1000 m2. For fish, only juveniles (30 < total length < 120 mm; representing +95% of the total catches) of bentho-demersal species, for which benthic organisms represent an important food item, were integrated in analyses. Although pelagic species were abundant (namely sprat Sprattus sprattus) in the three estuaries they were not considered in analyses since they do not feed on macrobenthos (Selleslagh, Reference Selleslagh2008). In the same way, small macrocrustaceans, which should be assigned as macrobenthos, were discarded to avoid an overlap between preys and predators. The shore crab Carcinus maenas remains listed in both Tables 2 and 3 because there is a significant difference in size between individuals sampled in macrobenthos assemblage and individuals sampled with potential predators, thus avoiding the overlap.
Data and statistical analyses
The macrobenthic community was characterized using species richness S (total number of species obtained at each sampling station), density (expressed as number of individuals per m2) and Shannon–Wiener diversity index:  , where Pi is the proportion of individuals in the i-th species. Mapping of these biological variables was carried out with the Surfer software package (version 8) in the three studied areas. The non-parametric Kruskal–Wallis test (KW) was used to test for significant differences in species richness, Shannon–Wiener diversity index and density among and within estuaries.
To compare and test the significant difference of macrobenthic assemblages between and within estuaries, similarity percentages (SIMPER) were used. One-way analysis of similarity (ANOSIM) was additionally performed to significantly test inter-estuarine variability. Similarities were computed by a Bray–Curtis similarity matrix using macrobenthic species density (fourth-root transformed). For each estuary, similarities between samples were computed in the same way (only using densities) and graphically represented by cluster, with distances calculated by group-average sorting and comparison made by similarity profile (SIMPROF test). SIMPER was used to determine which species contributed mostly to the Bray–Curtis dissimilarity between macrobenthic groups. All these multivariate analyses were performed using the PRIMER software package (version 6.1.9) (Clarke & Warwick, Reference Clarke and Warwick2001).
Since a single environmental variable may not provide the best explanation of biological patterns, a canonical correspondence analysis (CCA) (Ter Braak, Reference Ter Braak1986), using the CANOCO 4.5 package, was performed to determine the set of variables that could best explain the biological matrices. The assumptions of application of CCA (unimodal trend in species abundance) were preliminary verified using a detrended canonical analysis. Fourth-root transformation was applied on species densities and only species with occurrence >5% were included in analyses in order to reduce the importance of rare species. CCA was performed on each estuary separately to identify the relative importance of the different environmental variables in each estuary. Monte Carlo permutation analyses were used to test the significance of analyses. Only parameters which were estimated as significant by the Monte Carlo permutation tests were graphically represented. A significance level of 5% was considered in all statistical analyses.
RESULTS
Environmental variables
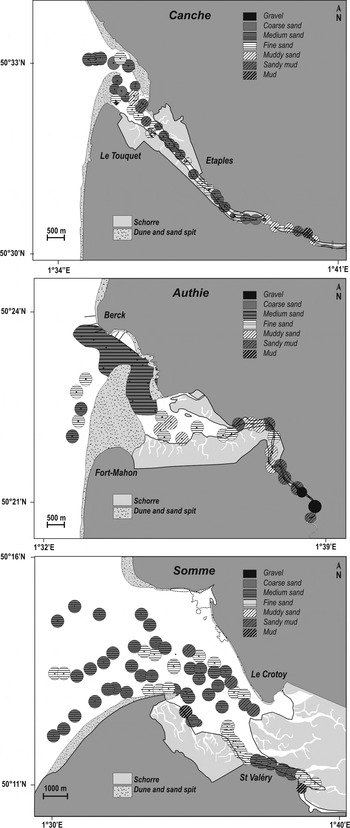
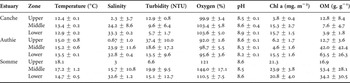
Temperature, salinity, turbidity, oxygen and pH showed similar values in the three estuaries (Table 1). Organic matter was higher in Authie (between 12.7 and 63.5 g. g−1) and Somme (between 16.9 and 53.4 g. g−1) than in Canche (between 3.9 and 12.8 g. g−1) but showed no clear pattern along the estuarine gradients. Chlorophyll-a showed higher values in the lower part of estuaries (15.7 ± 1.5 mg. m−3 and 15.5 ± 1.6 mg. m−3 in Canche and Authie respectively), except in Somme where concentrations were similar (from 20.8 ± 4.0 to 23.9 ± 3.8 mg. m−3) in the three estuarine reaches (Table 1). In the Canche and Authie estuaries, sediment was mainly composed of medium and fine sand and often associated with shell debris (Figure 2). The sediment was generally well sorted and the plot was bi-modal, with a 200 µm mode on the coastline, 320 µm at the mouth, 220 µm upstream, associated with a 1200 µm mode. As in Canche and Authie, grain size in Somme was essentially 50–500 µm, with a similar distribution between medium and fine sand (however medium sand was generally the main class of sediment) and with 220 µm and 1200 µm mode (Figure 2).
Sediment distribution in the Canche, Authie and Somme estuaries, with location of sediment sampling stations (dots).

Mean (± SE) values of parameters recorded in the three haline zones of the Canche, Authie and Somme estuaries. Chl a, chlorophyll-a concentration; OM, organic matter concentration.

Predators
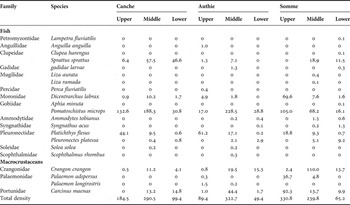
Overall, 21 fish and macrocrustacean species were collected in the three estuaries in early May 2007. Sprat Sprattus sprattus, sea bass Dicentrarchus labrax, common goby Pomatoschistus microps and flounder Platichthys flesus were the most abundant fish species and made up +72% of the total fish catch in each estuary (Table 2). The brown shrimp Crangon crangon and the shore crab Carcinus maenas were by far the two most important macrocrustaceans species collected. Fish and macrocrustacean densities were high during the study period, ranging from 2.6 to 503.9 ind. 1000 m−2 (mean = 184.4 ind. 1000 m−2) in the Canche, from 0.5 to 458.2 ind. 1000 m−2 (mean = 159.7 ind. 1000 m−2) in the Authie and from 25.3 to 793.5 ind. 1000 m−2 (mean = 232.7 ind. 1000 m−2) in the Somme. Fish and macrocrustceans were homogeneously distributed along the estuarine gradient, with a maximum density either in the upper (330.8 ind 1000 m−2 for the Somme) or middle part (290.5 and 322.7 ind. 1000 m−2 for Canche and Authie respectively) (Table 2). However, in the Somme estuary, densities showed important variations between the lower part and upper/middle parts (Table 2).
Densities of fish and macrocrustaceans (ind. 1000 m−2) collected in the three haline zones of the Canche, Authie and Somme estuaries in early May 2007.

Species composition, diversity and density of macrobenthos
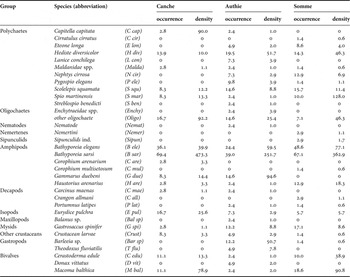
Overall, 34 macrobenthic taxa were identified in the three estuaries (Table 3), including 10 taxa of polychaetes, 6 taxa of amphipods, three taxa of oligochaetes, decapods and bivalves, two taxa of gastropods and one taxa of nematode, nemertean, sipunculid, isopod, maxillopod, mysid and crustacean (Table 3). Regarding their size, all macrobenthic organisms were appropriate preys likely to be predated by the fish and macrocrustaceans considered in this study. 17 macrobenthic taxa were collected in Canche, 28 in Authie and 23 in Somme with 13 taxa common to the three estuaries. The macrobenthic groups were collected in similar proportions in the three estuaries (Table 3). According to the estuary, amphipods and polychaetes represented between 12.9 and 26.3% and between 29 to 33.3% of the total number of species (Table 3). Likewise, they accounted for 53.8 to 68% and for 12.7 to 23.3% of the macrobenthic abundance. From the 34 taxa, only five indicated an occurrence >10% and a density percentage >5% at least in two estuaries and could be considered as key macrobenthic taxa: Hediste diversicolor, other oligochaetes (represented by one unidentified species; called oligochaetes in the rest of the paper), Bathyporeia elegans, Bathyporeia sarsi and Macoma balthica. Bathyporeia sarsi was by far the dominant species encountered in the three estuaries, accounting for 42 to 53.7% of the density and for 39 to 69.4% of the occurrence (Table 3). Some taxa were reported as important species in only one estuary. For example, Capitella capitata and Eurydice pulchra showed high density only in the Canche; Barleeia sp., Gammarus duebeni and Theodoxus fluviatilis in the Authie and Cerastoderma edule and Spio martinensis in the Somme (Table 3).
Occurrence (%) and density (ind. m−2) of macrobenthic taxa collected in the Canche, Authie and Somme estuaries in late April 2007.

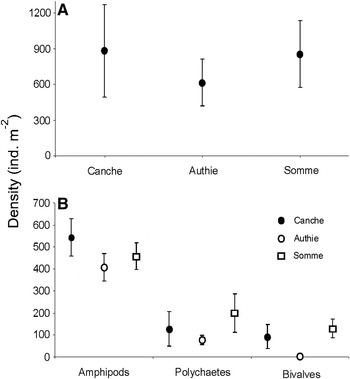
Density of macrobenthos showed no significant difference (KW, P > 0.05) between estuaries (Figure 3A). The Authie estuary was characterized by the lowest density of macrobenthos (595.4 ± 197.2 ind. m−2) while the Canche and the Somme indicated the highest values: 876.2 ± 389.1 and 854.3 ± 281.2 ind. m−2, respectively. Amphipods, polychaetes and bivalves were the most abundant macrobenthic groups in the three estuaries (Table 3). Other groups were characterized by low (i.e. oligochaetes and gastropods) or very low (i.e. nematodes and sipunculids) densities. Densities of the three most abundant groups (Figure 3B) showed no significant differences between estuaries (KW, P > 0.05) although bivalves indicated lower abundance in the Authie: 5 ± 2.3 ind. m−2, compared to the Canche and the Somme (92.2 ± 54.6 and 129.7 ± 42.5 ind. m−2 respectively; Figure 3B). The density of amphipods was 543.2 ± 84.3, 406.8 ± 62.9 and 458.9 ± 59.8 ind. m−2 in the Canche, the Authie and the Somme, respectively. The density of polychaetes was 126.6 ± 782, 77.2 ± 22.2 and 199.0 ± 86.7 ind. m−2 in the Canche, Authie and Somme, respectively (Figure 3B). No significant difference of species richness, diversity and total density was observed between the estuaries (KW; P = 0.54, 0.32 and 0.91, respectively).
Density (mean ± SE; ind. m−2) of macrobenthos (A) and dominant groups (B) in the three estuaries studied.

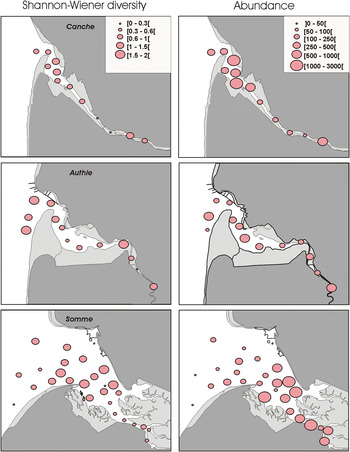
Regarding intra-estuary variability, the total number of taxa varied from 1 to 10 in Canche, from 2 to 12 in Authie and from 1 to 12 in the Somme estuary. Diversity varied, in Canche between 0 and 1.40, from 0.2 to 1.51 in Authie and 0 to 1.89 in Somme (Figure 4). In terms of macrobenthos density, intra-estuarine differences were higher than the differences between the estuaries. In Canche, density varied from 94 to 1882 ind. m−2 (mean = 882.1 ± 1348 ind. m−2), in Authie between 71 and 970 (mean = 640 ± 711 ind. m−2) and in Somme from 27 to 2552 (mean = 854.3 ± 1434 ind. m−2) (Figure 4). Intra-estuary variations in diversity were observed only in Authie where higher diversity was observed in the lower part of the estuary (KW, K 2, 41 = 10.77, P = 0.05) (Figure 4). Likewise, density variations were found only within the Somme estuary, with significant higher values (KW, H 2, 70 = 14.68, P = 0.001) in upper and middle reaches (Figure 4).
Spatial variations of Shannon–Wiener diversity index and density (ind. m−2) of macrobenthos in the Canche, Authie and Somme estuaries in April 2007.

Macrobenthic assemblages
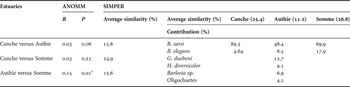
Based on either taxa presence/absence or taxa abundance, SIMPER analysis showed high dissimilarity of the estuarine macrobenthic assemblages between and within estuaries (Table 4). The Canche and Somme had the highest inter-estuary similarity (24.9%; Table 4). ANOSIM (global R = 0.08, P < 0.05) resulted in significant difference between macrobenthic assemblages but only significant difference was observed between Authie and Somme (R = 0.15, P = 0.01; Table 4). Having said that, although the test was significant, global R as well as pairwise R values were low (Table 4), indicating that differences between estuaries were not evident. SIMPER analysis enabled the characteristic taxa (contribution ≥ 90%) to be defined. While Bathyporeia sarsi and B. elegans, with different contributions, discriminated the macrobenthic assemblage of Canche and Somme estuaries, Gammarus duebeni, Hediste diversicolor, Barleeia sp. and oligochaetes were also identified as characteristic taxa of the Authie (Table 4).
Comparison of macrobenthic assemblages between estuaries by one-way analysis of similarity (ANOSIM) (P, significance level) and similarity percentage (SIMPER).

*, Significant differences.
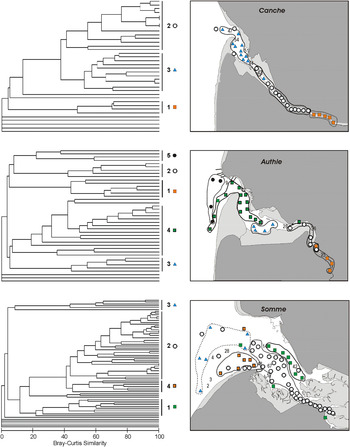
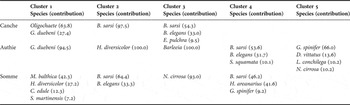
Macrobenthic assemblages were also examined separately for each estuary in order to describe intra-estuarine variability of macrobenthos. In Canche, three main groups were identified (groups 1, 2 and 3) by SIMPROF analysis. Group 1 comprised the five upper stations of the estuary (Figure 5). According to SIMPER analysis, they shared a dominance of oligochaetes and Gammarus duebeni (Table 5). The second group clustered 13 stations, located in the middle zone and three outer stations (Figure 5), and indicated Bathyporeia sarsi as the characteristic species. The third group, dominated by B. sarsi, Bathyporeia elegans and Eurydice pulchra (Table 5), comprised 11 stations covering the outer zone. In Authie, where the intra-estuary similarity was the lowest with a value of 11.2% (Table 4), five groups were identified. Group 1 comprised inner stations (except one; Figure 5) and was characterized by G. duebeni (Table 5). Group 2 clustered five stations located in the upper part of the middle zone. Hediste diversicolor discriminated these stations. The third group consisting of four stations of the middle zone was dominated by Barleeia sp. Group 4, the largest (16 stations), clustered stations located in middle and upper parts of the estuary. Bathyporeia sarsi, B. elegans and Scolelepis squamata were identified as dominant species of this last group (Table 5). The fifth group which was discriminated by G. spinifer, Donax vittatus, Lanice conchilega and Nephtys cirrosa comprised four outer stations (Figure 5). In Somme, SIMPROF analysis defined four groups. Group 1 clustered seven stations located along Le Crotoy beach (Figure 5). They shared a dominance of Macoma balthica, H. diversicolor, Cerastoderma edule and Spio martinensis (Table 5). The second group comprised most stations, mainly distributed from St Valéry harbour to the central zone, with B. sarsi and B. elegans as discriminating species. Group 3, represented by outer stations was dominated by the polychaete Nephtys cirrosa. The fourth group (Figure 5) was discriminated by B. sarsi, Haustorius arenarius and Gastrosaccus spinifer (Table 6).
Cluster analyses, according to Bray–Curtis similarity, and corresponding maps of macrobenthic assemblages in the Canche, Authie and Somme estuaries. See Table 5 for discriminating taxa of each group.

Discriminating taxa (% contribution) of each macrobenthic group for the Canche, Authie and Somme, using similarity percentage analysis.

Relationship with environmental variables
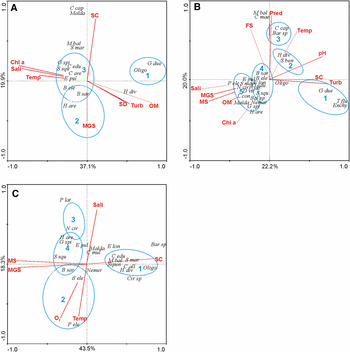
The CCAs (based on taxa density) indicated that variables (physico-chemical parameters and predator densities) explain significantly 62.2, 51.6 and 35.1% of the macrobenthos spatial variations in the Canche, Authie and Somme estuaries respectively. Only axes 1 and 2 were plotted as they accounted for 57.0, 42.2 and 61.8% of the constrained variability for the Canche, Authie and Somme analyses respectively. Results revealed that the influence of biotic and abiotic variables on macrobenthic species differs between estuaries (Figure 6).
Canonical correspondence analysis ordination diagram based on taxa densities, with biotic and abiotic variables represented by vectors, for Canche (A), Authie (B) and Somme (C). See Table 3 for species abbreviations. SC, silt and clay (= muddy sand, sand mud and mud); FS, fine sand; MS, medium sand; CS, coarse sand; SD, shell debris; MGS, mean grain size; OM, organic matter; Pred, predators; Chl a, chlorophyll-a. Circles represent macrobenthic groups identified by clusters. Only the environmental variables which indicated a significant effect are represented.

Figure 6 indicated that in the Canche estuary OM, chlorophyll-a and salinity (best correlated with axis 1, r = 0.79, –0.77 and –0.74 respectively) and silt and clay (SC) fraction (best correlated with axis 2, r = 0.60) were the most important environmental variables influencing the macrobenthos spatial variations. Group 1 was related to low salinity, shell debris SD, turbidity and organic matter (Figure 6). The second group was related to intermediate salinity values and mean grain size (MGS) while the third group was related to high salinity (Figure 6).
In the Authie, CCA (Figure 6) showed that salinity and medium sand (MS) (best correlated with axis 1, r = –0.79 and –0.70 respectively) and predator, temperature and fine sand (FS) (best correlated with axis 2, r = 0.80, 0.58 and 0.57 respectively) were the most environmental factors influencing the macrobenthos variations. Group 1 was related to low salinity, SC and turbidity and group 2 to the two first and temperature (Figure 6). Group 3 was connected with intermediate salinity values and FS and predators whereas groups 4 and 5 were related to high salinity and sediments size.
MS, MGS and SC (best correlated with axis 1, r = –0.79, –0.79 and 0.70 respectively) and oxygen, temperature and salinity (best correlated with axis 2, r = –0.50, –0.48 and –0.47 respectively) mainly influenced the macrobenthos variations in the Somme estuary, as shown by Figure 6. The first group was related to SC, the second to temperature and O2 whereas groups 3 and 4 were related to high salinities and coarser sediments (Figure 6).
DISCUSSION
Macrobenthic assemblage composition
While the Somme estuary has been already investigated, the macrobenthos composition and assemblage of the Canche and Authie estuaries was analysed for the first time. The macrobenthic species richness of the three EEC estuaries was in the range of what has been reported in other European estuaries of same size (17 species in the Forth, Scotland, McLusky et al., Reference McLusky, Hull and Elliott1993; 22 species in the Somme, France, Desprez et al., Reference Desprez, Ducrotoy and Sylvand1986) but lower than in larger estuaries (e.g. 115 species in the Seine, France, Desroy et al., Reference Desroy, Janson, Denis, Charrier, Lesourd and Dauvin2007; 68 species in the Tagus, Portugal, Rodrigues et al., Reference Rodrigues, Meireles, Pereira, Gama and Quintino2006). Since species richness is related to estuarine system size (Selleslagh et al., Reference Selleslagh, Amara, Laffargue, Lesourd, Lepage and Girardin2009), it is not surprising that the three EEC estuaries had smaller species richness than large estuaries as their characteristics lead to low habitat availability. In temperate coastal waters, macrobenthic assemblages were typically dominated by polychaetes both in terms of diversity and density (Reise, Reference Reise, Elliott and Ducrotoy1991; Rodrigues et al., Reference Rodrigues, Meireles, Pereira, Gama and Quintino2006; Desroy et al., Reference Desroy, Janson, Denis, Charrier, Lesourd and Dauvin2007). In this study, polychaetes were the most diverse (±38%) and the second most abundant group (±17%) whereas amphipods (mainly represented by Bathyporeia sarsi) were, by far, the most abundant group (mean = 61.7%). Reise (Reference Reise, Elliott and Ducrotoy1991) pointed out that the use of a <1 mm mesh size could increase the polychaete fraction, which could explain their lower density in our case. Nevertheless, high proportion of amphipods seems to be a characteristic of the three studied EEC estuaries compared to other European estuaries (e.g. the Forth in Scotland, McLusky et al., Reference McLusky, Hull and Elliott1993; the Tagus in Portugal, França et al., Reference França, Vinagre, Pardal and Cabral2009). The polychaete Capitella capitata, which has been described to reflect the organically polluted areas (Pearson & Rosenberg, Reference Pearson and Rosenberg1978), was characterized by high densities only in the Canche estuary. This result was surprising since the Canche estuary, like the Authie and Somme estuaries, is a low polluted system (Amara et al., Reference Amara, Selleslagh, Billon and Minier2009; Delpech et al., Reference Delpech, Courrat, Pasquaud, Lobry, Le Pape, Nicolas, Boët, Girardin and Lepage2010). The presence of C. capitata in this estuary was probably due to other factors which were not considered here. When compared with other European estuaries, the densities of macrobenthos in our estuaries were lower. Density, as well as species richness of macrobenthos, have been recognized to be heavily dependent on both the sampling methods used (McLusky et al., Reference McLusky, Hull and Elliott1993; James et al., Reference James, Lincoln Smith and Fairweather1995) as well as sampling effort (Cabral & Murta, Reference Cabral and Murta2004); thus it was not surprising that densities found here were lower. For example, in six Portuguese estuaries (where densities ranged from 852 to 8650 ind. m−2; Wouters & Cabral, Reference Wouters and Cabral2009), organisms were collected before the main recruitment period of predators (Wouters & Cabral, Reference Wouters and Cabral2009) and sieved over a 0.5 mm mesh while in the present study macrobenthos was sampled during the settlement period of predators (Selleslagh & Amara, Reference Selleslagh and Amara2008) and sieved over a 1 mm mesh. As shown by James et al. (Reference James, Lincoln Smith and Fairweather1995), it was possible that an underestimation of density of macrobenthos occurred using a 1 mm mesh.
Spatial variations in relation to environmental variables
In most typical estuarine systems, macrobenthic richness, density and assemblages fluctuate along the estuarine gradient (e.g. McLusky et al., Reference McLusky, Hull and Elliott1993; Cortelezzi et al., Reference Cortelezzi, Capitulo, Boccardi and Arocena2007; França et al., Reference França, Vinagre, Pardal and Cabral2009). The stability of salinity and the constancy of the abiotic factors in the lower part of estuary were often responsible for larger diversity and density, because this area can be easily colonized by species originating from adjacent marine areas (Sousa et al., Reference Sousa, Dias and Antunes2006). In the present study, richness and density showed no significant differences between estuaries, except in the Authie for diversity. This fact probably resulted from the macrotidal regime of EEC estuaries which induces total emptying of the estuary at each tide, causing strong fluctuations of salinity even in the lower estuarine part. Nevertheless, a continuum of macrobenthic assemblages, reflected by significant differences of macrobenhic assemblages within estuaries, was observed along the three estuaries. This finding is in agreement with the findings of several other authors (e.g. Rodrigues et al., Reference Rodrigues, Meireles, Pereira, Gama and Quintino2006; Sousa et al., Reference Sousa, Dias, Freitas and Antunes2008) and probably results to the tolerance and the preference of species towards environmental conditions.
As in many other estuaries, salinity and sediment characteristics were the two most important parameters influencing spatial variations of macrobenthos in our estuaries. Salinity and sediment have been recognized as affecting, together or individually, the distribution of estuarine macrobenthos (i.e. Ysebaert et al., Reference Ysebaert, Meire, Coosen and Essink1998; Ysebaert & Herman, Reference Ysebaert and Herman2002; Sousa et al., Reference Sousa, Dias, Freitas and Antunes2008). On the other hand, the close connection between these two physical factors made it difficult to distinguish their effect (McLusky & Elliott, Reference McLusky and Elliott2004). Sediment provides both the substratum to live and food in the form of organic matter to the bottom-dwelling fauna (Gray, Reference Gray1974) whereas the salinity gradient acts as a physiological barrier for stenohaline marine and freshwater species and places environmental stress on euryhaline organisms. The penetration of a marine organism up the estuary is dependent on its tolerance to reduced salinities. Although salinity differed between reaches, the salinity gradient was less pronounced in the Somme due to the combination of high seawater penetration, linked to large estuary gap, and very low freshwater inputs, linked to upstream dam. This probably explained why the salinity gradient was not dominant in affecting macrobenthos distribution in the Somme. Results showed that salinity, although being an important factor, was related to the second CCA axis, not to the first, as in the Canche and Authie estuaries. In the present study, sediment differed between estuaries with coarser and finer grain size in Somme and Authie respectively. Dissimilarity in macrobenthic assemblages between estuaries, even if not evident according to ANOSIM, could be explained in part by these differences of salinity and sediment. Another parameter which was not considered here, the depth, certainly explained the observed difference of macrobenthos density in the Somme where depth is ± 8–9 m in the low reach, while maximum depth is 4 m in other reaches. However, several authors reported no significant relation between depth and density of estuarine macrobenthos (e.g. Sousa et al., Reference Sousa, Dias and Antunes2006; Cortelezzi et al., Reference Cortelezzi, Capitulo, Boccardi and Arocena2007; Currie et al., Reference Currie, Cameron, Roberts, Hooper, Sorokin and Ward2011). The effect of depth was certainly indirect and related to sampling efficiency in our case: a bad position of the grab on the ground, inducing an underestimation of densities, due to skewness during the down probably occurred. Such difference in macrobenthos density was not observed within the Canche and Authie probably because the depth is low and relatively constant along these two estuaries (2–4 m). In the future, other samplings would be performed to verify this aspect.
Food supply, estimated by organic matter and chlorophyll-a, showed no major influence on macrobenthos distribution in the three estuaries. Similar observations have been made by Dauvin & Ruellet (Reference Dauvin and Ruellet2008) indicating that organic matter and pigment content did not explain the repartition of benthic biomass in the Bay of Seine. In the same manner, predators (fish and macrocrustaceans) showed no major effect on spatial variations of macrobenthos, except in the Authie where a prey–predator interaction may be hypothesized rather than a direct negative influence of predators on macrobenthic species densities. Our results were in agreement with some authors reporting that predatory pressure did not impact prey communities and that food availability was never a limiting factor for juvenile fish populations living in estuaries or marine areas (Amara, Reference Amara2003; Amara & Paul, Reference Amara and Paul2003; Salgado et al., Reference Salgado, Cabral and Costa2007). On the other hand, other authors suggested that the impact was not only high but that predation by fish was the main biotic regulator of prey species and affected the structure and dynamic of benthic invertebrate communities (Rosa et al., Reference Rosa, Granadeiro, Vinagre, França, Cabral and Palmeirim2008). This latter situation could have major ecological consequences for predators. In the case of food shortage, predators may be forced to find alternative food items (Beukema et al., Reference Beukema, Essink, Michaelis and Zwarts1993), causing competition among the species that depend on these prey items (Hamer et al., Reference Hamer, Heske, Brawn and Brown2006).
Foraging ground value of EEC estuaries
Estuaries have long been recognized as areas of high importance for marine organisms since they play a crucial role for many invertebrate and fish species during their life history. The function of shallow coastal habitats as important nursery grounds for marine fish has become an accepted ecological concept. The use of estuaries by juvenile fish usually presents several advantages such as high prey availability, refuge from predators and good conditions for a rapid growth (Beck et al., Reference Beck, Heck, Able, Childers, Egglestone, Gillanders, Halpern, Hays, Hoshino, Minello, Orth, Sheridan and Weinstein2001). However, while in this nursery context a high density of food is generally assumed, this consensus has been challenged before (Van der Veer & Witte, Reference Van der Veer and Witte1993). In some flatfish nursery grounds, density-dependent growth effects due to food limitation in the nursery areas were suggested (Karakiri et al., Reference Karakiri, Berghahn and Van der Veer1991) while Modin & Phil (Reference Modin and Phil1994) concluded that competitive effects generating density dependence in juvenile fish are likely to be unimportant until extremely high densities are attained. The Canche, Authie and Somme estuaries, which provide high-quality habitats for juvenile fish (Amara et al., Reference Amara, Selleslagh, Billon and Minier2009), are highly used by fish and macrocrustaceans, mainly during their juvenile stage (Selleslagh & Amara, Reference Selleslagh and Amara2008; Selleslagh et al., Reference Selleslagh, Amara, Laffargue, Lesourd, Lepage and Girardin2009). In these estuaries, fish and macrocrustacean densities are high and several species have high commercial value (sprat, sea bass, plaice, sole, brill and brown shrimp), underlying the importance of these small EEC estuaries for fisheries. Recently, the Canche, Authie and Somme have been identified as nursery areas (Selleslagh et al., Reference Selleslagh, Amara, Laffargue, Lesourd, Lepage and Girardin2009), providing suitable growth conditions for the young-of-the-year and juvenile fish, as well as refuge from predators (Amara & Paul, Reference Amara and Paul2003; Selleslagh, Reference Selleslagh2008).
In the present study, the macrobenthos of the three investigated estuaries was characterized by higher densities (mean density = 790.2 ind. m−2) than in non-nursery areas such as the adjacent marine coastal areas of the EEC and southern North Sea coasts (mean density = 229.6 ind. m−2) (Desroy et al., Reference Desroy, Warembourg, Dewarumez and Dauvin2002). However, the diversity was higher in the shallow marine coastal areas (167 taxa) compared to 34 taxa in our study. Caution must be taken however on these considerations since the work by Desroy et al. (Reference Desroy, Warembourg, Dewarumez and Dauvin2002) was performed using a mesh size of 2 mm, which can clearly estimate lower densities than using a mesh size of 1 mm, such as the present study. Differences of density between habitats could explain, in part, why the three studied estuaries are important nursery grounds for both marine fish and macrocrustacean species (Selleslagh & Amara, Reference Selleslagh and Amara2008; Selleslagh et al., Reference Selleslagh, Amara, Laffargue, Lesourd, Lepage and Girardin2009) in comparison to the adjacent subtidal waters where juvenile fish densities are lower (<165 ind. 1000 m−2) (Amara, Reference Amara2003). These findings are in accordance with Wouters & Cabral (Reference Wouters and Cabral2009) and Marchand (Reference Marchand1988) who found a higher concentration of fish in areas where preys were more abundant. These considerations indicate that the densities of macrobenthos in the three studied EEC estuaries are high, even if values are smaller than those in other European estuaries. It is agreed by several authors that all coastal areas are not equally important as nursery and foraging grounds (Le Pape et al., Reference Le Pape, Chauvet, Mahévas, Lazure, Guérault and Désaunay2003; Amara et al., Reference Amara, Meziane, Gilliers, Hermel and Laffargue2007). The present results suggest that the Canche, Authie and Somme estuaries have a similar relative importance as foraging grounds for fish and macrocrustaceans since globally no significant differences of species richness, density, dominant groups of macrobenthos, as well as macrobenthic assemblages, have been found between the three. The fact that these areas have been considered as clean systems (Amara et al., Reference Amara, Meziane, Gilliers, Hermel and Laffargue2007) since they are all subjected to low chemical contaminations (heavy metals and organic pollutants PCB and PAH) (Delpech et al., Reference Delpech, Courrat, Pasquaud, Lobry, Le Pape, Nicolas, Boët, Girardin and Lepage2010) probably also contributed to their high and similar nursery value.
In conclusion, the present considerations indicated that the macrobenthos structure of the Canche, Authie and Somme estuaries is globally the same during spring, although a few dissimilarities occurred regarding the assemblages. Results supposed that these estuarine nursery grounds support, with a similar importance, an abundant macrobenthic community, which is a key component in the food web of estuarine ecosystems contributing to estuarine quality (Gibson, Reference Gibson1994). The relative high availability of macrobenthos, in spite of the strong presence of predators, indicated that macrobenthos is an important resource and suggested that it is not a limiting resource for fish and/or other higher trophic groups during spring. Nevertheless, since fish and macrocrustaceans (e.g. Martinho et al., Reference Martinho, Leitão, Neto, Cabral, Marques and Pardal2007; Selleslagh & Amara, Reference Selleslagh and Amara2008) as well as macrobenthos (e.g. França et al., Reference França, Vinagre, Pardal and Cabral2009) show seasonal distribution and abundance variations in estuaries, it would therefore be advisable to have additional information on the temporal variability of macrobenthos present in these estuaries to assure that it is not limited all over the year. The high densities and proportions of amphipods (Bathyporeia sarsi) and polychaetes suggest that they play a key role and probably serve as important prey items to the higher trophic levels. In the future, it should be interesting to study the feeding ecology of dominant fish species and more globally the food web (using, for example, the trophic model) to conclude about the prey selectivity by fish and the role played by dominant macrobenthic taxa in the food web of the Canche, Authie and Somme estuaries.
ACKNOWLEDGEMENTS
The authors would like to thank Vincent Cornille and the students for their assistance with the field sampling and the laboratory sorting and Dr Jean-Marie Dewarumez for macrobenthos identification. This work was part of the CPER ‘Estuaire’ project with the support of Fond Européen FEDER and Conseil Régional Nord Pas de Calais.