INTRODUCTION
In recent decades, the inclusion of local communities in wildlife management has been viewed as indispensable for successful conservation (Gibson & Marks Reference Gibson and Marks1995) because revenues generated by wildlife can create positive incentives for its conservation (Child Reference Child, Prins, Grootenhuis and Dolan2000). Conversely, conflict between wildlife and people can prevent or erode local support for conservation (Gadd Reference Gadd2005). Wildlife-based benefits are intended to offset the costs and encourage tolerance (Gadd Reference Gadd2005), and wildlife-based employment and development projects aspire to provide local community members (a ‘community’ as used here is defined as a group of interacting people living in a common location under the same laws and regulations) with a sense of ownership over wildlife (Gibson & Marks Reference Gibson and Marks1995). Frequently however, the link between benefits and wildlife is not understood, making attempts to encourage conservation ineffectual (Child Reference Child, Prins, Grootenhuis and Dolan2000; Archabald & Naughton-Treves Reference Archabald and Naughton-Treves2001; Gadd Reference Gadd2005).
There is no doubt that tourism can bring benefits to wildlife-rich areas (Western & Wright Reference Western, Wright, Western and Wright1994). However, this does not automatically ensure the support of local people for conservation, as wildlife-related costs usually remain significantly higher than the benefits (Parry & Campbell Reference Parry and Campbell1992; Adams & Infield Reference Adams and Infield2003) and benefits are often only available to an elite minority (Thompson & Homewood Reference Thompson and Homewood2002). This problem is frequently emphasized in economic-based studies of Maasailand and throughout Africa (Gillingham & Lee Reference Gillingham and Lee1999; Archabald & Naughton-Treves Reference Archabald and Naughton-Treves2001; Ogutu Reference Ogutu2002), and is a major stumbling block to increasing wildlife benefits to promote tolerance. In addition, the vast majority of revenues still go to operators and owners of the safari industry, rather than the communities (Gibson & Marks Reference Gibson and Marks1995; Norton-Griffiths et al. Reference Norton-Griffiths, Said, Seernals, Kaelo, Coughenour, Lamprey, Thompson, Reid, Sinclair, Packer, Mduma and Fryxell2008).
Whilst there is now general acceptance that rural communities need to participate in, benefit from and support the sustainable management of their wildlife resource (Gillingham & Lee Reference Gillingham and Lee1999), how such integrated approaches might best achieve the desired results is still being debated (Barrett & Arcese Reference Barrett and Arcese1995). Some conservationists report no positive correlation between revenue sharing and positive attitudes towards wildlife (Parry & Campbell Reference Parry and Campbell1992; Gibson & Marks Reference Gibson and Marks1995; Hackel Reference Hackel1999), whereas others have found that even modest revenue sharing can improve attitudes and tolerance (Lewis et al. Reference Lewis, Kaweche and Mwenya1990; Archabald & Naughton-Treves Reference Archabald and Naughton-Treves2001). These complexities show that surveys of rural people's attitudes are an important part of the design, implementation and evaluation stages of community-based conservation schemes (Hartup Reference Hartup1994; Gillingham & Lee Reference Gillingham and Lee1999).
A number of factors may affect a household's perception of the costs and benefits from wildlife, including direct economic benefits, the major economic activity undertaken by the household, local land tenure, the wealth of the household and various cultural factors (Arjunan et al. Reference Arjunan, Holmes, Puyravaud and Davidar2006). We investigated how these factors affected attitudes to wildlife and conservation in two neighbouring Maasai group ranches where the pastoralists and their livestock live alongside a diverse and relatively abundant wildlife population. Specific hypotheses addressed include: (1) was the amount of money received by households significant in affecting attitudes to wildlife? (2) Was the distribution of wildlife revenues important in affecting attitudes? These hypotheses were tested using information gathered from a questionnaire survey of 180 households, analysed using non-parametric statistics and ordinal logistic regression models.
METHODS
Study area
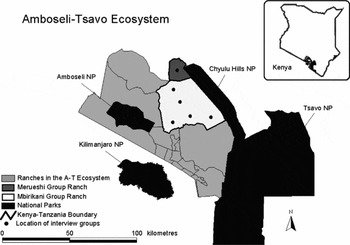
The two study ranches, Mbirikani and Merueshi, are located in the Amboseli-Tsavo Ecosystem in southern Kenya (Fig. 1). Both are ‘group ranches’, defined as a livestock production system where a group of people jointly hold freehold title to the land, maintain agreed stocking levels and communally herd their individually-owned livestock (Ministry of Agriculture 1968). The ecosystem supports an abundance and diversity of wildlife and is one of the few places in East Africa where significant numbers of large mammals roam freely outside protected areas. Both ranches are in agroclimatic zones V and VI (Sombroek et al. Reference Sombroek, Braun and Van Der Pouw1982), namely arid to semi-arid. This is one of Kenya's driest areas, with erratic rainfall averaging 350–500 mm yr−1 along a west-east gradient (Worden et al. Reference Worden, Reid and Gichohi2003); the short rains fall in November and December, the long rains from March to May (Ntiati Reference Ntiati2002). Droughts are frequent and have been recorded at least once a decade since 1930 (Campbell Reference Campbell1999). Temperatures range from 8 °C in July to 35 °C in February (Altmann et al. Reference Altmann, Alberts, Altmann and Roy2002).
Location of Mbirikani and Merueshi Group Ranches within the Amboseli-Tsavo Ecosystem. Inset shows the location of the study area within Kenya.

Mbirikani
The c. 130 000 ha Mbirikani Group Ranch lies between 2° 22′S and 2° 44′S, and 37°24′E and 37°52E. It is bordered on the eastern edge by the Chyulu Hills National Park, which connects it to Tsavo West National Park, and Amboseli National Park is close to the western boundary. Mbirikani is communally owned (i.e. the land is not sub-divided) by 4650 members of Ilkisongo Maasai (Ntiati Reference Ntiati2002): in 2006 just over 10 000 people lived on the ranch, with 60 000–90 000 head of livestock (Groom Reference Groom2007). The vegetation ranges from upland grasslands to flat savannah grasslands to dense bush. Permanent water is scarce and restricted to a few swamps, the Kikarangot River along the southern boundary of the ranch and a water pipeline running south to north in the western quarter of the ranch.
Parts of Mbirikani provide an important wet season dispersal area for vast numbers of herbivores from Amboseli and Tsavo West National Parks and surrounding ranches (Western Reference Western1973). A small luxury safari lodge (Ol Donyo Wuas) has been operating since 1986, and an active conservation trust (Ol Donyo Wuas Trust) since 1991. Mbirikani members can therefore work at the safari lodge or be employed by the Trust as game scouts, radio operators and forestry staff. The lodge pays conservation fees and land rents to the group ranch committee and the Trust provides education bursaries for secondary school and college students, provides schools with resources and pays teachers' salaries. There is also a Predator Compensation Fund (PCF) and a Kenya Wildlife Service revenue-sharing programme from Amboseli National Park.
The PCF was initiated in April 2003 and compensates ranch members for livestock killed by predators at a rate close to average market value, unless penalized for poor livestock husbandry. Through a system of predator scouts, verification officers and the PCF team, any ranch member can report, and be compensated for, any livestock killed on the Ranch by a predator within the previous 24 hours (S.D. Maclennan, personal communication 2008). Only Mbirikani Group Ranch members are entitled to this. The revenue-sharing programme from Amboseli reflects the use of the Ranch as a wet season dispersal area for the Park's wildlife. Each year, Mbirikani Group Ranch committee receives 850 000 Kenya shillings (US$ 12 143) from Amboseli gate fees.
Merueshi
The smaller (18 300 ha) Merueshi Group Ranch borders Mbirikani to the north and lies between 2°15′S and 2°23′S and 37°30′E and 37°40′E. Merueshi is part of the South Kaputei Group Ranches (Bekure et al. Reference Bekure, de Leeuw, Grandin and Neate1991), inhabited by Kaputei Maasai. Unlike Mbirikani, which remains communal, in the early 1980s Merueshi was formally subdivided into individual family plots ranging between 70 and 460 ha. In 2006, Merueshi had 117 registered members, 2000 people and some 11 000 livestock (Groom Reference Groom2007).
There is no natural permanent water on Merueshi, although the water pipeline runs close to its western boundary, and there is one functioning borehole. One seasonal river, the Kiboko, runs through Merueshi and during dry months people dig temporary wells in the riverbed to access water. The Ranch has no tourist facilities or conservation trust, receives no revenue from the Kenya Wildlife Service and there is no employment in the wildlife sector.
Data collection and analysis
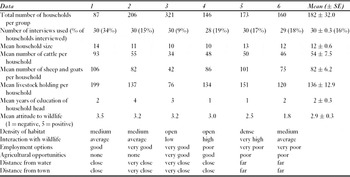
Staff and company records provided information on wildlife revenues generated on Mbirikani Group Ranch. All other data were collected using a semi-structured questionnaire survey of 180 male household heads on Mbirikani (n = 150) and Merueshi (n = 30) Group Ranches. A household was defined as a married man, all his wives and unmarried children, and anyone else dependent on him for food and shelter, which is the basic unit of production and decision-making in Maasai society (Bekure et al. Reference Bekure, de Leeuw, Grandin and Neate1991). Stratified random sampling was used (Robson Reference Robson2002); the population was divided into a number of regions, the stratification being based on pre-determined attitudes to, and level of interaction with, wildlife, such that the sample population represented a continuum of severity of wildlife conflict (Sutton et al. Reference Sutton, Larson and Jarvis2004). Mbirikani was treated as five regions, while Merueshi was treated as a single unit because of its size and because all the members had similar attitudes towards, and experiences with, wildlife. Each region was scored as very poor, poor, average, good or very good for employment or agricultural opportunities based on local expert knowledge and their distance to towns and rivers, respectively. The mean distances of each group from water and towns were calculated using the nearest-features extension in ArcView GIS (v3.2), and scored as far (>10 km), close (<5 km) or very close (<1 km) (see Table 1).
Background information for the six survey regions. Groups 1–5 are from Mbirikani, group 6 is from Merueshi.

Thirty questionnaires were completed for each region. Respondents were chosen randomly from a complete list of all household heads in each region using a random number generator in Excel and all the household heads approached agreed to be interviewed. The questionnaire took one to two hours to complete. It included ten sections comprising information on respondents' backgrounds, livestock holdings, agricultural activities, business, wildlife revenues and costs, problems with wildlife, land ownership, household income, attitudes to wildlife and attitudes to land subdivision. Two trained Maasai enumerators helped complete the questionnaires, which were comprehensively pre-tested (n = 12). The questionnaire required both quantitative and qualitative responses; all open-ended responses were coded at the time into a series of pre-chosen answers based on the pre-test interviews and an ‘other’ category was always present. Monetary values in Kenyan shillings were converted to US$ at the February 2007 exchange rate of US$ 1 = Ksh 70.
Visual outliers were identified during initial examination of the data. Each of these respondents was revisited to check the information given, a form of ‘ground-truthing’ (White et al. Reference White, Vaughan Jennings, Renwick and Barker2005). Three questionnaires were ultimately discarded because it was clear the respondent was deliberately misleading the interviewer.
Immediately after the interview, the interviewer scored each household head according to the interviewees overall attitudes to wildlife. These attitude scores, from one (very negative) to five (very positive), were based on a combination of the respondents reported like or dislike of herbivores and carnivores, their reported desire to kill or conserve various species of wildlife and their reported willingness to engage in pro-conservation activities. This approach represents the best use of all available information in making the judgement of attitudes. A great deal of qualitative information was gathered during the questionnaires, outside the official remit of the questions, which provided valuable insights into the respondent's attitude to wildlife. Using a more rigorous scientific approach based only on the ranks of responses to the structured questions would be under-using the value of the extra information obtained when doing a face-to-face interview. Although this is a subjective method, it was never difficult or ambiguous to assign attitude scores to respondents and we are confident there is no bias in the approach.
Since the questionnaire was targeted at male household heads, the attitudes and opinions may not be representative of younger men who were not yet head of the household, women or children. Furthermore, the focus group for the study were Maasai pastoralists and small-scale agro-pastoralists, and so the attitudes are not representative of agriculturalists or those living and working exclusively outside the pastoral sector. Thus the results presented here are likely to represent the more positive end of the scale, because pastoralists tend to be more positive towards, and tolerant of, wildlife than agriculturalists (Gadd Reference Gadd2005).
Statistical methods
Data on the distribution of wildlife revenues were analysed using SPSS v12.0 and Minitab v.13. Kruskal-Wallis tests were used to investigate differences between regions because the data could not be transformed to meet the assumptions of normality.
Factors affecting attitudes to wildlife were investigated using ordinal logistic regression models. Ordinal logistic regression is a statistical technique that can be used with an ordered categorical dependent variable, in this case attitude scores, with 5 being the highest and 1 the lowest. All independent variables considered to have the potential to influence attitudes were included in the model; the choice of variables was based on extensive literature research, advice from well-educated Maasai and the results of the pre-tests of the interviews. In a few cases (described in the Results section) there were problems with collinearity, or uniform responses, so certain independent variables had to be excluded.
Several different models were tried during preliminary investigation of the data, and the goodness of the models was assessed using the log-likelihood statistic; the smaller the value, the better the model. Ultimately however, the global model is presented (the model including all independent variables) because these were close to the best fit and because information on non-significant variables is just as important as significant variables. Response information, goodness of fit test statistics and measures of association were checked to ensure the final model had a good fit with the data.
RESULTS
Of the six survey regions, region 5 was the most marginal group and had the highest levels of conflict with wildlife, while regions 2 and 3 were closest to major infrastructure and had lower interactions with wildlife (Table 1).
Wildlife revenues
In 2005, Mbirikani Group Ranch generated c. US$ 230 450 total wildlife revenues, i.e. c. US$ 5.3 ha−1 yr−1 for the area of the Ranch used for tourism. Although all lodge conservation fees and rents (US$ 48 368) were paid to a ranch committee for administration and investment in the community, misappropriation of funds and poor governance meant that the vast majority (>90%) of this money never reached the community. There was therefore a discrepancy between the total amount of revenue generated on the ranch (US$ 230 450) and the amount actually received by the households (US$ 177 270).
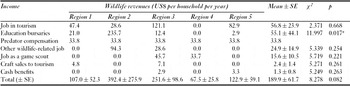
The 933 households on Mbirikani received on average US$ 190 yr−1 from wildlife (Table 2), although regions differed in revenue from education bursaries (χ23 = 11.997, p = 0.017), with region 2 median earnings being considerably more than all other regions. This was heavily influenced however by one respondent, whose son was being sponsored through college by the African Wildlife Foundation (a Nairobi-based, international wildlife conservation non-governmental organization), and education bursaries were on average considerably lower. Nonetheless, even with group 2 removed, differences remained between regions in the magnitude of bursaries received (χ23 = 10.723, p = 0.013), although post hoc testing showed no significant difference between any pairs of regions. On average, region 2 households earned the most from wildlife, followed by region 3; these regions both surround a major town. Region 4 households earned the least from wildlife; this was a marginal area with few connections to the Lodge or Trust.
Annual wildlife revenues reported by household heads in different regions of Mbirikani Group Ranch; χ2 and p results are from Kruskal-Wallis tests investigating differences between regions. The predator compensation data are averages for the whole ranch divided evenly between regions. *p < 0.05.

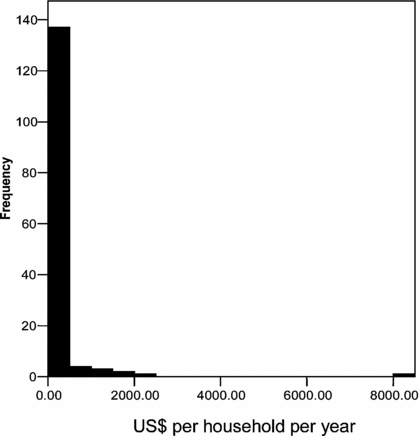
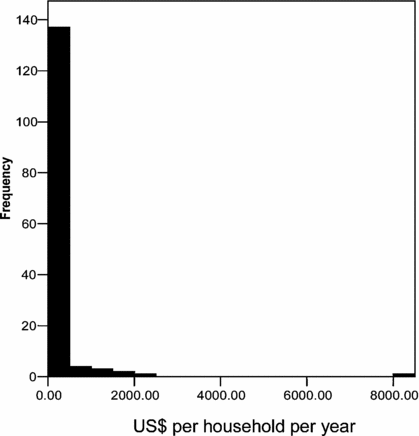
However, the region means (Table 2) mask the huge inequality in earnings per household; median earnings were zero (Fig. 2). Only 24% of Mbirikani households received any benefits from wildlife other than compensation; annual revenues for these households ranged from US$ 48–8276 (mean = US$ 693, median = US$ 148). The remaining 76% of households received no monetary benefit from wildlife other than compensation, which was available to everyone. Education bursaries were the most widely distributed form of additional benefit, with 14% of Mbirikani households receiving some kind of support. Tourist jobs were held by 5% of the community; game scout jobs and cash handouts each supported 2% of the community. Additional indirect benefits for Mbirikani included provision of infrastructure (dams, roads and schools), a clinic and use of wildlife products such as meat, skin, horns and tails. However, aside from the last, these indirect benefits were rarely considered by households to result from wildlife.
Distribution of wildlife revenues per household on Mbirikani Group Ranch (n = 148).
Merueshi Group Ranch received no direct benefits from wildlife; there was no tourist operation, no conservation trust and no revenues from the Kenya Wildlife Service or African Wildlife Foundation, although 17% of respondents used wildlife products in the form of consumption of game meat.
Attitudes to wildlife
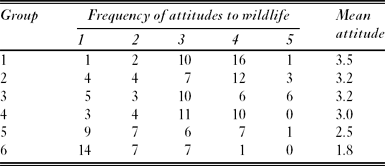
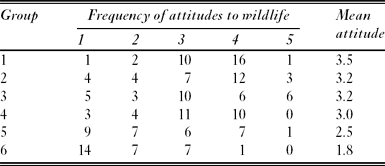
Overall Mbirikani inhabitants attitudes to wildlife were more positive than Merueshi inhabitants (mean scores 3.06 and 1.83, respectively; χ24 = 25.259, p < 0.001; Table 3). Within Mbirikani, there was also a significant difference between regions (χ216 = 30.061, p = 0.018), with region 5 having the most negative attitudes. The majority of respondents on Mbirikani (64%) claimed to like the presence of wild herbivores, compared with only 24% on Merueshi. Forty-five per cent of Mbirikani household heads also professed to like living with carnivores, compared with only one person (3%) on Merueshi.
Frequency of attitudes to wildlife by group (n = 177) on a scale where 1 = negative and 5 = positive.
Wildlife bursaries had the greatest positive influence on peoples' attitudes to herbivores on Mbirikani (26% of all responses), where the perception was that herbivores attract tourists. Job creation was the next most important reason (22%). The spread of disease was the major reason given for disliking herbivores (32%), and resource competition and crop damage were also important (24% and 16%, respectively). For carnivores, the perception that they attract tourists and create jobs had the greatest influence on people's attitudes (32%), followed by the presence of the PCF (31%); education bursaries and conservation projects were also important (18% and 12%, respectively). Unsurprisingly, the main reasons given for disliking carnivores were that they kill and injure livestock (47%), and pose a threat to human life (45%).
For Merueshi households, who received none of the financial benefits that Mbirikani did, the main reason given for liking herbivores was the hope that cropping (sustainable harvesting of certain species) would be reintroduced soon (33%); it was banned in 2003. The presence of wildlife bursaries was also mentioned (20%), as they could see how this had benefited their neighbours. Competition for resources was the major determinant of negative attitudes to herbivores (57%), followed by disease transmission from wildlife (25%). Only one person on Merueshi claimed to like carnivores, saying that they brought in tourists and were attractive to look at. Negative attitudes to carnivores were for the same reasons as Mbirikani; livestock death and injury (47%), and a threat to human life (47%).
However, chi-square analyses indicated that there were regional differences for liking both herbivores and carnivores (χ220 = 59.82, p < 0.001 and χ212 = 22.62, p = 0.031, respectively). Regions with well-educated household heads and those close to major services mentioned the creation of jobs and tourism as major reasons for liking herbivores and carnivores, whilst more remote regions did not. There was also a difference between regions in reasons given for disliking herbivores (χ215 = 77.10, p < 0.001), but not for disliking carnivores (χ215 = 18.61, p = 0.232); Merueshi households reported resource competition as a reason for disliking herbivores significantly more than would be expected by chance.
Factors affecting attitudes towards wildlife
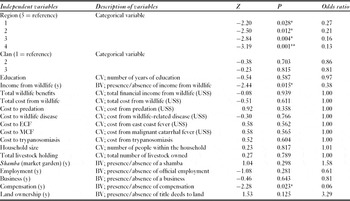
Ordinal logistic regression analyses were used to identify those factors which affected households' overall attitudes to wildlife; the independent variables were from the questionnaire responses, so calculations of costs to wildlife were based on perceived losses (Table 4). The dependent variable was the attitude score allocated to each respondent, from 1 (negative) to 5 (positive). Mbirikani and Merueshi were analysed separately.
Variables included in the ordinal regression for Mbirikani Group Ranch. CV = continuous variable, BV = binary variable, (y) = yes, ECF = east coast fever, MCF = malignant catarrhal fever. Clan 1 = Ilaiser, clan 2 = Ilmolelian and clan 3 = Ilaitayiok. *p < 0.05, **p < 0.01.

For Mbirikani (Table 4), the overall result was significant (G22 = 37.879, p = 0.019), and the model had a good fit (Pearson χ2566 = 590.531, p = 0.230, i.e. the model did not differ significantly from the real values). Region had a significant affect on attitudes, with region 5 being significantly more negative towards wildlife than all other regions. The presence of any financial wildlife benefit was enough to improve people's attitudes to wildlife, whereas the actual amount of money generated did not significantly affect attitudes. Access to compensation for depredated livestock was the only other variable to affect attitudes.
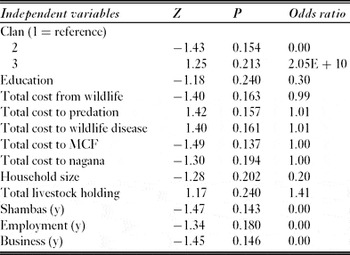
The regression for Merueshi included fewer independent variables; income from wildlife and total wildlife benefits were excluded because every respondent reported zero. Similarly, every Merueshi respondent owned land and did not receive compensation, so these variables were also excluded. Colinearity issues with ‘total cost to wildlife disease’ prevented cost of east coast fever being included in the model. The overall result was significant (G13 = 54.211, p < 0.001), and the model had a good fit (Pearson χ271 = 11.206, p = 1.000). However, no variables appeared to significantly affect attitudes to wildlife (Table 5).
Variables included in the ordinal logistic regression for Merueshi Group Ranch; (y) = yes, MCF = malignant catarrhal fever. Clan 1 = Ilaiser, clan 2 = Ilmolelian and clan 3 = Ilaitayiok.

Attitudes towards conservation
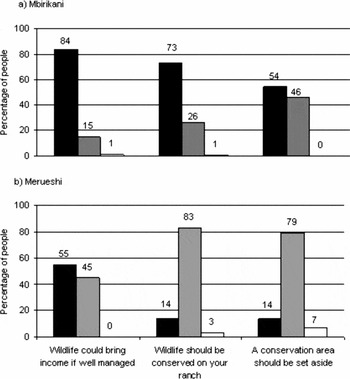
Attitudes towards conservation were determined by responses to a series of statements which required the respondent to agree or disagree; Mbirikani respondents were far more positive towards wildlife conservation than those on Merueshi (Fig. 3).
Responses to conservation statements by (a) Mbirikani households (n = 148) and (b) Merueshi households (n = 29) expressed as percentages. Black = agree, grey = disagree, white = don't know.

DISCUSSION
Quantifying community perceptions is key to translating ecology into management (White et al. Reference White, Vaughan Jennings, Renwick and Barker2005). It is generally believed that local communities are more likely to support conservation initiatives if they receive direct benefits from them (McNeely Reference McNeely1995). Since over 75% of the wildlife in Kenya lives outside National Parks (Ottichilo et al. Reference Ottichilo, Grunblatt, Said, Wargute, Prins, Grootenhuis and Dolan2000), its conservation depends on the activities of the local landowners and their compatibility with wildlife (Earnshaw & Emerton Reference Earnshaw, Emerton, Prins, Grootenhuis and Dolan2000). Understanding local landowners' attitudes towards wildlife and conservation is therefore an important prerequisite for any management policy.
Whilst our study design is unreplicated, and the ranches may differ in ways other than accessibility to wildlife revenues, they are ecologically matched, until recently were part of the same wildlife migration ecosystem and are typical of this area of Kenya's Maasailand. Thus, we consider that studying two neighbouring ranches within the same ecosystem was an appropriate way to investigate the effects of wildlife revenues on attitudes. Whilst the results are supported by observations from other ecologically similar environments (Infield Reference Infield1988; Gadd Reference Gadd2005), it should be remembered that this was an arid to semi-arid region and different attitudes may prevail in other Maasai lands. For instance, the much higher rainfall around the Maasai-Mara Game Reserve in south-west Kenya greatly enhances potential returns from agriculture, and wildlife is in steep decline because landowners convert to agriculture despite the considerable revenues generated from wildlife (Norton-Griffiths et al. Reference Norton-Griffiths, Said, Seernals, Kaelo, Coughenour, Lamprey, Thompson, Reid, Sinclair, Packer, Mduma and Fryxell2008).
In this study, many of the results gathered during the formal questionnaire survey were consistently re-emphasized in informal group discussion sessions with the community; this unprompted reinforcement of the findings gives credibility and increases confidence in the conclusions. In addition, the benefits reported by the respondents corresponded well with the Ol Donyo Wuas Trust records.
Benefits generated by wildlife
In 2005, wildlife on Mbirikani generated US$5.3 ha−1. The mean wildlife rent received by landowners in Kenya was US$ 3.92 ha−1 yr−1, with 95% confidence intervals of US$ 2.28–6.73 (Norton-Griffiths et al. Reference Norton-Griffiths, Said, Seernals, Kaelo, Coughenour, Lamprey, Thompson, Reid, Sinclair, Packer, Mduma and Fryxell2008). However, misappropriation of funds by the ranch committee is a familiar story over much of Maasailand, with only a few members benefiting significantly from wildlife earnings (Ogutu Reference Ogutu2002; Thompson & Homewood Reference Thompson and Homewood2002). This was also the case on Mbirikani, despite the relatively high annual income. Region 2 households received the most benefits from wildlife, followed by region 3; these were the two regions closest to towns, schools, main roads and trading centres and the two regions with the most educated household heads, as well as being home to the members of the ranch committee. Region 4 received the least benefits from wildlife; a few members were employed as game scouts, but otherwise there were no benefits other than compensation. Regions 4 and 5 also suffered the highest wildlife-associated costs. During informal discussion sessions, members of regions 4 and 5 repeatedly complained about the uneven share of benefits and were angry at the committee's misappropriation of funds. Only 24% of households on Mbirikani received any financial benefits from wildlife and perceptions of inequitable sharing of revenues can engender negative feelings towards wildlife (Hazzah Reference Hazzah2007).
Attitudes to wildlife
Attitudes to herbivores and carnivores were investigated separately because of their different interactions with humans and livestock. Unsurprisingly, carnivores were less popular than herbivores on both ranches. Of those people that claimed to like either group, the reasons given were mostly benefit-related, especially education bursaries and employment opportunities. Carnivores, more so than herbivores, were perceived to be responsible for attracting tourists and creating jobs. However, one of the major factors resulting in a positive attitude to carnivores (for Mbirikani members) was the presence of the PCF, even though the average amount of compensation paid was considerably less than the market value of the livestock killed (S. Maclennan, unpublished data 2007).
Despite compensation and other benefits from wildlife for Mbirikani members, there was still a considerable proportion of household heads who reported they disliked both herbivores and carnivores. The vast majority of Merueshi households disliked both. The reasons for disliking carnivores were straightforward and there were no significant differences between regions. Reasons for disliking herbivores, however, differed significantly between regions, but were mostly related to the spread of disease and the perception of competition for resources with livestock. The latter merits further attention: some studies found little evidence that livestock numbers are reduced by high wildlife densities (Prins Reference Prins, Prins, Grootenhuis and Dolan2000) and, where competitive interactions did occur, their costs were ‘negligible’ (Deodatus Reference Deodatus, Prins, Grootenhuis and Dolan2000; Prins Reference Prins, Prins, Grootenhuis and Dolan2000). Conversely, a study in the Maasai Mara found that net returns from livestock would be 48% higher if wildlife were eliminated (Norton-Griffiths et al. Reference Norton-Griffiths, Said, Seernals, Kaelo, Coughenour, Lamprey, Thompson, Reid, Sinclair, Packer, Mduma and Fryxell2008). Whether resource competition is actually occurring in Mbirikani and Merueshi on the scale perceived by pastoralists is unknown. However, as with most conflict issues, it is perception which drives attitudes and actions (Mishra Reference Mishra1997), and so, whether real or imagined, conflict for resources must be considered important. It is noteworthy that regions 4 and 5, with easy access to grazing in the Chyulu Hills National Park, reported problems with resource competition significantly less often than expected, whilst Merueshi, which is more overgrazed, reported more.
So although there may be a widespread like or dislike of wildlife, the reasons vary spatially and different regions may require different approaches to conflict resolution (for example see Weladji et al. Reference Weladji, Moe and Vedeld2003). Hence understanding which factors influence attitudes and tolerance towards wildlife is critical for choosing the most appropriate solutions to conflict (Zimmerman et al. Reference Zimmerman, Walpole and Leader-Williams2005). These may be mitigations to reduce losses (Ogada et al. Reference Ogada, Woodroffe, Oguge and Frank2003), education campaigns to improve awareness (Marker et al. Reference Marker, Mills and Macdonald2003; Weladji et al. Reference Weladji, Moe and Vedeld2003) or the generation of financial incentives (Mishra et al. Reference Mishra, Allen, McCarthy, Madhusudan, Agvaantserengiin and Prins2003; Bulte & Rondeau Reference Bulte and Rondeau2005).
On Mbirikani, the simple presence of any wildlife benefits was enough to affect the attitudes of household heads to wildlife positively (Z = −2.44, p = 0.015), whereas the amount of revenue received (‘total wildlife benefits’) had no significant effect. Likewise, the amount of money lost by the household as a result of living with wildlife (‘total cost from wildlife’) had no significant effect on attitudes. Even when considering predation and different wildlife-related diseases separately, the scale of these costs had no affect on attitudes. Weladji et al. (Reference Weladji, Moe and Vedeld2003) also found that local peoples' attitudes in Cameroon were not significantly affected by the extent of wildlife damage, as did Heinen (Reference Heinen1993) in Nepal and Fiallo & Jacobson (Reference Fiallo and Jacobson1995) in Ecuador.
These results suggest that conservation efforts should focus on increasing the spread of wildlife benefits more than simply aiming to increase the total revenue generated, and should prioritize increasing benefits over decreasing costs. Both these points were emphasized during informal discussions with the community, where people in marginalized regions consistently complained about the ‘unfair distribution’ of wildlife benefits, while very little was said about revenues being too low. Whilst there were complaints about the costs from wildlife (mostly predation), this was always related to the concurrent lack of benefits in the most problematic areas.
Furthermore, wildlife revenues do not have to benefit every household for them to improve attitudes; having a close friend or relative benefiting from wildlife is sufficient to engender a more positive attitude to wildlife (J. Roque de Pinho, unpublished data 2007). We found that double the number of people claimed to like herbivores or carnivores because they perceived them as bringing educational bursaries to others (20%) than those who liked them because they received bursaries personally (10%). Clearly not every individual needs to benefit personally from wildlife in order to see its value, but it does emphasize the importance of distributing benefits widely, perhaps even to the extent of trying to ensure that at least one member of every extended family receives some benefit from wildlife.
The ability to receive compensation was the second significant variable affecting people's attitudes to wildlife. On Mbirikani, compensation was available to everyone. At the time of the interviews however, there were some disputes over the compensation system and several people from higher conflict areas had decided to veto the scheme, thus answering ‘no’ when asked whether they would be entitled to compensation in the event of livestock depredation. They were generally disillusioned with wildlife and conservation efforts (see Hazzah Reference Hazzah2007), and so it is unsurprising that they had significantly lower attitude scores than those who answered yes to the compensation question. The results for the rest of the model did not change if this variable was removed.
The final variable found to have a significant affect on peoples' attitudes to wildlife was region, with region 5 (the reference region) having significantly more negative attitudes to wildlife than all other regions. There are several reasons. Region 5 suffered most from both predation and wildlife-related diseases (see Groom Reference Groom2007) but received fewer benefits than some other regions. This was a source of friction, not least because the benefits they did receive were disproportionately low in relation to the conflict they endured (Hazzah Reference Hazzah2007). This region was also politically and socially marginalized from both conservation initiatives and their own ranch (Hazzah Reference Hazzah2007), which can incite negative attitudes.
Using livestock holding as an indicator of wealth, there was no significant effect of wealth on people's attitudes to wildlife. This is consistent with studies using ‘household income’ as an indicator of wealth (for example Parry & Campbell Reference Parry and Campbell1992; Heinen Reference Heinen1993; Weladji et al. Reference Weladji, Moe and Vedeld2003). Employment, business, household size, shamba ownership and land ownership were also statistically unimportant in affecting attitudes to wildlife, as was the level of education of the respondent. Many other authors report no significant effect of education on local peoples' attitudes to wildlife and conservation (for example Parry & Campbell Reference Parry and Campbell1992; Newmark et al. Reference Newmark, Leonard, Sariko and Gamassa1993; Weladji et al. Reference Weladji, Moe and Vedeld2003), although some studies did find it significant (for example Heinen Reference Heinen1993; Fiallo & Jacobson Reference Fiallo and Jacobson1995). Whilst Infield & Namara (Reference Infield and Namara2001) found that attitudes in Uganda were significantly influenced by land ownership, the lack of any relationship in this study was most likely due to the near-uniformity in land ownership; only nine households (6%) on Mbirikani owned land.
None of the variables included in the ordinal logistic regression for Merueshi were found to affect people's attitudes to wildlife. This may be due to the fairly low variation of attitudes; almost 50% of Merueshi respondents had a score of 1, whilst only one person scored 4 and there were no scores of 5. The sample size for Merueshi (n = 29) was also fairly small, and there were fewer variables within the regression model, since no household received any benefits or compensation. However, as on Mbirikani, the scale of costs from wildlife did not significantly affect the attitude of the household head towards wildlife. Attitudes were uniformly poor, with no particular reasons responsible.
Attitudes towards conservation
Participants' responses to conservation-oriented statements illustrate the considerable difference in attitudes to wildlife conservation between the two ranches: on Merueshi, the vast majority of people (83%) disagreed that wildlife should be conserved on their ranch, compared with only 26% on Mbirikani. This is despite the fact that 55% of Merueshi respondents agreed that wildlife could bring ‘lots of income’ to their households if it were managed properly. So, although many Merueshi household heads recognized that wildlife was potentially a valuable resource, very few (14%) showed any desire to try and conserve it. The much higher percentage of people (84%) on Mbirikani who agreed that wildlife could potentially bring them considerable income was probably because many had received income personally or witnessed others doing so.
CONCLUSIONS
Whilst financial incentives from wildlife can improve community attitudes towards both wildlife and its conservation, the distribution of benefits is the most important factor in shaping attitudes, and is more important than the amount of money provided, or the costs incurred from wildlife. Specific feelings towards wildlife were influenced by perceptions of conflict, and these differed significantly within Mbirikani. Where no wildlife benefits were available, attitudes to conservation were significantly more negative than where revenue had been generated, even with the enormous inequality in revenue sharing. A more equitable distribution of earnings from wildlife would increase support for wildlife, and educational efforts are important for people to understand how conservation works.
ACKNOWLEDGEMENTS
We thank Columbus Zoo and the Dulverton Trust for funding, James Solitei and Justus Supeet for assistance in the field, and Richard Bonham of Ol Donyo Wuas Lodge and Trust for his support and provision of data. Dr David Western provided valuable help and advice. We thank two anonymous referees for their comments on an earlier draft.