


Introduction
One of the most commonly studied components of the Clark and Wells (Reference Clark, Wells and Heimberg1995) cognitive model of social phobia is post-event processing, which includes the tendency to evaluate and re-appraise one's own performance following social interactions. For individuals with elevated levels of social anxiety, this appraisal is typically perseverative and negatively biased (Brozovich and Heimberg, Reference Brozovich and Heimberg2008; Penney and Abbott, Reference Penney and Abbott2014). As a result, a negative consequence of post-event processing is that anxiety may continue even after the termination of a social interaction and enhances negative evaluations of previous social interactions due to a negatively biased reappraisal of the interaction. Consequently, post-event processing may influence one's perception of competence in subsequent social interactions (Clark, Reference Clark, Crozier and Alden2001; Clark and Wells, Reference Clark, Wells and Heimberg1995). It is noteworthy to make a distinction between maladaptive post-event processing, and more normative, repetitive thinking that may commonly occur after a social situation. More specifically, it is likely that most individuals engage in some level of repetitive thinking and appraisal following a social interaction, and for most individuals, this appraisal is not necessarily negatively biased, likely to be shorter in duration, and more likely to be constructive (Watkins, Reference Watkins2008). Consequently, for the purpose of this study, the term post-event processing (PEP) is generally reserved for excessive and negatively biased re-appraisal that can occur following social interactions.
Consistent empirical support has been found for the association between PEP and social anxiety symptoms. In one of the first studies to examine this construct, Rachman et al. (Reference Rachman, Gruter-Andrew and Shafran2000) developed a self-report measure to assess PEP, which was found to be associated with elevated levels of social anxiety. Furthermore, the authors found that socially anxious participants reported frequent and intrusive memories of previous social interactions. These memories were reported to interfere with concentration and were found to be difficult to control. In addition, higher levels of social anxiety were related to a desire to avoid similar social situations in the future and to relive the experience in order to correct perceived mistakes. Other studies have provided additional support for the association between PEP and social anxiety symptoms (Dannahy and Stopa, Reference Dannahy and Stopa2007; Fehm et al., Reference Fehm, Schneider and Hoyer2007; Kocovski et al., Reference Kocovski, Endler, Rector and Flett2005; McEnvoy and Kingsep, Reference McEnvoy and Kingsep2006; McEnvoy et al., Reference McEnvoy, Mahoney, Perini and Kingsep2009; Wong, Reference Wong2015). In a number of studies, the focus has been on the psychometric properties of measures of post-event processing, as a self-report measure. These studies have found PEP to be a valid and reliable construct, which includes the consistent finding of a positive association between higher levels of post-event processing and anxiety (Fehm et al., Reference Fehm, Schneider and Hoyer2007; McEnvoy and Kingsep, Reference McEnvoy and Kingsep2006; Wong, Reference Wong2015). Interactive tasks have been also used to assess PEP. For example, Dannahy and Stopa (Reference Dannahy and Stopa2007) asked participants to appraise their performance following a conversation with a stranger. Relative to individuals with lower levels of social anxiety, individuals with higher levels of social anxiety underestimated their true performance in the social situation and reported more post-event processing following the social interaction. In a similar study, Kocovski et al. (Reference Kocovski, Endler, Rector and Flett2005) examined appraisals after asking participants to imagine two scenarios in which they make mistakes in a public setting. Individuals with higher levels of social anxiety reported more negative appraisals and rumination after exposure to the vignettes. Overall, the association between PEP and the severity of social anxiety symptoms has been well supported.
Based on preliminary research, a number of cognitive variables have been found to predict engagement in PEP, including self-focused attention, intolerance of uncertainty, and perfectionism (e.g. Helbig-Lang et al., Reference Helbig-Lang, Poels and Lincoln2016; Shikatani et al., Reference Shikatani, Antony, Cassin and Kuo2016). However, one direction for research that has received little attention is the role of underlying metacognitive beliefs that may contribute to PEP and social anxiety symptoms, including positive beliefs and negative beliefs about PEP. In particular, consistent with metacognitive models for other forms of repetitive negative thinking, including worry and depressive rumination (Papageorgiou and Wells, Reference Papageorgiou and Wells2001a, Reference Papageorgiou and Wells2003; Wells, Reference Wells, Davey and Wells2006), it is possible that positive and negative beliefs influence the tendency to engage in excessive and negatively biased post-event processing and social anxiety symptoms. Although this premise seems to be a logical extension of existing metacognitive models, the relevance of positive and negative metacognitive beliefs about post-event processing has received surprisingly little attention. Two initial studies have examined the association between positive metacognitive beliefs and post-event processing. In particular, Wong and Moulds (Reference Wong and Moulds2010) examined the relationship between positive beliefs about ruminative processes and social anxiety symptoms. More specifically, the Positive Beliefs about Rumination Scale (PBRS) developed by Papageorgiou and Wells (Reference Papageorgiou and Wells2001b) was modified to assess positive beliefs about rumination following social interactions. The authors found positive beliefs about rumination to be a predictor of social anxiety and ruminative processes. More recently, Fisak and Hammond (Reference Fisak and Hammond2013) developed a measure designed to assess positive beliefs specific to post-event processing called the Positive Beliefs about Post-Event Processing (PB-PEPQ), which was found to exhibit good psychometric properties. Validity was supported as the measure was found to predict scores on measures of PEP and social anxiety symptoms.
Collectively, the above-mentioned studies provide initial evidence for potential applicability of metacognitive models to social anxiety and PEP, and it is possible that both positive and negative beliefs about PEP may increase the tendency to engage in PEP and to experience social anxiety symptoms. However, a measure of negative beliefs about PEP has yet to be developed. Consequently, the primary purpose of this study was to develop and examine the psychometric properties of a measure to assess negative beliefs about post-event processing, called the negative beliefs about post-event processing questionnaire (NB-PEPQ; see Appendix). This measure was based on modified items from the negative beliefs about rumination scale (NBRS; Papageorgiou and Wells, Reference Papageorgiou and Wells2001a, Reference Papageorgiou and Wells2003).
The focus of this study was to examine the factor structure and reliability of the NB-PEPQ, followed by an assessment of the validity of this measure. It was hypothesized that the NB-PEPQ would exhibit significant, positive correlations with measures of social anxiety symptoms, post-event processing, and positive beliefs about post-event processing. It was also hypothesized that the NB-PEPQ would exhibit incremental validity; the measure was expected to predict variance in social anxiety and post-event processing scores after controlling for scores on the NBRS. Finally, the development of the NB-PEPQ has provided the first opportunity to assess the relative contribution of both negative and positive beliefs about PEP to social anxiety symptoms and excessive PEP. In particular, it was hypothesized that the NB-PEPQ and the positive beliefs about post-event processing questionnaire (PB-PEPQ) would both predict unique variance in scores on measures of social anxiety symptoms and post-event processing.
Method
Participants
Participants were 728 undergraduate student volunteers, who completed the measures in exchange for extra credit. Surveys were completed through an online subject pool. Average participant age was 21.37 years (SD = 6.46), and the sample was 69.8% female. The ethnicities of the participants were as follows: 55.6% Caucasian/White, 20.5% Hispanic, 11.8% African-American/Black, 7.00% Asian/Pacific Islander, and 5.0% other.
Design and procedures
The study was internet-based, in which participants completed self-report measures online. Participants were required to be students enrolled at the University of Central Florida and 18 years of age or older. Otherwise, no exclusionary criteria were in place. Participants were first required to review and electronically sign an informed consent form, and were then asked to complete the measures listed below. Following completion of the study, participants were assigned extra credit in exchange for their participation.
Measures
In addition to a demographic questionnaire, the following measures were administered:
Negative Beliefs about Post-Event Processing Questionnaire (NB-PEPQ). The NB-PEPQ is an eleven-item measure developed to assess negative beliefs that individuals may typically hold about engagement in PEP, including beliefs about uncontrollability and negative consequences. The items were modified from items on the NBRS (Papageorgiou and Wells, Reference Papageorgiou and Wells2001a, Reference Papageorgiou and Wells2003), and were rated on a four-point Likert scale, with responses ranging from 1 (do not agree) to 4 (agree very much).
Positive Beliefs about Post-Event Processing Questionnaire (PB-PEPQ). The PB-PEPQ is a 23-item questionnaire developed by Fisak and Hammond (Reference Fisak and Hammond2013), to assess positive beliefs that individuals hold about the benefits of engaging in PEP. More specifically, items assessed recent social interactions, thoughts about the interaction after it occurred, and motivation for reviewing the social interaction. The items are rated on a four-point Likert scale, with responses ranging from 1 (do not agree) to 4 (agree very much). The PB-PEPQ has been found to exhibit adequate psychometric properties including internal consistency, concurrent validity, and incremental validity (Fisak and Hammond, Reference Fisak and Hammond2013). Cronbach's alpha in the current sample was .92.
Extended Post-Event Processing Questionnaire (E-PEPQ). The E-PEPQ is designed to assess the degree to which individuals engage in PEP (Wong, Reference Wong2015). More specifically, the E-PEPQ measures thoughts and beliefs that individuals may experience following social interactions (Wong, Reference Wong2015). The E-PEPQ is based on previous versions of the E-PEPQ (Fehm et al., Reference Fehm, Hoyer, Schneider, Lindemann and Klusmann2008). Wong (Reference Wong2015) derived a three-factor solution, with subscales labelled cognitive interference, negative self, and thoughts about the past. Overall, psychometric properties for this measure have been found to be excellent, and Cronbach's alpha in the current sample was .87 for the total scores on the E-PEPQ.
Social Phobia Inventory (SPIN). The SPIN evaluates fear, avoidance and physiological discomfort in social situations (Conner et al., Reference Conner, Davidson, Churchill, Sherwood, Weisler and Foa2000). There are seventeen items rated on a five-point Likert scale, ranging from 1 (do not agree) to 5 (strongly agree). Based on a mixed sample of clinical and non-clinical participants, the SPIN has been shown to have good psychometric properties, including good test–retest reliability, internal consistency, and divergent validity (Conner et al., Reference Conner, Davidson, Churchill, Sherwood, Weisler and Foa2000). Furthermore, good convergent validity was found when compared with other measures of social anxiety symptoms (Conner et al., Reference Conner, Davidson, Churchill, Sherwood, Weisler and Foa2000). In addition, excellent psychometric properties have been found in non-referred college student samples (Radomsky et al., Reference Radomsky, Ashbaugh, Saxe, Ouimet, Golden, Lavoie and O'Connor2006). Cronbach's alpha was .92 in the current sample.
Negative Beliefs about Rumination Scale (NBRS). The NBRS is a 13-item measure designed to assess negative beliefs about rumination (Papageorgiou and Wells, Reference Papageorgiou and Wells2001a, Reference Papageorgiou and Wells2003). The measure consists of a subscale that assesses beliefs about the uncontrollability and danger of ruminative thoughts, and a subscale that assesses the negative social/interpersonal consequences related to engagement in ruminative thinking. Items are rated on a four-point Likert scale, with responses ranging from 1 (do not agree) to 4 (agree very much). The NBRS has been found to exhibit adequate psychometric properties, including adequate validity, as the measure has been found to be significantly associated with scores on measures of depressive rumination, positive beliefs about rumination, and depression symptoms in both clinical and non-clinical samples. In the current sample, Cronbach's alpha was .92.
Results
Factor structure and reliability of NB-PEPQ
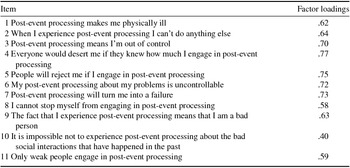
The items from the NB-PEPQ were subjected to an exploratory factor analysis, in which a principle axis factor extraction method was used with a Promax factor rotation. Items were retained if they loaded .30 or higher on only one factor. Based on the scree plot and an inspection of the items, a one-factor solution appeared to be the most parsimonious and practical model. Consequently a one-factor model was retained and all items loaded significantly on this factor (see Table 1). Cronbach's alpha was .88.
Factor loadings for items on the Negative Beliefs about Post-Event Processing Questionnaire

A principle axis extraction method was utilized. Factor loadings of .30 and above were retained.
Validity of the NB-PEPQ
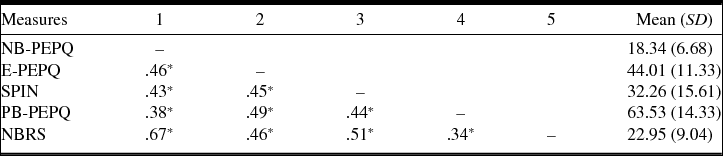
First, bivariate correlations between the above-mentioned subscales of the NB-PEPQ and related constructs were inspected (see Table 2). As anticipated, the NB-PEPQ was significantly associated with social anxiety, post-event processing, and positive beliefs about post-event processing. Next, multiple regressions were conducted to examine the unique contributions of the NB-PEPQ and the PB-PEPQ to scores on the SPIN and E-PEPQ. When entered simultaneously into a regression equation, the NB-PEPQ (β = .32, p < .001) and PB-PEPQ (β = .37, p < .001) predicted unique variance in scores on the E-PEPQ (R 2 = .33, F (2,723) = 179.55, p < .001). The multiple regression was repeated with scores on the SPIN as the criterion variable. Again, when entered simultaneously into a regression equation, the NB-PEPQ (β = .30, p < .001) and PB-PEPQ (β = .32, p < .001) predicted unique variance in scores on the E-PEPQ (R 2 = .27, F (2,723) = 133.97, p < .001). Overall, both positive and negative beliefs about post-event processing were found to predict unique variance in post-event processing and social anxiety scores.
Correlation matrix, means and standard deviations for study variables
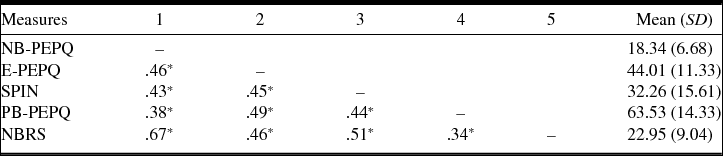
*p < .01. NB-PEPQ-1, Negative Beliefs about Post-Event Processing – Negative Consequences Subscale; NB-PEPQ-2, Negative Beliefs about Post-Event Processing-Uncontrollability Subscale; E-PEPQ, Extended Post-Event Processing Questionnaire; SPIN, Social Phobia Inventory; PB-PEPQ, Positive Beliefs about Post-Event Processing Questionnaire; NBRS, Negative Beliefs about Rumination Scale.
Incremental validity was examined by assessing the degree to which negative beliefs about post-event processing predicted scores on the E-PEPQ after controlling for scores on the NBRS. This hypothesis was tested through the use of hierarchical regression equations. In the first regression, the NBRS was entered as a predictor variable in the first step of the equation, and the NB-PEPQ was entered as a predictor in the second step. The first step of the regression equation was significant (R 2 = .21, F (1,724) = 194.15, p < .001), and the addition of the NB-PEPQ to the second step of the equation led to a significant improvement the model (ΔR 2 = .04, F (1,723) = 124.67, p < .001). The NBRS (β = .27, p < .001) and the NB-PEPQ (β = .28, p < .001) were both significant and unique predictors of scores on the E-PEPQ. The regression analysis was repeated with the SPIN as the criterion variable. Again, the first step was significant (R 2 = .26, F (1,724) = 254.57, p < .001), and the addition of the NB-PEPQ in the second step of the equation led to a significant improvement in the model (ΔR 2 = .01, F (1,723) = 135.73, p < .001). The NBRS (β = .41, p < .001) and the NB-PEPQ (β = .15, p < .001) were both significant and unique predictors of scores on the SPIN. Overall, the NB-PEPQ was found to predict variance in post-event processing and social anxiety scores after controlling for scores on the NBRS.
Discussion
The primary purpose of this study was to develop and examine the psychometric properties of a measure designed to assess negative beliefs about post-event processing. In particular, the negative beliefs about the post-event processing questionnaire (NB-PEPQ) is an 11-item measure that was created by modifying items from the negative beliefs about rumination scale (NBRS; Papageorgiou and Wells, Reference Papageorgiou and Wells2001a). An exploratory factor analysis yielded a single factor solution, and all items were retained on this factor (see Table 1). Furthermore, the Cronbach's alpha for this factor was good, suggesting adequate internal consistency. In general, these findings indicate that, based on a non-referred sample, negative beliefs about post-event processing is a single construct that measures beliefs about the negative consequences of PEP, including the perceived danger and uncontrollability of PEP and the perceived negative social consequences that result from engaging in PEP.
Following examination of the factor structure and reliability of the NB-PEPQ, the validity of this measure was assessed. As hypothesized, significant, positive correlations were found between the NB-PEPQ and both social anxiety symptoms and post-event processing. Although the direction of these relationships cannot be ascertained based on the design of the current study, the findings suggest that the tendency to experience negative metacognitive beliefs about post-event processing, including the beliefs about the danger, uncontrollability, and negative social consequences, is related to elevated levels of social anxiety and the tendency to engage in post-event processing.
It is noteworthy that this is the first study to examine the relative contribution of both positive and negative beliefs about PEP to social anxiety symptoms and post-event processing. Based on metacognitive models of worry and depressive rumination (Papageorgiou and Wells, Reference Papageorgiou and Wells2001; Wells, Reference Wells1995, Reference Wells, Davey and Wells2006), it was hypothesized that both positive and negative beliefs about PEP would predict unique variance in social anxiety symptoms and the tendency to engage in post-event processing. As anticipated, this hypothesis was supported, as both measures predicted a similar magnitude of variance in social anxiety and post-event processing scores. Based on this finding, it possible that metacognitive models developed for other forms of repetitive negative thinking, including excessive worry and depressive rumination, may also be applicable to post-event processing and social anxiety (Papageorgiou and Wells, Reference Papageorgiou and Wells2001; Wells, Reference Wells1995, Reference Wells, Davey and Wells2006). Consequently, it is recommended that follow-up studies are conducted to test the applicability of these models (e.g. Papageorgiou and Wells, Reference Papageorgiou and Wells2003). For example, Papageorgiou and Wells (Reference Papageorgiou and Wells2003) developed and tested a model to explain depressive symptoms. As part of this model, (1) depressive rumination was hypothesized to mediate the association between positive and negative beliefs about rumination, and (2) negative beliefs about rumination were hypothesized to mediate the association between depressive rumination and depressive symptoms. In follow-up studies, an analogous model could be assessed in relation to social anxiety and post-event processing.
It was also hypothesized that the NB-PEPQ would exhibit incremental validity, as it was anticipated that the measure would predict unique variance in social anxiety and post-event processing scores after controlling for scores on the NBRS. This hypothesis was supported, and these findings provide evidence for the unique role and utility of the NB-PEPQ in social anxiety research. However, it is noteworthy that the NBRS and NB-PEPQ exhibited a significant amount of shared variance. One explanation is that depressive rumination and post-event processing are similar forms of repetitive negative thinking. As a result, it follows that overlap exists in the underlying metacognitive beliefs that maintain both depressive rumination and post-event processing. Furthermore, even with shared variance between the NBRS and NB-PEPQ, an additional argument exists for the utility of the NB-PEPQ. In particular, although negative beliefs about rumination and negative beliefs about post-event processing may, to a certain degree, be overlapping constructs, the NB-PEPQ is a more practical tool to use in subsequent studies where researchers are interested in examining the influence of negative beliefs in relation to post-event processing. More specifically, the NB-PEPQ may be a practical measure to use in post-event processing and social anxiety research, as it would provide more continuity and more of a logical flow in social anxiety studies.
Although the findings of the current study are promising, a number of limitations and directions for future research are noteworthy. First, this study provides only a preliminary evaluation of the psychometric properties of the NB-PEPQ, and follow-up research is needed to provide additional assessment of the reliability and validity of this measure. For example, follow-up studies are needed to examine the utility of this measure in clinical samples and to examine the degree to which the measure discriminates between clinical and non-referred samples. In addition, in subsequent studies, it is recommended that confirmatory factor analysis is conducted to provide additional support for the factor structure of the NB-PEPQ, and that test–retest reliability is examined.
It is also noteworthy that the current study relied exclusively on self-report measures, and the use of self-report measures has limitations, as participants may not always be willing or able to accurately report their experiences. Another concern more specific to the NB-PEPQ is that this measure requires that participants read and understand specific instructions. In particular, the term ‘post-event processing’ is defined in the instructions. However, based on previous research, participants do not always carefully read and/or follow instructions (Oppenheimer et al., Reference Oppenheimer, Meyvis and Davidenko2009). Although the quality of the data seem to indicate that participants generally appeared to read and follow the instructions, it is possible that a number of participants either did not follow or did not understand the instructions, which may have led to a reduction in the reliability. Consequently, manipulation checks may be warranted in follow-up studies.
In addition, it is recommended that other approaches are utilized to assess the relevance of negative beliefs about post-event processing, including experimental methodology. For example, it may be beneficial to examine negative beliefs about post-event processing following social interactions (Dannahy and Stopa, Reference Dannahy and Stopa2007; Kocovski et al., Reference Kocovski, Endler, Rector and Flett2005). Furthermore, the use of longitudinal methodology is recommended to elucidate the direction of the relationship between beliefs about post-event processing and social anxiety symptoms. Overall, despite the above-mentioned limitations and directions for future research, this study provides a significant contribution to the research, as the first study to directly assess negative beliefs about post-event processing.
Acknowledgements
Conflicts of interest: The authors of this manuscript have no conflicts of interest to disclose.
Ethical approval: All procedures were performed in accordance with the ethical standards of the appropriate Institutional Review Board, the 1964 Helsinki declaration and its later amendments, and the American Psychological Association ethical standards for human subjects’ research.
Informed consent: Informed consent was obtained from all participants in this study. Informed consent procedures were obtained in compliance with American Psychological Association ethical standards for human subjects’ research, and the informed consent form was approved by the appropriate Institutional Review Board.
Financial support: None.
Appendix: The Negative Beliefs about Post-Event Processing Questionnaire
Instructions: Most people think about social interactions after they happen, a process called post-event processing . For example, after a social interaction, some people may ask themselves, ‘did I make a fool of myself?’, ‘did he or she like me?’, or ‘did I make a positive impression?’. Below are beliefs that some individuals may have about their post-event processing (thought after a social interaction). Please indicate the degree to which you generally agree with each of the below statements.




Comments
No Comments have been published for this article.