INTRODUCTION
Most organisms are not evenly distributed throughout their environment and, in many cases individuals of the same species are clustered into specific combinations of habitat variables that define the species' niche (Brown et al., Reference Brown, Mehlman and Stevens1995). This niche can be defined by an n-dimensional hyperspace, where n is the number of variables used to describe it (Hutcheson, Reference Hutchinson1957; MacArthur, Reference MacArthur1972; Brown et al., Reference Brown, Mehlman and Stevens1995; Chase & Leibold, Reference Chase and Leibold2003). The local environment can also be considered as an n-dimensional hyperspace using the same variables. Where these two hyperspaces intersect, the combinations of the n variables in the environment fall within the niche space and the species will be able to occur. However, where the two hyperspaces do not intersect, the species will not be able to occur because the values for one or more variables, either on their own or in combination, do not fall within the niche space (Brown et al., Reference Brown, Mehlman and Stevens1995; Robertson et al., Reference Robertson, Caithness and Villet2001; Chase & Leibold, Reference Chase and Leibold2003). This means that if the niche a species occupies in relation to specific combinations of important environmental variables can be identified, this information can be used to provide a picture of where that species is likely to occur and where it is likely to be absent (Brown et al., Reference Brown, Mehlman and Stevens1995; Guisan & Thuiller, Reference Guisan and Thuiller2005). This approach for understanding the distribution of organisms is becoming increasingly important in terms of assessing and modelling species distribution, identifying and protecting essential habitats, and in terms of assessing and mitigating human impacts upon organisms (e.g. Brown et al., Reference Brown, Mehlman and Stevens1995; Rieser, Reference Rieser2000; Guisan & Zimmermann, Reference Guisan and Zimmerman2000; Guisan & Thuiller, Reference Guisan and Thuiller2005; Hastie et al., Reference Hastie, Swift, Slesser, Thompson and Turrell2005).
Investigating the relationship between a species' occurrence and environmental variables is not always straightforward. In particular, while in an ideal world, all possible locations in an area of interest would be surveyed to determine species occurrence in relation to all available combinations of the habitat variables, in reality this is usually logistically and/or financially unfeasible, particularly for larger areas and more widespread species. As a more feasible approach, many studies sample a limited number of all possible locations, and use the relationship between species occurrence and environmental variables in this sample to infer the wider distribution. This approach, known by a variety of names such as habitat suitability modelling (HSM; e.g. Vadas & Orth, Reference Vadas and Orth2001), essential habitat modelling (ESH; e.g. Clark et al., Reference Clark, Christensen, Monaco, Caldwell, Matthews and Minello2004), ecological niche modelling (e.g. Hirzel et al., Reference Hirzel, Hausser, Chessel and Perrin2002) or species distribution models (SDM; e.g. Guisan & Thuiller, Reference Guisan and Thuiller2005), is becoming increasingly widespread in both the marine and terrestrial environments due to the growing use of geographical information systems (GIS; e.g. Peterson, Reference Peterson2001), new developments in spatial modelling techniques, and the increasing availability of sufficient computer power to construct complex models using multiple environmental variables on desktop computers (Guisan & Zimmermann, Reference Guisan and Zimmerman2000). In general, these modelling approaches are based on the ‘occupied’ niche of a species, i.e. the combination of variables where it actually occurs. This may reflect the ‘fundamental’ niche of the species, which consists of all combinations of variables where it could possibly occur, or the ‘realized’ niche which represents a more restricted occurrence within the fundamental niche. While it can be difficult to identify which of these the ‘occupied’ niches reflects, for most species distribution modelling purposes, making this distinction is not essential.
While the use of species distribution modelling is growing rapidly, it is important to remember that in order to accurately model a species distribution from its environmental preferences, it is best if the data used to build the model are representative of the full range of all available habitat combinations (i.e. adequately sample the entire environmental n-dimensional hyperspace available to a species). As might be expected, if there are large differences between the available habitat combinations and those surveyed, then any model produced may not be a true representation of the actual species distribution. This can occur for two reasons. Firstly, there may be specific habitat combinations where a species occurs that are not adequately sampled, resulting in an under-estimation of the niche hyperspace occupied by a species. Secondly, a species may be absent from a specific location where it might be expected to occur because while one or most environmental variables are suitable, these co-occur with specific values of other variables that make the otherwise suitable habitat unsuitable. This may, in turn, lead to an over-estimation of the species niche hyperspace (Fielding & Bell, Reference Fielding and Bell1997; Peterson, Reference Peterson2001). The under- or over-estimation of the occupied niche hyperspace may have serious consequences if the modelled distribution is then used to assess possible human impacts on a species, infer the local density of individuals or identify critical areas where conservation measures should be implemented, as the distribution itself may also be under- or over-estimated.
While there has been a great deal of research into the best design for surveys collecting data that will be used to estimate the abundance of organisms within a given area (e.g. Buckland et al., Reference Buckland, Anderson, Burnham, Laake, Borchers and Thomas2001; Strindberg & Buckland, Reference Strindberg and Buckland2004), there has been little similar work into investigating how survey design and coverage may affect how representative data collected are of all available habitat combinations (i.e. the environmental n-dimensional hyperspace) and, therefore, its suitability for modelling a species distribution (Hirzel & Guisan, Reference Hirzel and Guisan2002). This is particularly an issue in the marine environment where collecting data on species distribution is often logistically complex and financially expensive, so data are often collected as part of research programmes also collecting data on a wide range of organisms and for a wide variety of purposes. As a result, scientists working on individual organisms may not have complete control over the locations sampled during a survey. Similarly, even when the survey design is under the researcher's control, external factors, such as poor weather or equipment failure may result in gaps in planned survey coverage. Therefore, it would be beneficial to have a method that allowed the pre-study assessment of the representativeness of a survey design and/or post hoc assessment of the representativeness of data collected before any analysis of habitat preferences or spatial modelling is conducted. This would, in turn, allow the extent to which the results can be generalized across a wider area to be assessed.
However, while assessing the representativeness of a proposed survey design or of a specific survey track for one or two variables, individually and/or in combination, is relatively straightforward, studies investigating habitat preferences and modelling species distribution frequently use three or more individual variables which may all vary, more or less, separately from each other. As a result, there are likely to be a large number of available combinations of these variables within an area, all of which may have their own influence on a species likelihood of occurrence at a specific location. For example, a species could differ in its water depth preference with different combinations of water temperature and salinity. As a result, simply sampling the full range of water depths, water temperatures and salinities may not provide an adequate representation of how a species is distributed in relation to these variables in consort if the sample does not also cover all available combinations of the three variables.
While the representativeness of survey coverage of habitat variables is often considered on an informal, subjective basis, here a formal, objective approach is proposed that allows how representative a data set is of all available combinations of specific habitat variables of interest within an area to be assessed. Such formal, objective assessment can be conducted either during survey design (as used in the example below) or post hoc once data have been collected. This, in turn, may benefit studies of habitat preferences, particularly those that use habitat preferences to build predictive models of species distribution, by providing a greater understanding of how data compare to the wider, unsampled environment. This approach is demonstrated by assessing the minimum number of evenly-spaced parallel north–south survey transects required to collect a representative sample of data in relation to four specific habitat variables at two study sites with differing levels of environmental heterogeneity.
While this approach could also be used to directly compare the representativeness of data collected using different sampling protocols for specific circumstances (e.g. randomly versus regularly placed survey transects or transect versus point sampling), the purpose of this study is to demonstrate how representativeness can be assessed using this approach. Therefore, the relative merits of different potential sampling protocols, other than those directly related to the specific question addressed here, are not considered.
MATERIALS AND METHODS
The habitat representativeness score (HRS) concept
Multi-variate statistical techniques can be used to assess the variation within a data set by scoring individual data points along a number of axes or dimensions created based on the combinations of values for all variables of each data point within the data set. This aspect of multi-variate statistical techniques can be exploited to compare the combinations of habitat variables likely to be obtained from a given survey design (or actually obtained from a survey if a post hoc test is being conducted) to an estimate of all available combinations of the same variables for a study area as a whole. Through this, a habitat representativeness score (HRS) can be calculated to provide a measure of how representative sampled habitat combinations are likely to be of all available combinations, and therefore how representative any habitat preferences identified from sampled areas are likely to be of the entire study area. This concept is based, in part, on the principal component analysis (PCA)-based approach developed by Robertson et al. (Reference Robertson, Caithness and Villet2001) to model a species distribution in relation to variations in its local environment. However, instead of comparing all available habitat combinations to species habitat preferences to predict the species distribution, the sampled habitat is compared to an estimate of the available habitat to assess the extent to which the two differ. While any suitable multi-variate techniques could be applied to calculate a HRS, this study used one specific technique, PCA, to demonstrate the background and practical application of the HRS approach.
In a PCA, the first principal component axis represents the greatest variation within the data set, with each subsequent axis representing a lesser amount of variation until 100% of the variation is explained. In order to assess how different subsets of data compare in terms of variation in their combined values for all variables, the scores for each principal component for one set of data can be compared to the other. If there is a substantial difference in the distribution of principal component scores between the data sets on one or more of the principal component axes, this is will indicate that they do not consist of data with similar combinations of the variables examined.
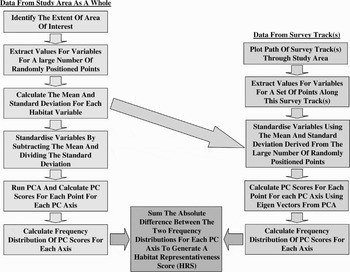
The HRS is calculated in two stages. Firstly, to estimate the available habitat, a large number of points are randomly placed throughout the study area (left hand-side of Figure 1). These should be of sufficient number to be representative of all available habitat combinations for the variables being examined (see below for one possible way to assess this). The value for each variable for each of these points is then standardized by subtracting the mean value of that variable from the actual value for each point and then dividing by the standard deviation (following Robertson et al., Reference Robertson, Caithness and Villet2001). This ensures that variables measured on different scales are treated as equal during the analytical process. A PCA is then conducted on these standardized values and a principal component score is calculated for each axis for each of the data points using the appropriate eigenvectors. The distribution of the scores for this collection of data points along an axis will represent the variation in habitat combinations defined by it. This distribution is then assessed by dividing the scores into consecutive bins of an appropriate size and a frequency distribution is calculated for each axis. The shape of this distribution provides an estimate of all available combinations of habitat variables to which the survey data set can be compared.
The process for calculating a habitat representativeness score (HRS) for a specific survey area and survey design or coverage (assuming that principal component analysis (PCA) is being used as the multi-variate statistical technique).

The second stage involves estimating which habitat combinations will be surveyed by a given survey design (or were sampled during an actual survey if the test is conducted post hoc—right hand side of Figure 1). Individual points are placed at regular intervals along the proposed or actual survey track. The spacing of these points will be determined by the scale at which the species distribution is related to the habitat variables or the resolution at which these relationships are being modelled. A value for each habitat variable at each point is then extracted. These values are then standardized using the mean and standard deviation values calculated for the large number of random data points covering the study area (see above). Finally, scores for each axis are calculated for each surveyed data point using the eigenvectors for each variable from the PCA. A frequency distribution is then calculated from these scores and the absolute difference in the frequency of occurrence of scores for the two data sets within each bin is summed for each axis. This produces an HRS that can theoretically range from zero to two, with the former representing data sets that have identical frequency distribution of their scores for an axis and the latter representing data sets that have completely non-overlapping distributions (which is unlikely since both data sets come from the same area). On this scale, the lower the HRS, the more similar the data obtained from a specific survey design are to the study area as a whole. The HRS for each axis can be treated individually (e.g. since the first axis represents the most variation in the data, its HRS is likely to represent the most important variations between a sample and the study area as a whole), or the HRSs for each individual axis can be combined (e.g. by summing them after weighting them by the inverse of the eigenvalues of each PC axis) to produce a single overall HRS score representing all the variation between the sampled data and that available in the study site in terms of the habitat variables being examined.
How many of the evenly-spaced north–south parallel survey transects are required to representatively sample two study areas with differing levels of habitat heterogeneity?
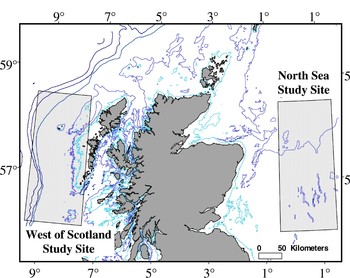
To demonstrate the application of the HRS concept, an analysis was conducted to identify the minimum number of evenly-spaced parallel north–south transect surveys required to collect a representative sample of data in relation to all possible combinations of four specific habitat variables in two hypothetical study areas of identical size. One study area was located in the North Sea, bounded by 56°N and 58.5°N latitude and 0.5°E and 1.5°W longitude. The second was positioned to the west of Scotland in an area bounded by 56°N and 58.5°N latitude and 9.5°E and 7.5°E longitude (Figure 2). While the former area only covered non-coastal shelf habitat varying in depth between ~70 m and ~180 m, the latter included coastal shelf habitat, non-coastal shelf habitat, shelf edge habitat and deep oceanic waters, with depths varying from zero to ~1700 m. As a result, the west of Scotland site is more heterogeneous in terms of available habitat combinations than the North Sea study site. The variables used in this study were chosen based on their known association with the distribution of a variety of marine species (e.g. Perry & Smith, Reference Perry and Smith1994; Bräger et al., Reference Bräger, Harraway and Manly2003; MacLeod et al., Reference MacLeod, Weir, Pierpoint and Harland2007—see below for a consideration of the issue of not including important habitat variables in the assessment and modelling process). These were water depth, seabed gradient, the distance from the nearest land and sea surface temperature. The first three variables were derived from the British Geological Society Digbath 250 m resolution data set, while sea surface temperature (SST) data were based on the July 2005 Modis Aqua satellite 4 km2 resolution monthly composite.
The west coast of Scotland (1) and North Sea (2) study areas used in analysis. Depth contours shown are 50 m, 100 m, 200 m, 500 m, 1000 m, 2000 m and 3000 m.

For each study area, 1000 locations were randomly generated using the random number function in Microsoft Excel and plotted using ESRI ARCview 3.3 geographical information system software. The values for water depth, seabed gradient, distance from coast and SST were extracted for each location and the data were processed as outlined above to produce a frequency distribution with a bin size of 0.5 for each principal component axis. To verify that 1000 random locations were sufficient to provide a consistent estimate of all available habitat combinations within each study area, these 1000 data points were compared to 10 additional sets of 1000 points and the HRSs calculated for each PC axis. If 1000 points do provide a consistent estimate of all available habitat combinations, the HRS for each comparison between data sets should be relatively low and consistent.
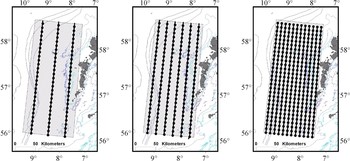
Twelve sets of survey data were then plotted for each study area. These sets consisted of between one and 12 evenly-spaced parallel north–south transects. For the survey data set consisting of the single transect, this consisted of a survey track through the centre of the study area from bottom to top. For all other data sets, the track spacing was calculated by dividing the width of the survey area by the number of survey transects. The first transect was then positioned at half this value from the left-hand edge of the study area, with each additional transect being spaced from it neighbour by the full value. For all 12 possible survey designs, a point was calculated every 10 km along the proposed survey transect lines and the values for the four habitat variables being examined were extracted (Figure 3). This sampling resolution was chosen purely to demonstrate the HRS concept and different sampling resolutions may be required for different studies (see below).
Examples of coverage for three, six and twelve evenly spaced parallel north–south survey transects. Black lines, survey tracks; black dots, sampling points along the tracks; light grey shading, study area; dark grey, land. Depth contours shown are 50 m, 100 m, 200 m, 500 m, 1000 m, 2000 m and 3000 m.

An HRS was then calculated using a PCA (see above) and compared to assess the minimum number of evenly-spaced parallel survey transects required to provide a representative coverage of the two study areas. This minimum number can be identified as the point at which the HRS value stabilizes at a relatively consistent low value. This can be assessed by running a trend line through a graph of the HRS plotted against the number of transects. Data points are then removed from the data set, starting with the surveys with the lowest amount of spatial coverage until the trend line lies below a specific threshold (such as 0.15—see below). While all four principal component axes were used in the first comparison, only the first PC axis was used for the second comparison as this was found to be representative of the remaining axes and accounted for the highest proportion of the variation in the data.
RESULTS
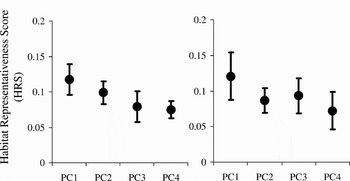
For the North Sea study area, the first principal component axis for the 1000 randomly positioned data points accounted for 37.2% of the variation in the data, followed by 27.5%, 24.4% and 10.9% for the remaining three axes. For the west of Scotland study area, the first principal component axis for the 1000 randomly positioned data points accounted for 55.4% of the variation in the data, followed by 25.9%, 12.6% and 6.1% for the remaining three axes. When compared across the 10 sets of 1000 randomly positioned points, the 1000 points used in this study produced a consistent and low HRS for all four PC axes in both study areas (Figure 4). This confirms that 1000 randomly-placed data produce a relatively consistent, and therefore representative, estimate of all possible habitat combinations for these two study areas to which the representativeness of specific survey designs can be compared. However, as would be expected, there was greater variability in the HRSs for the more heterogeneous west of Scotland study site than the more homogeneous North Sea study site.
A comparison of the habitat representative score (HRS) for the 1000 randomly-placed points when compared with 10 other sets of 1000 randomly-placed points calculated using a principal component analysis. Values shown are mean and standard deviation HRS. The HRS were sufficiently consistent between the data sets to suggest 1000 randomly positioned data points are sufficient to capture available combinations of the four habitat variables being examined (Left: North sea study area; Right: west of Scotland study area).

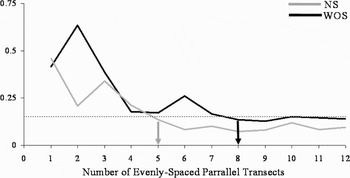
In both the North Sea and the west of Scotland study areas, increasing the number of evenly-spaced north–south parallel transects increased the representativeness of the survey coverage for the available combinations of the four variables examined (Figure 5). However, the increase in representativeness (i.e. lower HRS) with an increasing number of survey tracks only continues up to a certain point and beyond this a further increase does not necessarily result in more representative data being collected. This is represented by the point where the HRS reaches a relatively stable value regardless of the number of surveys. For the North Sea, this point was reached with five evenly-spaced parallel north–south surveys, while for the west of Scotland eight evenly-spaced parallel north–south transects would be required to obtain a representative coverage (Figure 5). Beyond this point, increasing survey effort would not result in an increase of the representativeness of the data for these study areas and the four variables examined.
A comparison of the habitat representativeness score (HRS) for surveys consisting of between one and 12 evenly-spaced parallel north–south transect lines in the two study areas calculated using a principal component analysis. The minimum number of survey tracks required to provide a representative sample of all available habitat combinations can be identified by the point where the HRS stabilizes at a relatively consistent value as the number of survey tracks increases (marked by arrows). NS, North Sea; WOS, west of Scotland.

DISCUSSION
By calculating a habitat representativeness score (HRS), it is possible to objectively investigate how representative a specific survey design or track (planned or already conducted) is of all available combinations of multiple habitat variables of interest in a simple and straightforward manner. This, therefore, provides a formal, objective test of the representativeness of the data and allows a better assessment of whether the habitat preferences identified from a study are likely to be representative of a wider region. This, in turn, increases the confidence in any predicted spatial distributions created from the identified habitat preferences. This is particularly important when spatial models based on habitat preferences are to be used for assessing and/or mitigating possible human impacts on marine organisms, or when identifying essential habitats for conservation purposes (e.g. Guisan & Thuiller, Reference Guisan and Thuiller2005).
The HRS also allows various potential aspects of survey design to be investigated prior to conducting field studies to identify the most appropriate design and number of transects to be identified for a specific area. This could potentially save both time and money by identifying the minimum amount of survey effort required. In addition, it could help ensure that surveys that are conducted to collect data for habitat modelling purposes manage to collect a sufficiently representative set of data to achieve this aim. The findings of this study are consistent with those of Hirzel & Guisan (Reference Hirzel and Guisan2002) that larger sample sizes are better for modelling habitat suitability. As a result, spatial models based on data collected from a small amount of survey effort may not provide a good representation of a species distribution as the data are unlikely to be representative of all available habitat combinations. For the specific survey design outlined above, fewer survey tracks were required to produce a representative sample of the more homogeneous North Sea site than the more heterogeneous west of Scotland site. The objective nature of the HRS allows this difference in the survey effort required for the two areas to be quantified. In terms of the area surveyed within each study site, the number of north–south parallel surveys required to be representative of all available habitat combinations for this survey design approximates to around 5% of the study area for the North Sea and 9% in the more heterogeneous west of Scotland region.
However, a few potential issues should be noted when applying the HRS concept for assessing representativeness of data for modelling purposes. Firstly, the identified minimum levels of survey coverage are not absolute and other possible survey designs, such as parallel surveys running east–west through the study areas, zig-zag surveys though the study area or surveys running perpendicular to a topographic feature such as the shelf edge, are likely to result in different specific limits to the minimum survey coverage required to obtain representative data for each study area. In particular, for the purposes of being able to make direct comparison between the two study areas with different levels of habitat heterogeneity, this study used parallel north–south surveys in both study areas. This meant that the transects were perpendicular to the main topography of the study area in the North Sea and parallel in the west of Scotland study area. Undoubtedly, a better survey design for the latter study area would have been to have surveys running east–west perpendicular to the topography. However, as noted above, the purpose of this study was not to define the best survey design for each study area, but rather to demonstrate how the HRS can be used to assess representativeness of a specific survey design or coverage. Despite these issues, the general conclusion that more survey effort is required to collect a representative data set in more heterogeneous habitats is likely to hold. While it is intuitive that using too little survey data will not provide a representative survey coverage, without the use of a formal testing procedure, such as HRS, objectively identifying how much survey coverage is enough is very difficult. While not considered in this analysis, there is no reason why the HRS could not be used to compare survey designs to help to identify the most appropriate survey design for collecting representative data for habitat modelling for a specific study area. In particular, it could be used to identify the most efficient survey design from those which are available.
Secondly, the HRS concept only aids in determining the level of spatial coverage in order to obtain a representative sample for the variables which are included in the analysis. If these selected variables do not include those which are important in defining the niche a species occupies within a study area, even if the HRS suggests that the survey coverage is representative for the selected variables, any resulting habitat preferences of species distribution models are likely to be flawed. This issue highlights the importance of sensible variable choice when attempting to define the niche occupied by a species, especially for distribution modelling purposes, rather than reflecting a flaw in the HRS concept. As a result, the choice of habitat variables to be used in any specific modelling purpose is as important as ensuring that survey coverage for the variables chosen is representative of the available combinations.
Thirdly, an HRS can be calculated for any scale or resolution for an individual study area. However, if this scale or resolution is inappropriate for the relationship between the species being modelled and the environmental variables, even if the survey coverage is representative, any model produced may be flawed. Therefore, it is important to identify the appropriate scale or resolution to conduct a specific study. This will also help determine how closely-spaced the points used to create the HRS along the survey transect should be placed to ensure that they are adequately positioned. A similar situation arises with the scale or resolution of the habitat variables. If these variables are not sampled at a resolution appropriate to the specific species being examined, adequately sampling them will not necessarily ensure that an accurate distribution model is obtained.
Fourthy, once it has been assessed whether the survey coverage is representative of the available combinations of habitat variables, the rarity and/or detectability of a species may play a role in how much survey effort must be invested within the representative survey coverage in order that a sufficient sample size is obtained to ensure that an accurate understanding of habitat preferences and/or the species distribution model can be obtained. That is, the HRS can help determine where to go, while species rarity and detectability may play a role in determining how often to go there. Again, this is an additional issue which needs to be addressed with regards to ensuring that data collection methods are sufficient to accurately define the niche that a species occupies rather than representing an issue with the usefulness of HRSs.
Fifthly, in terms of applying HRS to investigating the representativeness of specific survey designs, for some potential survey designs, the total survey effort is stratified into separate survey blocks based on aspects such as species density. In such cases, if the survey coverage of each survey block is determined separately from the coverage in other survey blocks, then separate HRSs should be applied to each block. If, however, this is not the case and survey coverage is determined across all survey blocks, a single HRS could be applied.
Finally, while 1000 randomly-placed points were used to assess the available habitat combinations for the four variables of interest in this study for each area, larger areas, finer resolution studies, a greater number of habitat variables and/or areas with greater heterogeneity may require a larger set of randomly placed points to accurately estimate the available habitat combinations. However, given the wide availability of relatively fast personal computers and the increasingly widespread use of GIS software, using much larger sets of randomly-placed points would not necessarily be prohibitive in terms of processing power or time, and sets of up to several hundred thousand or more randomly-placed points could probably be processed relatively easily and quickly.
In the current study, a relatively stable, low HRS as the number of transects increased was reached at or below about 0.15. Similarly, when the habitat sampled by the 1000 randomly positioned points was compared to 10 other such data sets, the average HRS values were around 0.12 for the first principal component axis and below 0.10 for all other axes, and all HRS values were close to or below 0.15. This suggests that this figure may be a useful indicator of whether a sample is sufficiently representative of the available habitat combinations within a study area. However, further research using a variety of survey patterns and in many different areas is required to assess whether this value is really a useful threshold that has widespread applicability or whether it is unique to the study areas, survey design and the multi-variate technique used in this study.
While this study concentrated on the use of HRS during the survey planning stage to assess the minimum number of transects required to provide a representative sample of all available habitat combinations for a specific survey design, it is also possible to apply HRS in a post-hoc manner to assess how widely the results of a survey are applicable to the surrounding area. This may be particularly useful in the marine environment where survey coverage is often interrupted by external factors, such as poor weather or equipment failure meaning that even with the best planning the ideal survey coverage may not actually be achieved. Similarly, HRS may be useful when collecting data on a particular species is not the main focus of a research cruise and the survey coverage is not designed specifically for that purpose. If the HRS of the data is sufficiently low to indicate that they are representative of the surrounding area, then such data can be used to identify absolute habitat preferences and even model the spatial distribution of a species. However, if the HRS is relatively high, while the data can still be used to examine habitat preferences within the locations surveyed, or compare the habitat preferences between species for the surveyed area, it may be inappropriate to use the data to infer habitat preferences throughout a region or use the data to construct predictive spatial models to be applied across a wider area.
Similarly, while not specifically examined in this study, a comparison of the HRS scores between the randomly-placed points and those obtained from the surveys can be used to provide information on which combinations of habitat variables have not been adequately sampled. Specifically, by examining the eigenvectors, it is possible to identify how each variable contributes to each PC axis. Therefore, by examining where the frequency distributions of the survey data set and the randomly placed data set differ along each PC axis, the eigenvectors for each variable can then be used to infer which ranges and combinations of the variables have not been adequately sampled.
In this study, the HRS was calculated based on a principle component analysis (PCA). However, the use of a PCA for this purpose may have some limitations. Specifically, PCAs are fundamentally linear statistics that assume that the variations between variables are related in a linear manner along individual PC axes. This may not always be the case and may cause biases when individual PC axes are used to assess representativeness. However, in some cases, using multiple PC axes to calculate the HRSs (rather than a single one as applied above) may minimize this bias by allowing for non-linear relationships between the values of different variables to be approximated. Similarly, PCA assumes that the variables are continuous and that the variation in the data has normal distribution around the PCA axis. If this is not the case, other multi-variate techniques such as non-metric multi-dimensional scaling (NMS), can potentially be used in place of a PCA to calculate the HRS using a similar procedure to that outlined above.
There is one important limiting factor to the HRS approach proposed in this paper. This is that the distribution of values for each variable across the whole study area must be known either in advance or after the survey. While it may be possible to obtain such data from existing data sets (e.g. for topography) or using remote sensing (e.g. for sea surface temperature), this may not be possible for some variables which must be sampled in the field (e.g. temperature at depth). Therefore, given the variables of interest under a specific circumstance, it may not always be possible to apply this approach for assessing the representativeness of survey coverage. However, this does not reduce its usefulness under circumstances when area-wide data are available to allow an HRS to be calculated.
Therefore, while it may require further development, particularly when being applied to specific circumstances, the concept of the HRS is likely to prove useful in providing an objective measure of representativeness for data which are to be used for examining habitat preferences and/or species distribution modelling. As a result, it will help put survey design for such studies on a firmer footing and will hopefully contribute to the rapidly-developing field of predicting species distribution from the environmental variables. In particular, it will help ensure that these models are based on sufficiently representative data to ensure that they are not biased towards over- or under-estimating actual distribution. This is especially important if conservation decisions are to be based on such models as such errors may lead to poor or damaging management decisions.
ACKNOWLEDGEMENTS
This study was developed as part of a programme investigating habitat modelling in cetaceans for conservation and management purposes and would not have been conducted without the input from various students working within this programme. In addition, the author would like to thank the anonymous referees for their constructive comments on this manuscript.