





Impact statement
This study contributes to biodesign by reframing photosynthetic biomineralisation as an interconnected biofabrication process rather than a single material technique. Its value lies in helping biodesigners and material researchers make more informed decisions when selecting, adapting and developing such workflows according to different design priorities. This research lays the groundwork for applying photosynthetic biomineralisation to circular product design and exploring its wider potential within a circular bioeconomy.
Introduction
Human activities have significantly intensified global environmental change, contributing to the transgression of several planetary boundaries, including climate change, biosphere integrity, biogeochemical flows and land-system change (Steffen et al. Reference Steffen, Richardson, Rockström, Cornell, Fetzer, Bennett, Biggs, Carpenter, de Vries, de Wit, Folke, Gerten, Heinke, Mace, Persson, Ramanathan, Reyers and Sörlin2015). These interrelated crises are closely rooted in a linear, fossil-based economy (Hetemäki et al. Reference Hetemäki, Hanewinkel, Muys, Ollikainen, Palahí, Trasobares and Forest Institute2017), in which finite resources are extracted, converted into products, consumed and ultimately discarded as waste (Ellen MacArthur Foundation 2023). A transition towards a circular economy, where the value of products, materials and resources is retained for as long as possible, is crucial to developing a sustainable, low-carbon and resource-efficient economy (European Commission 2015). Circular economy approaches are increasingly discussed alongside the bioeconomy, defined by the production of renewable biological resources and the transformation of both biological resources and waste streams into value-added products (European Commission 2012). The convergence of these two concepts has led to the circular bioeconomy, promoting the sustainable and resource-efficient valorisation of biological resources within integrated production systems while enhancing the value of residues and waste streams (Stegmann et al. Reference Stegmann, Londo and Junginger2020).
Design plays a crucial role in this transformation, as designers are embedded in economic models and production systems, and their decisions shape supply chains (Collet Reference Collet, Nimkulrat, Ræbild and Piper2018). Increasingly, the role of the designer is evolving from that of a passive recipient of developed materials to an active maker of new material possibilities (Camere and Karana Reference Camere and Karana2018; Karana et al. Reference Karana, Barati, Rognoli and van der Laan2015). In this paradigm, biodesign has emerged as a new discipline at the intersection of biology and design, where materials are biofabricated by living organisms (Myers Reference Myers2012). Biofabricated materials hold potential for a circular bioeconomy, with their value lying not only in their organic origin but also in organisms’ capacity to metabolise waste streams into resource inputs through biological processes (Builes Vélez et al. Reference Builes Vélez, Builes Escobar, Rossi, Mattram, Stocker, Rognoli, Parisi, Pollini, Taranto, Amaya-García, Treidl, Suárez-Vásquez, Restrepo-Jaramillo, Pérez-Orrego, Martínez Marín, Osorio-Florez, Bustamante, Jimenez, Baena Restrepo, Baquero Álvarez, Velásquez Posado, Agudelo Gutiérrez, Canal Gallego, Marzola, Peláez Rojas, Pérez Ramírez, Vásquez-Rendón, Mesa Betancur and Vélez Santamaría2022).
In this context, biomineralisation, a biological process in which living organisms produce inorganic materials, can offer a promising pathway to create value within the circular bioeconomy (Shin et al. Reference Shin, Archer, Malpass and Collet2026). It has increasingly gained attention as a sustainable approach to converting waste resources into valuable applications (Fouladi et al. Reference Fouladi, Arulrajah, Chu and Horpibulsuk2023; Tian et al. Reference Tian, Zhou, Bai, Song, Tang, Xiu and Xue2025). However, existing research focuses on engineering applications, and its integration into design research remains underexplored (Arnardottir Reference Arnardottir2024; Mosse et al. Reference Mosse, Rennie, Poudoulec and Suárez Zamora2024).
Biomineralisation
Biomineralisation is a widespread phenomenon in nature, resulting in the formation of biominerals in diverse forms, such as shells, bones and rocks (Dhami et al. Reference Dhami, Reddy and Mukherjee2013). Biomineralisation processes are classified into two categories: biologically controlled mineralisation and biologically induced mineralisation (Lowenstam Reference Lowenstam1981; Lowenstam and Weiner Reference Lowenstam and Weiner1989). In biologically controlled mineralisation, biominerals are directly produced by living organisms at a specific location under certain conditions (Anbu et al. Reference Anbu, Kang, Shin and So2016). During this process, organisms control composition, phase, morphology, nucleation, growth and localisation (Beatty et al. Reference Beatty, Williams and Srubar2022; Castro-Alonso et al. Reference Castro-Alonso, Montañez-Hernandez, Sanchez-Muñoz, Macias Franco, Narayanasamy and Balagurusamy2019). In contrast, biologically induced mineralisation occurs indirectly, when the metabolic activity of organisms causes chemical modifications to the environment, resulting in precipitation of biominerals (Phillips et al. Reference Phillips, Gerlach, Lauchnor, Mitchell, Cunningham and Spangler2013). In this case, biominerals can be precipitated not only on the surface of cells but also on nearby organic or inorganic materials (Beatty et al. Reference Beatty, Williams and Srubar2022).
Across both mechanisms, a wide range of minerals can be formed, including carbonates, phosphates, metal sulphates and silicates (Beatty et al. Reference Beatty, Williams and Srubar2022). Among these, calcium carbonate minerals (CaCO3) are the most abundant biominerals in nature, both in terms of the volumes produced and their broad distribution across biological taxa (Lowenstam and Weiner Reference Lowenstam and Weiner1989). Biologically induced mineralisation of CaCO3 is commonly referred to as microbially induced calcite precipitation (MICP). MICP has been applied across biotechnological and environmental engineering contexts, including ground improvement, bioconcrete, bioremediation of metals and CO2 bio-sequestration (Achal et al. Reference Achal, Mukherjee and Reddy2011; DeJong et al. Reference DeJong, Fritzges and Nüsslein2006; Jonkers et al. Reference Jonkers, Thijssen, Muyzer, Copuroglu and Schlangen2010; Yadav et al. Reference Yadav, Krishnamurthi, Shekh, Mudliar, Devi and Chakrabarti2014).
MICP can occur via various metabolic pathways, including urea hydrolysis, photosynthesis, sulphate reduction, ammonification of amino acids and denitrification (Castro-Alonso et al. Reference Castro-Alonso, Montañez-Hernandez, Sanchez-Muñoz, Macias Franco, Narayanasamy and Balagurusamy2019). Urea hydrolysis pathways have dominated MICP research as they can produce relatively efficient and controllable calcium carbonate precipitation (Castro-Alonso et al. Reference Castro-Alonso, Montañez-Hernandez, Sanchez-Muñoz, Macias Franco, Narayanasamy and Balagurusamy2019). However, this route produces ammonia as a by-product, raising environmental concerns, such as toxic effects on living organisms and increased atmospheric nitrogen deposition, which contribute to eutrophication and acidification (Dhami et al. Reference Dhami, Reddy and Mukherjee2013). As an alternative, photosynthetic biomineralisation using cyanobacteria has gained interest in recent years due to its ambient operating conditions and carbon-capture potential during growth and mineralisation (Beatty et al. Reference Beatty, Williams and Srubar2022; Heveran et al. Reference Heveran, Williams, Qiu, Artier, Hubler, Cook, Cameron and Srubar2020; Reinhardt et al. Reference Reinhardt, Ihmann, Ahlhelm and Gelinsky2023; Sidhu et al. Reference Sidhu, Goyal and Reddy2022).
Photosynthetic biomineralisation by cyanobacteria
Photosynthetic biomineralisation is mainly mediated by cyanobacteria, among Earth’s earliest biomineralising life forms. Cyanobacteria are widespread microorganisms found across diverse ecological environments, from marine, freshwater, saline and terrestrial habitats to extreme and symbiotic systems (Badger et al. Reference Badger, Price, Long and Woodger2006). These robust prokaryotes played a critical role in shaping the planet’s early atmosphere, enabling the emergence of aerobic and complex life (Dismukes et al. Reference Dismukes, Klimov, Baranov, Kozlov, DasGupta and Tyryshkin2001).
Their ecological significance lies in their capacity to perform photosynthesis, by which light energy is converted into chemical energy and CO2 is assimilated into organic compounds (Kamennaya et al. Reference Kamennaya, Ajo-Franklin, Northen and Jansson2012). Beyond this, cyanobacteria contribute to another carbon fixation pathway through biomineralisation. Under light exposure, their metabolic activity can alter local chemical conditions by taking up dissolved inorganic carbon and raising pH, thereby supporting the precipitation of CaCO3 (Riding Reference Riding2006).
Biofabrication approaches utilising photosynthetic biomineralisation
Recent studies have introduced new fabrication strategies that apply photosynthetic biomineralisation to material development (Armaly et al. Reference Armaly, Iliassafov, Kirzner, Kashi and Barath2023; Heveran et al. Reference Heveran, Williams, Qiu, Artier, Hubler, Cook, Cameron and Srubar2020; Reinhardt et al. Reference Reinhardt, Ihmann, Ahlhelm and Gelinsky2023; Sidhu et al. Reference Sidhu, Goyal and Reddy2022).
Heveran et al. (Reference Heveran, Williams, Qiu, Artier, Hubler, Cook, Cameron and Srubar2020) introduced the concept of living building materials (LBM) by incorporating Synechococcus sp. PCC 7002 into a sand-hydrogel scaffold using gel casting, demonstrating enhanced mechanical performance through photosynthetic biomineralisation. In their study, gelatine was selected as the hydrogel matrix because its melting temperature (37 °C) supports bacterial viability, while physical crosslinking during dehydration increases the structural strength of the resulting material (Heveran et al. Reference Heveran, Williams, Qiu, Artier, Hubler, Cook, Cameron and Srubar2020). The gelatine-based hydrogels therefore functioned both as a structural support for cells and as binders within the sand scaffold. Subsequent studies have adopted this protocol, employing gelatine as a binder (Delesky et al. Reference Delesky, Jones, Cook, Cameron, Hubler and Srubar2023; Jang et al. Reference Jang, Park, Son, Min, Park and Yi2023; Qiu et al. Reference Qiu, Artier, Cook, Srubar, Cameron and Hubler2021; Son et al. Reference Son, Min, Jang, Park, Yi and Park2024).
Sidhu et al. (Reference Sidhu, Goyal and Reddy2022) demonstrated sand consolidation without hydrogel binders by supplying a liquid mineralisation medium containing Synechocystis pevalekii BDHKU 35101 to sand columns for 14 days. The observed CaCO3 precipitation suggested that structural consolidation can be achieved through biomineralisation without the use of binding agents. This liquid non-gel method allows direct interaction among cells, mineralisation media and sand particles.
Expanding the fabrication possibilities of LBM beyond gel casting, Reinhardt et al. (Reference Reinhardt, Ihmann, Ahlhelm and Gelinsky2023) integrated cyanobacterial biomineralisation with three-dimensional bioprinting. They employed hydrogel bioinks that consisted of alginate, methylcellulose, sea sand and Synechococcus sp. PCC 7002. After printing, the scaffolds were crosslinked and further cultured in mineralisation medium. In their study, calcium-crosslinked alginate hydrogels enabled cell immobilisation and form-giving.
Together, these studies demonstrate that photosynthetic biomineralisation can be used to develop new materials across different fabrication workflows. Heveran et al. (Reference Heveran, Williams, Qiu, Artier, Hubler, Cook, Cameron and Srubar2020), Sidhu et al. (Reference Sidhu, Goyal and Reddy2022) and Reinhardt et al. (Reference Reinhardt, Ihmann, Ahlhelm and Gelinsky2023) can be understood as representing three distinct fabrication methods: casting using a gelatine hydrogel, consolidating materials by supplying a liquid medium without a binder and culturing materials after alginate crosslinking. These workflows differ not only in binder composition but also in how cyanobacteria are supported or immobilised, how mineralisation media are supplied, how form is given and how materials are incubated. However, as these approaches have been developed separately and primarily within engineering contexts, their potential and limitations as material development routes for circular product design have not yet been fully explored. Therefore, this study compares these photosynthetic biomineralisation workflows to examine how their processual and material differences can inform circular product design beyond their original engineering applications.
Photosynthetic biomineralisation for circular product design
Photosynthetic biomineralisation is a relatively low-energy process that operates under ambient conditions using light and air, while also being a slow process that takes approximately two weeks. It therefore requires attention not only to final material performance, but also to how materials are formed, maintained, handled and developed over time. Product design provides a relevant context for examining these aspects, as it considers materials and fabrication processes not only in terms of technical performance, but also in relation to form, function, experience and user interaction. Exploring photosynthetic biomineralisation from a product design perspective can extend its potential beyond technical applications.
Design research has shown growing interest in biomineralisation to transform waste-derived resources into new materials, products and artefacts (Mosse et al. Reference Mosse, Rennie, Poudoulec and Suárez Zamora2024; Shin et al. Reference Shin, Archer, Malpass and Collet2026). However, photosynthetic biomineralisation has rarely been examined from a circular product design perspective, particularly regarding how different fabrication workflows shape material qualities, design opportunities and practical constraints. These differences may depend on how cells are supported, how binders or media are used, how form is given and how the resulting material is handled during the incubation period.
This study addresses this gap by comparing three representative photosynthetic biomineralisation workflows from a circular product design perspective. The workflows comprise (1) a gelatine-based hydrogel system; (2) a liquid non-gel system; and (3) an alginate-based hydrogel system. Hereafter, these are referred to as the gelatine system, non-gel system and alginate system, respectively. Each workflow was applied to a set of eleven waste-derived materials spanning the food, wood, paper, textile and ceramic categories, producing three material sample collections. These collections were used as design research artefacts to compare material outcomes generated by each workflow. The workflows and the resulting material outcomes were examined across five criteria: workflow feasibility, resource inputs, visible cyanobacterial retention, material qualities and preliminary biomineralisation indicators. Rather than identifying an optimal method, this study offers an observational analysis of the practical possibilities and limitations of each workflow.
This paper extends our previous work, which applied a non-gel photosynthetic biomineralisation protocol to eleven waste-derived substrates and qualitatively evaluated the resulting material sample collection for circular product design (Shin et al. Reference Shin, Archer, Malpass and Collet2026). Whereas the earlier work focused on substrate diversity within a single fabrication workflow, the present study broadens its scope to fabrication workflows themselves, comparing three representative biofabrication logics. It thereby shifts the focus from how waste-derived materials perform within a single workflow to how different workflows shape the possibilities for material development in circular product design.
The remainder of the paper is organised as follows. The paper begins by outlining the selection and preparation of the eleven waste-derived materials and detailing the three biofabrication workflows. It then presents the resulting material sample collections and analyses workflow trade-offs across workflow feasibility, resource inputs, visible cyanobacterial retention, material qualities and preliminary biomineralisation indicators. The paper concludes by discussing the implications for circular product design, acknowledging current limitations and outlining future directions for biological, mineralogical and design development.
Materials and methods
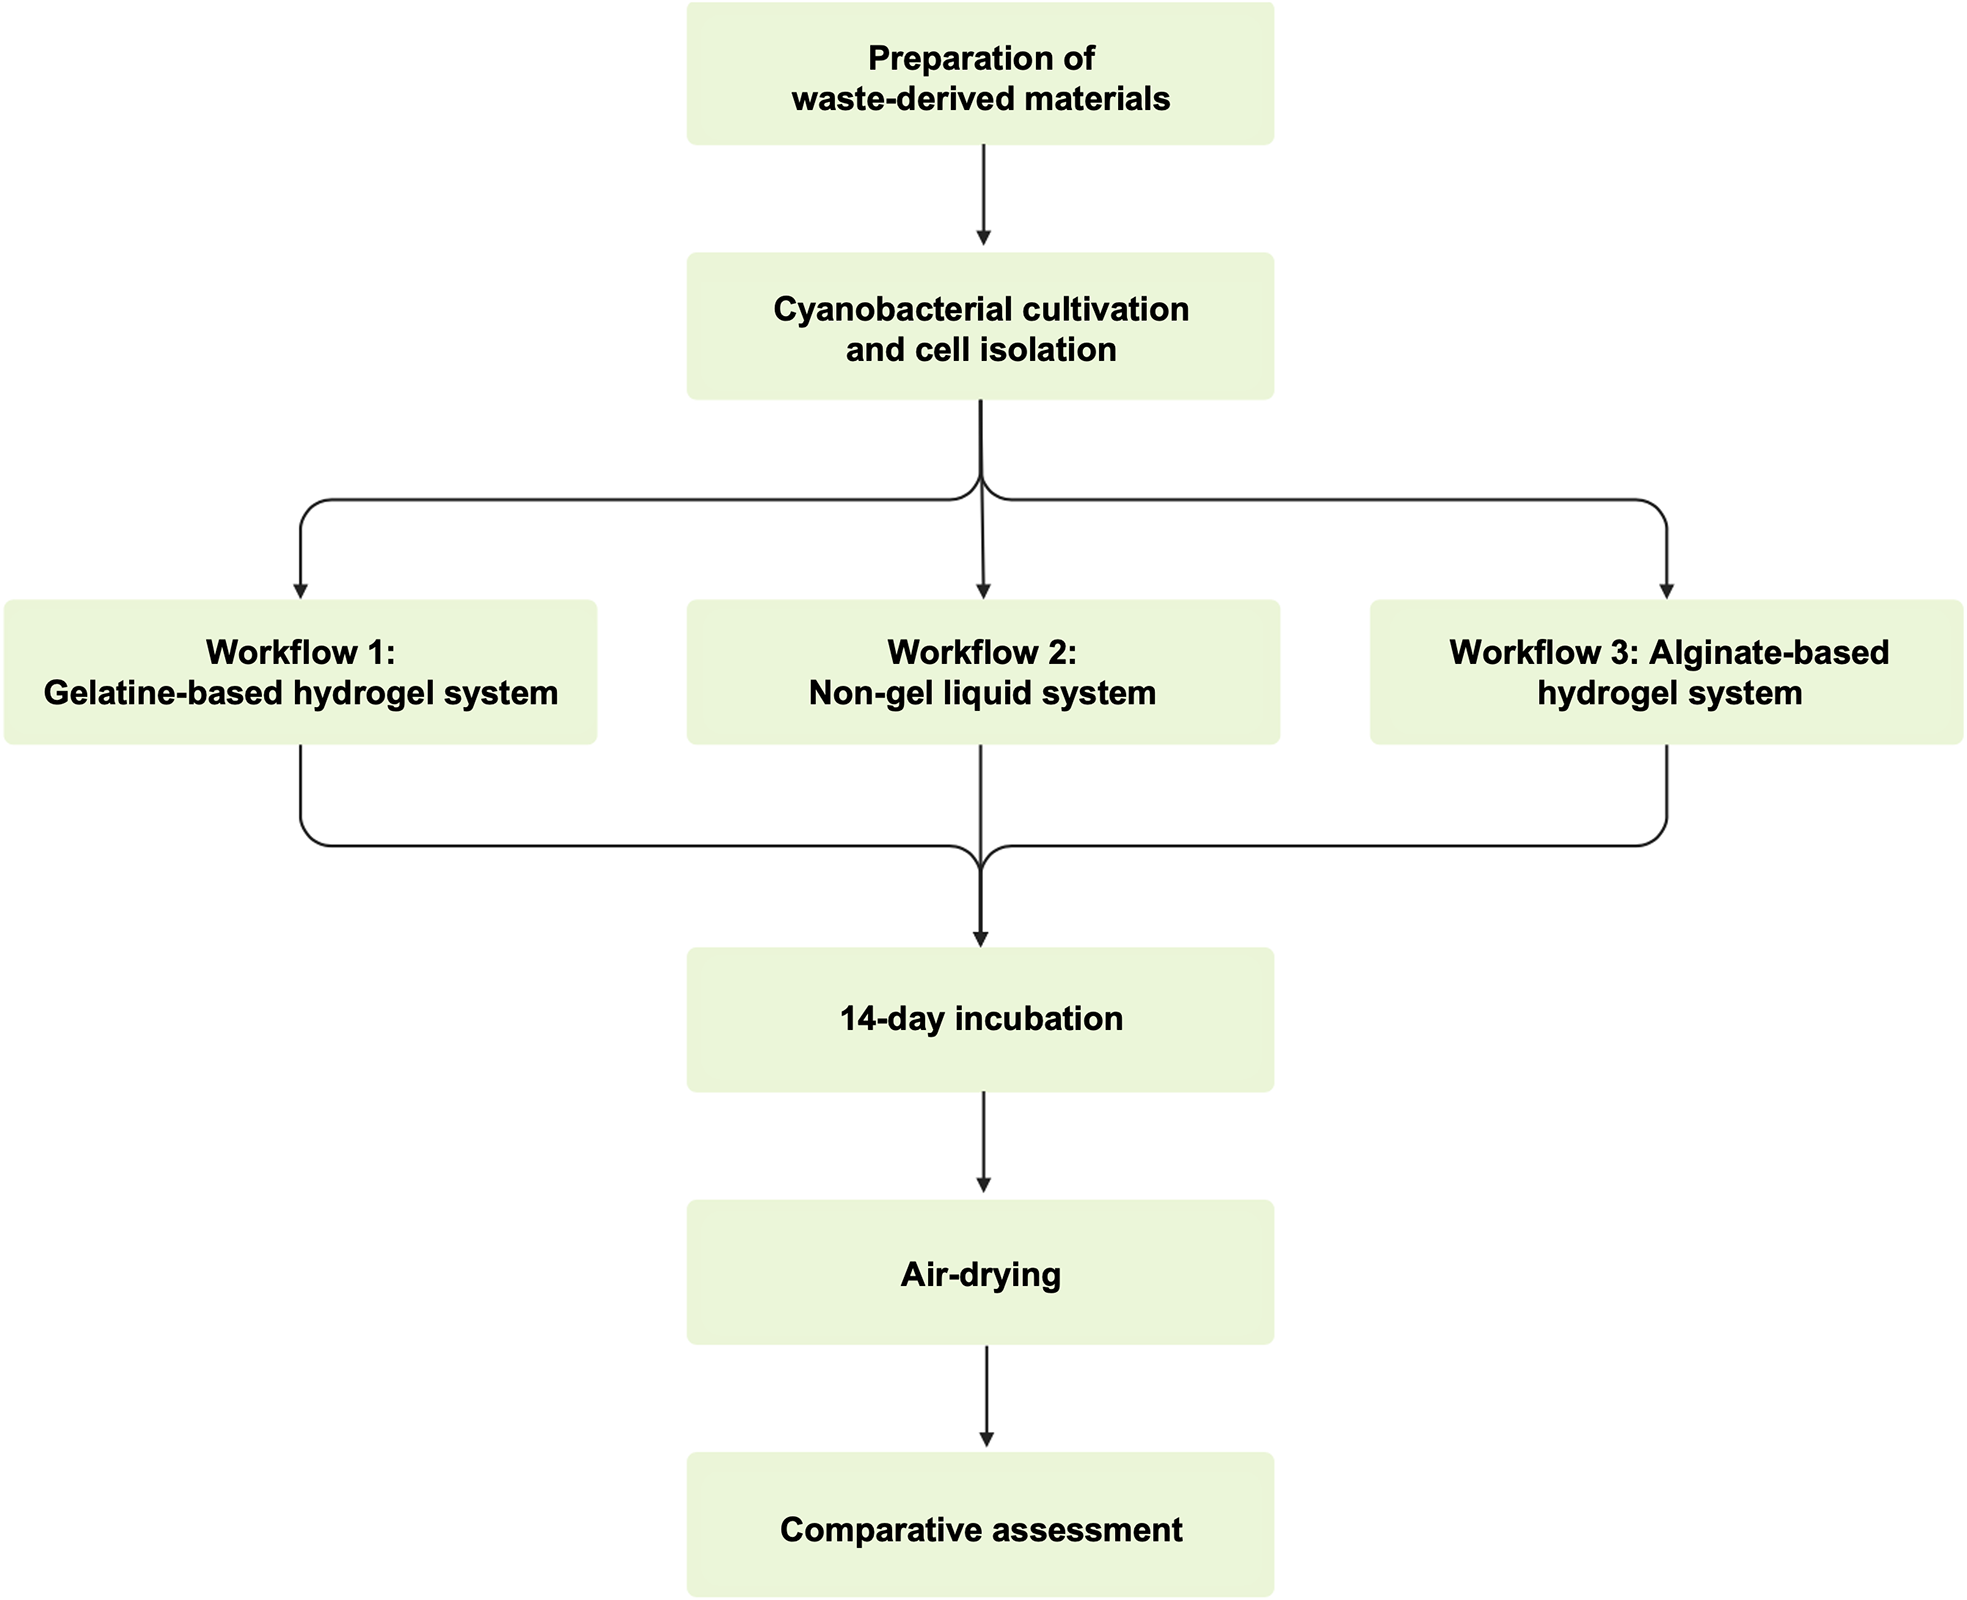
The experimental procedure began with the preparation of waste-derived materials, followed by cyanobacterial cultivation and cell isolation. The prepared materials and isolated cells were then combined through three biofabrication workflows: the gelatine system, the non-gel system and the alginate system. After fabrication, all samples underwent a 14-day incubation period under controlled light and humidity conditions, followed by air-drying and comparative assessment. The overall procedure is illustrated in Figure 1.
Overview of the experimental procedure, showing the preparation of waste-derived materials, cyanobacterial cultivation and cell isolation, application of the three biofabrication workflows, 14-day incubation, air-drying and comparative assessment.

Figure 1. Long description
The diagram summarises the study workflow. Waste-derived materials are prepared and combined with Synechococcus sp. PCC 7002 through three biofabrication routes: a gelatine-based hydrogel system, a liquid non-gel system, and an alginate-based hydrogel system. All samples are then incubated for 14 days under controlled light and humidity, air-dried, and assessed comparatively.
Waste-derived materials
Selection
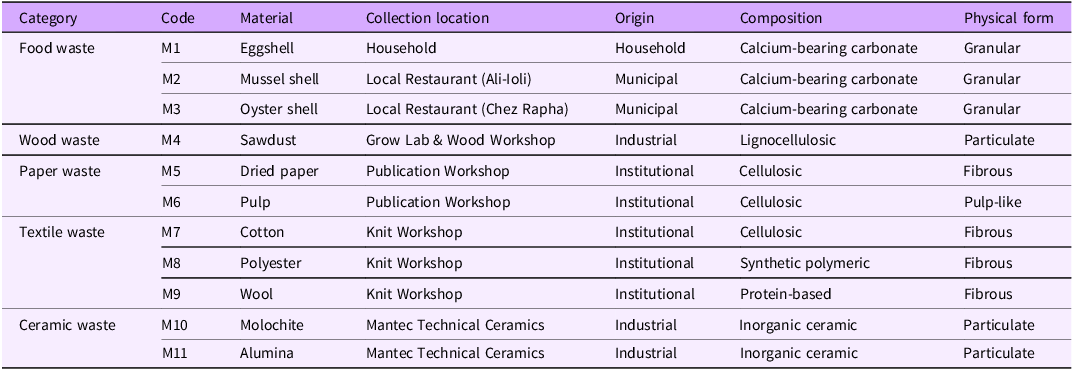
Eleven post-use, waste-derived materials were drawn from the material set previously reported by Shin et al. (Reference Shin, Archer, Malpass and Collet2026), which was selected for its availability, diversity and relevance to domestic and industrial waste streams. In the present study, this set of materials was used to compare how different material conditions interact with each biofabrication workflow. Compositionally, they included calcium-bearing carbonate, lignocellulosic, cellulosic, synthetic polymeric, protein-based and inorganic ceramic materials. Physically, they ranged from granular and particulate materials to fibrous and pulp-like forms. Each material was assigned a unique code (M1–M11), which is used consistently throughout the study. The materials were collected from a household, local restaurants, institutional workshops and an industrial supplier. Table 1 summarises their collection locations, origins, compositions and physical forms.
Waste-derived material set used in this study, adapted from Shin et al. (Reference Shin, Archer, Malpass and Collet2026), with collection location, origin, composition and physical form

Table 1. Long description
The table defines the material set M1–M11. Food waste includes M1 eggshell from a household, M2 mussel shell from Ali-Ioli restaurant, and M3 oyster shell from Chez Rapha; all are municipal or household calcium-bearing carbonate granules. Wood waste is M4 sawdust from the Grow Lab and Wood Workshop, an industrial lignocellulosic particulate. Paper waste includes M5 dried paper and M6 pulp from the Publication Workshop, both institutional cellulosic materials in fibrous or pulp-like form. Textile waste includes M7 cotton, M8 polyester, and M9 wool from the Knit Workshop, classified as cellulosic, synthetic polymeric, and protein-based fibres. Ceramic waste includes M10 molochite and M11 alumina from Mantec Technical Ceramics, both industrial inorganic ceramic particulates.
Processing
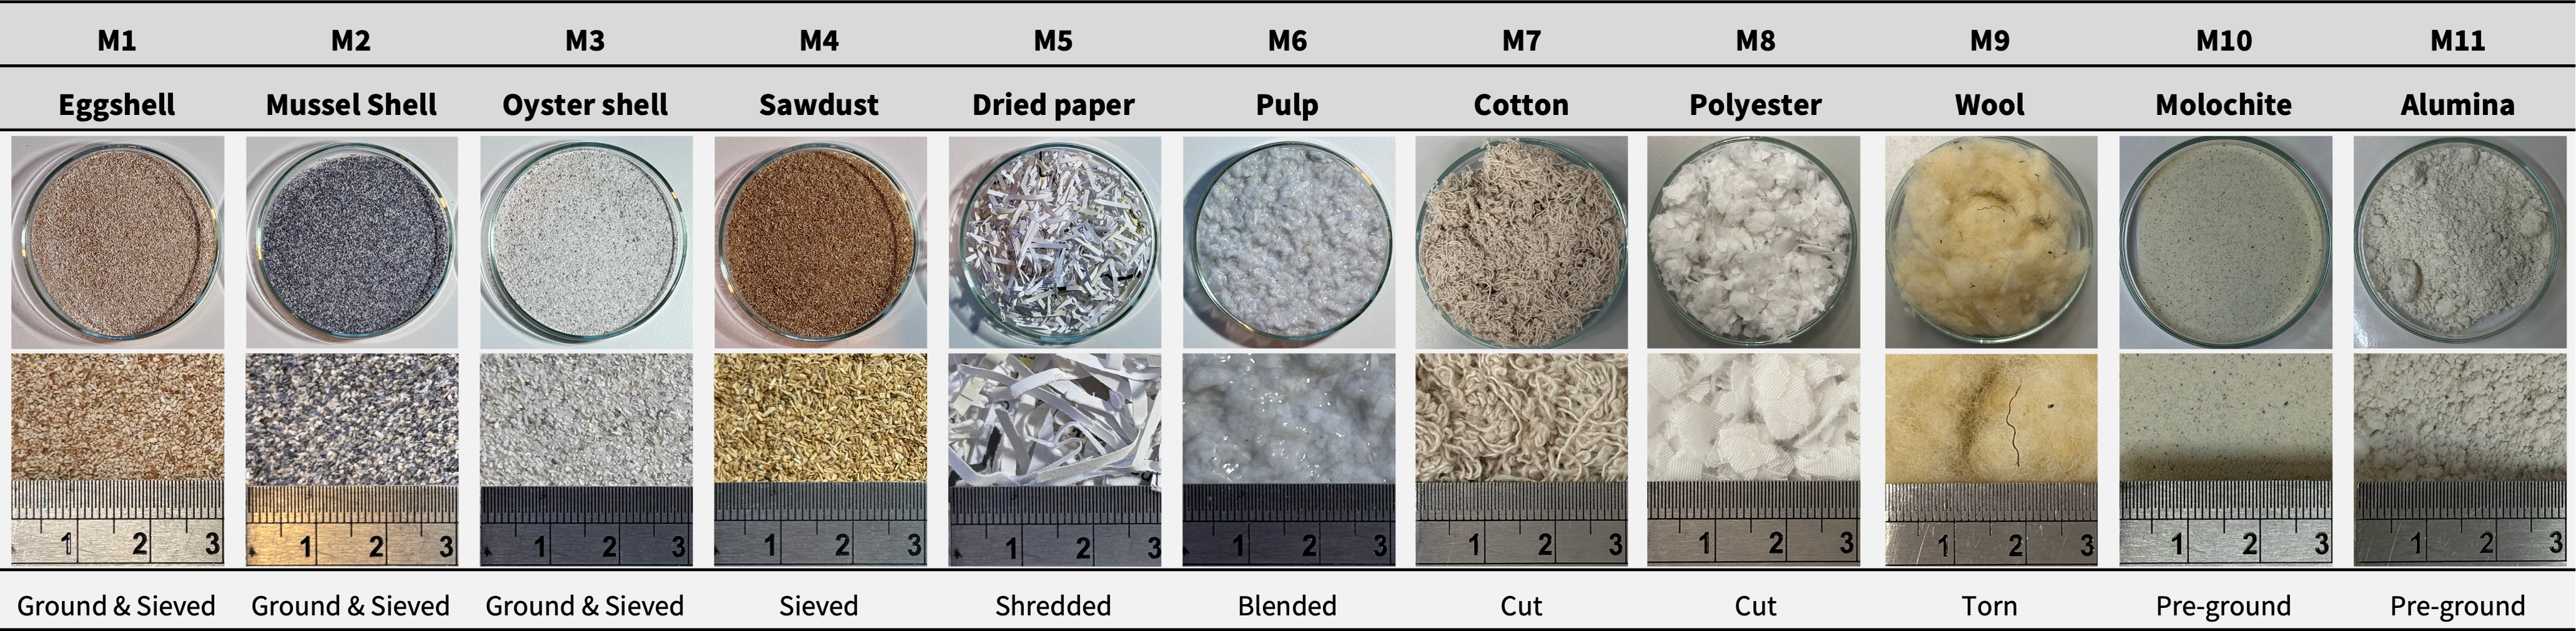
Waste materials were processed according to their material characteristics following the procedure previously reported in Shin et al. (Reference Shin, Archer, Malpass and Collet2026), with additional detail provided here. Food waste (M1–M3) was initially crushed to reduce bulk particle size, followed by further grinding with a mortar and pestle. Together with sawdust (M4), these granular materials were sieved to achieve a particle size of 0.251–0.500 mm. Paper waste was prepared in two ways: dried paper (M5) was shredded with a paper shredder, while pulp (M6) was produced by further blending wet paper using a kitchen blender. Textile waste (M7–M9) was processed manually using scissors or by hand. Ceramic waste (M10–M11) was supplied pre-ground by the manufacturer (Mantec Technical Ceramics) and was not further processed due to health and safety concerns associated with airborne fired ceramic dust. Figure 2 provides an overview of all eleven waste-derived materials (M1–M11), showing their processed material appearance, approximate scale and corresponding processing methods.
Processed material appearance, approximate scale and processing method of the eleven waste-derived materials (M1–M11).

Figure 2. Long description
The figure shows the processed appearance of the eleven materials used in the study. Shell materials and sawdust are shown as granular or particulate materials after crushing, grinding, and sieving. Paper materials appear as shredded dried paper and wet pulp. Textile materials appear as manually cut or separated fibres. Ceramic materials are shown as pre-ground molochite and alumina particulates. The figure links each material code to its approximate scale and processing method.
Composition
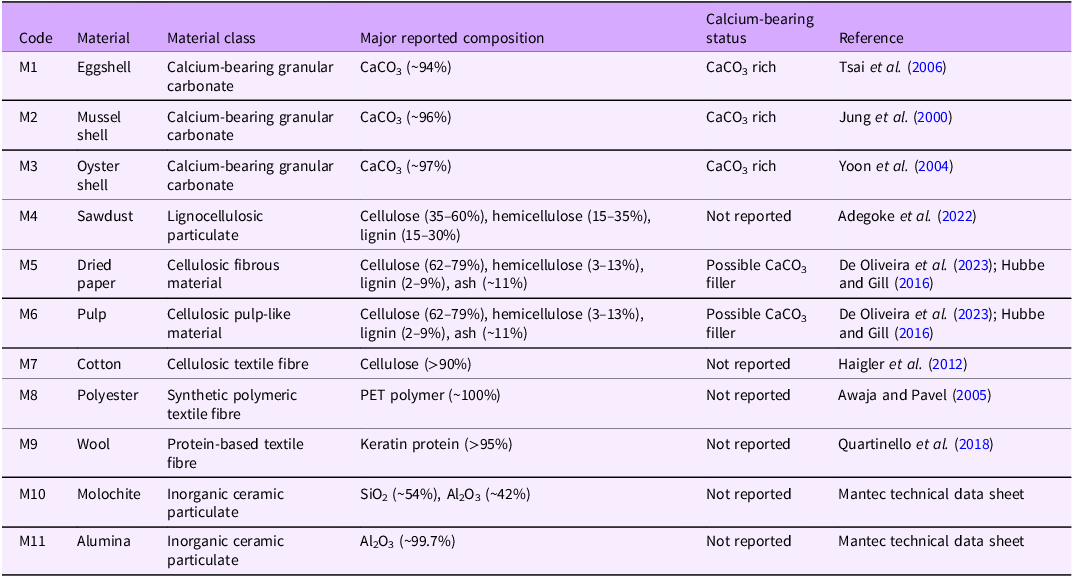
Based on the compositional and physical characteristics, the selected materials were assigned to material classes and further characterised according to their reported compositional characteristics and calcium-bearing status, as summarised in Table 2. Eggshell (M1), mussel shell (M2) and oyster shell (M3) were classified as calcium-bearing granular carbonate due to their predominant calcium carbonate composition. Sawdust (M4) was classified as a lignocellulosic particulate, while dried paper (M5) and pulp (M6) were classified as cellulosic fibrous and pulp-like material, respectively. Paper materials may also contain variable mineral fillers, such as calcium carbonate, depending on the production process. Cotton (M7) was classified as a cellulosic textile fibre, polyester (M8) as a synthetic polymeric textile fibre and wool (M9) as a protein-based textile fibre. Molochite (M10) and alumina (M11) were classified as inorganic ceramic particulates.
Material classes, major reported composition and calcium-bearing status of the selected waste-derived materials
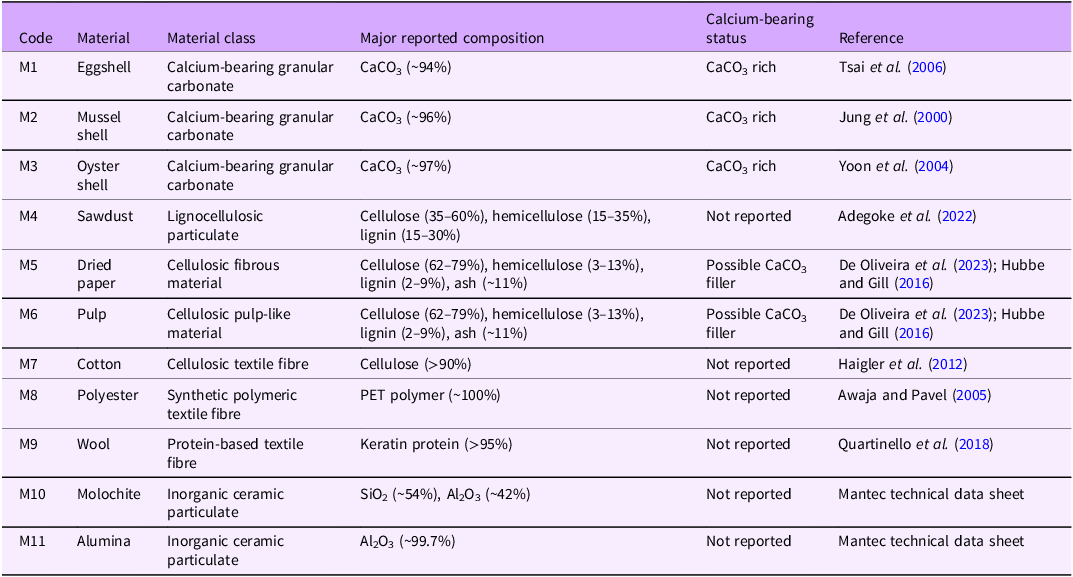
Table 2. Long description
The table reports compositional classifications for M1–M11. M1 eggshell, M2 mussel shell, and M3 oyster shell are calcium-bearing granular carbonates with reported CaCO3 contents of about 94%, 96%, and 97%. M4 sawdust is a lignocellulosic particulate containing cellulose, hemicellulose, and lignin. M5 dried paper and M6 pulp are cellulosic materials that may contain CaCO3 filler. M7 cotton is a cellulosic textile fibre; M8 polyester is a PET synthetic polymer fibre; M9 wool is a keratin protein fibre. M10 molochite is mainly SiO2 and Al2O3, and M11 alumina is mainly Al2O3. References are provided for each material composition.
Mould design
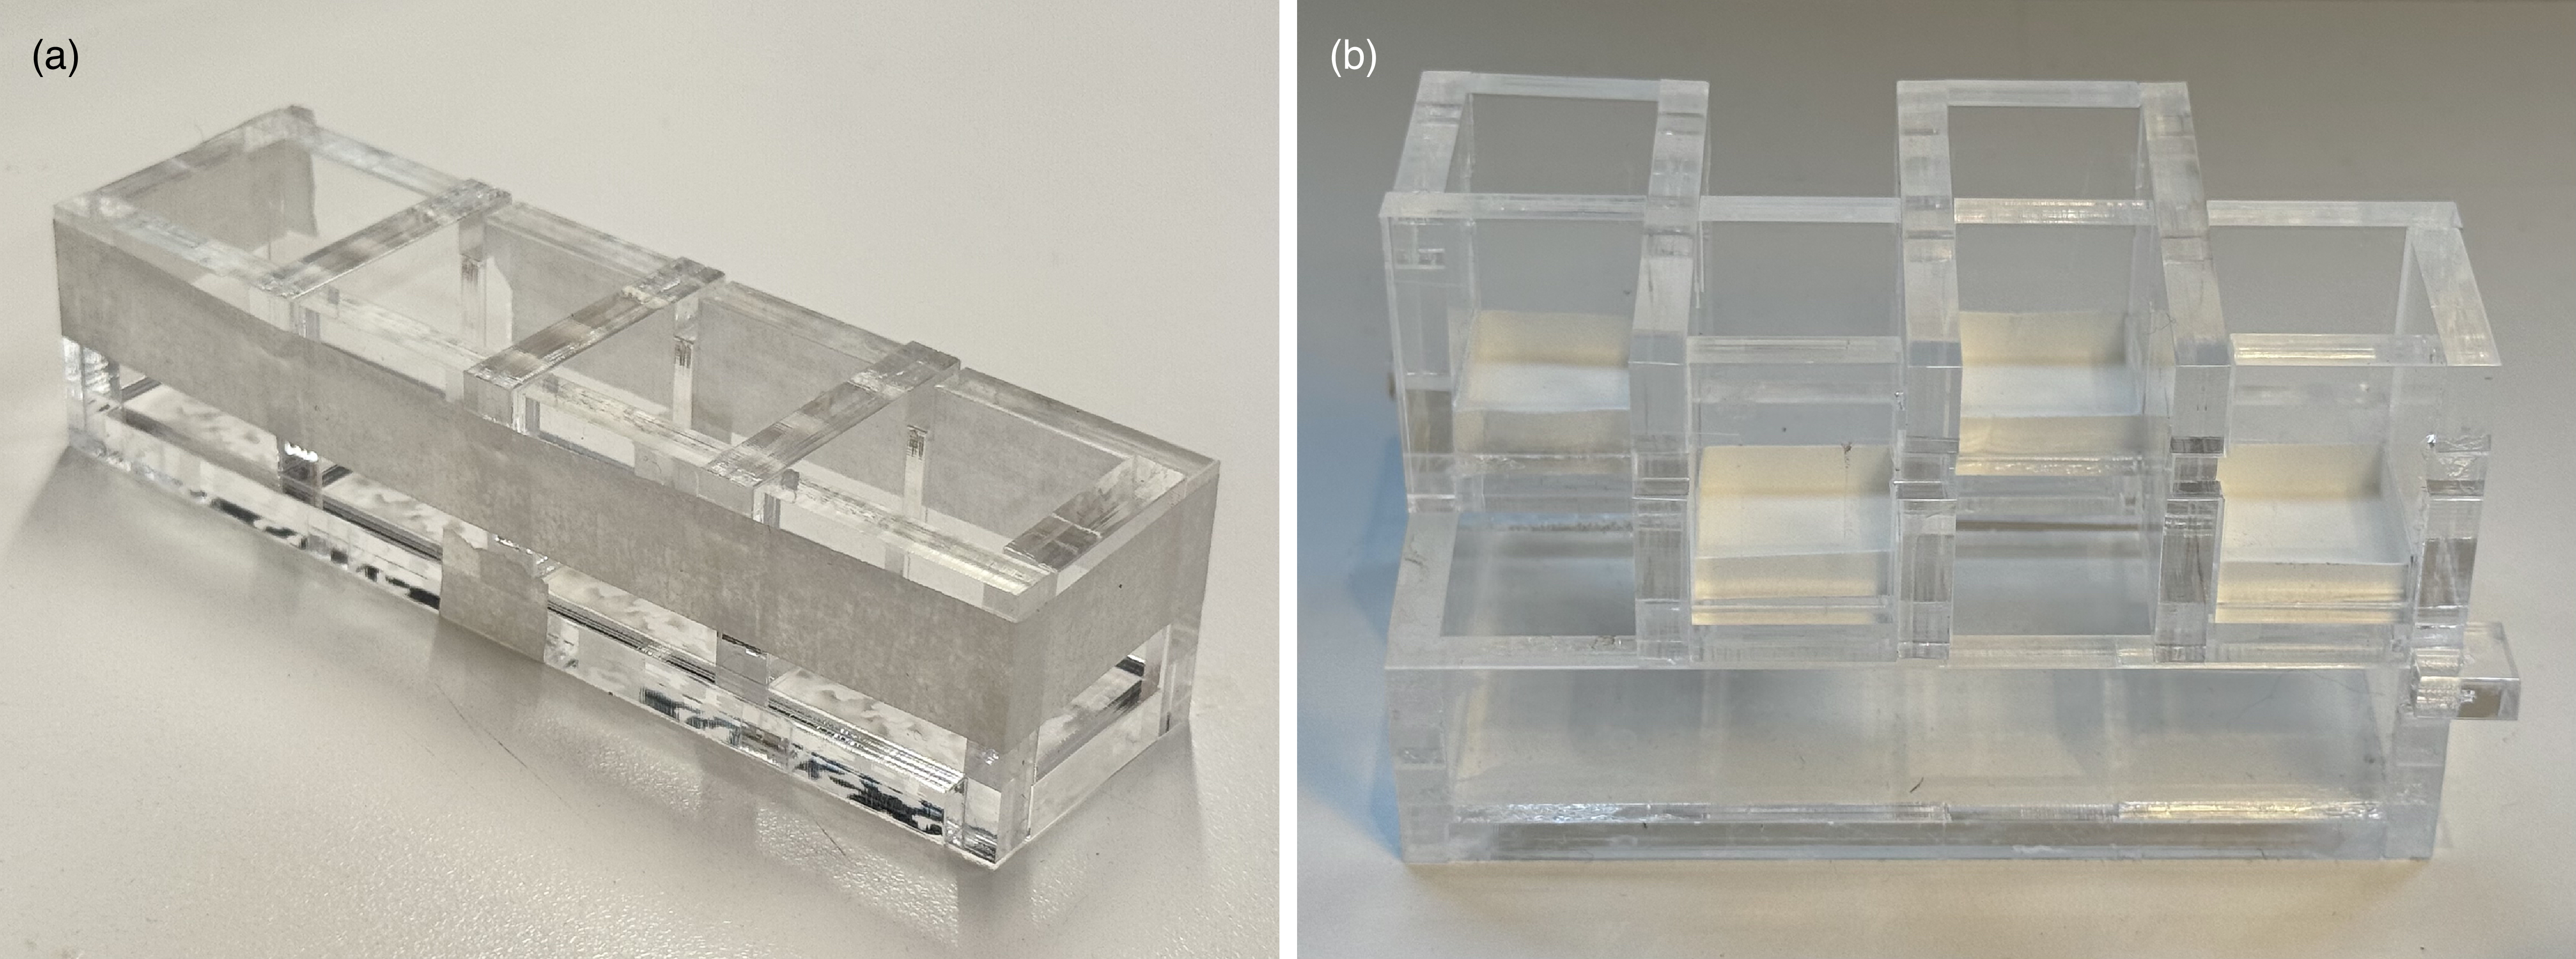
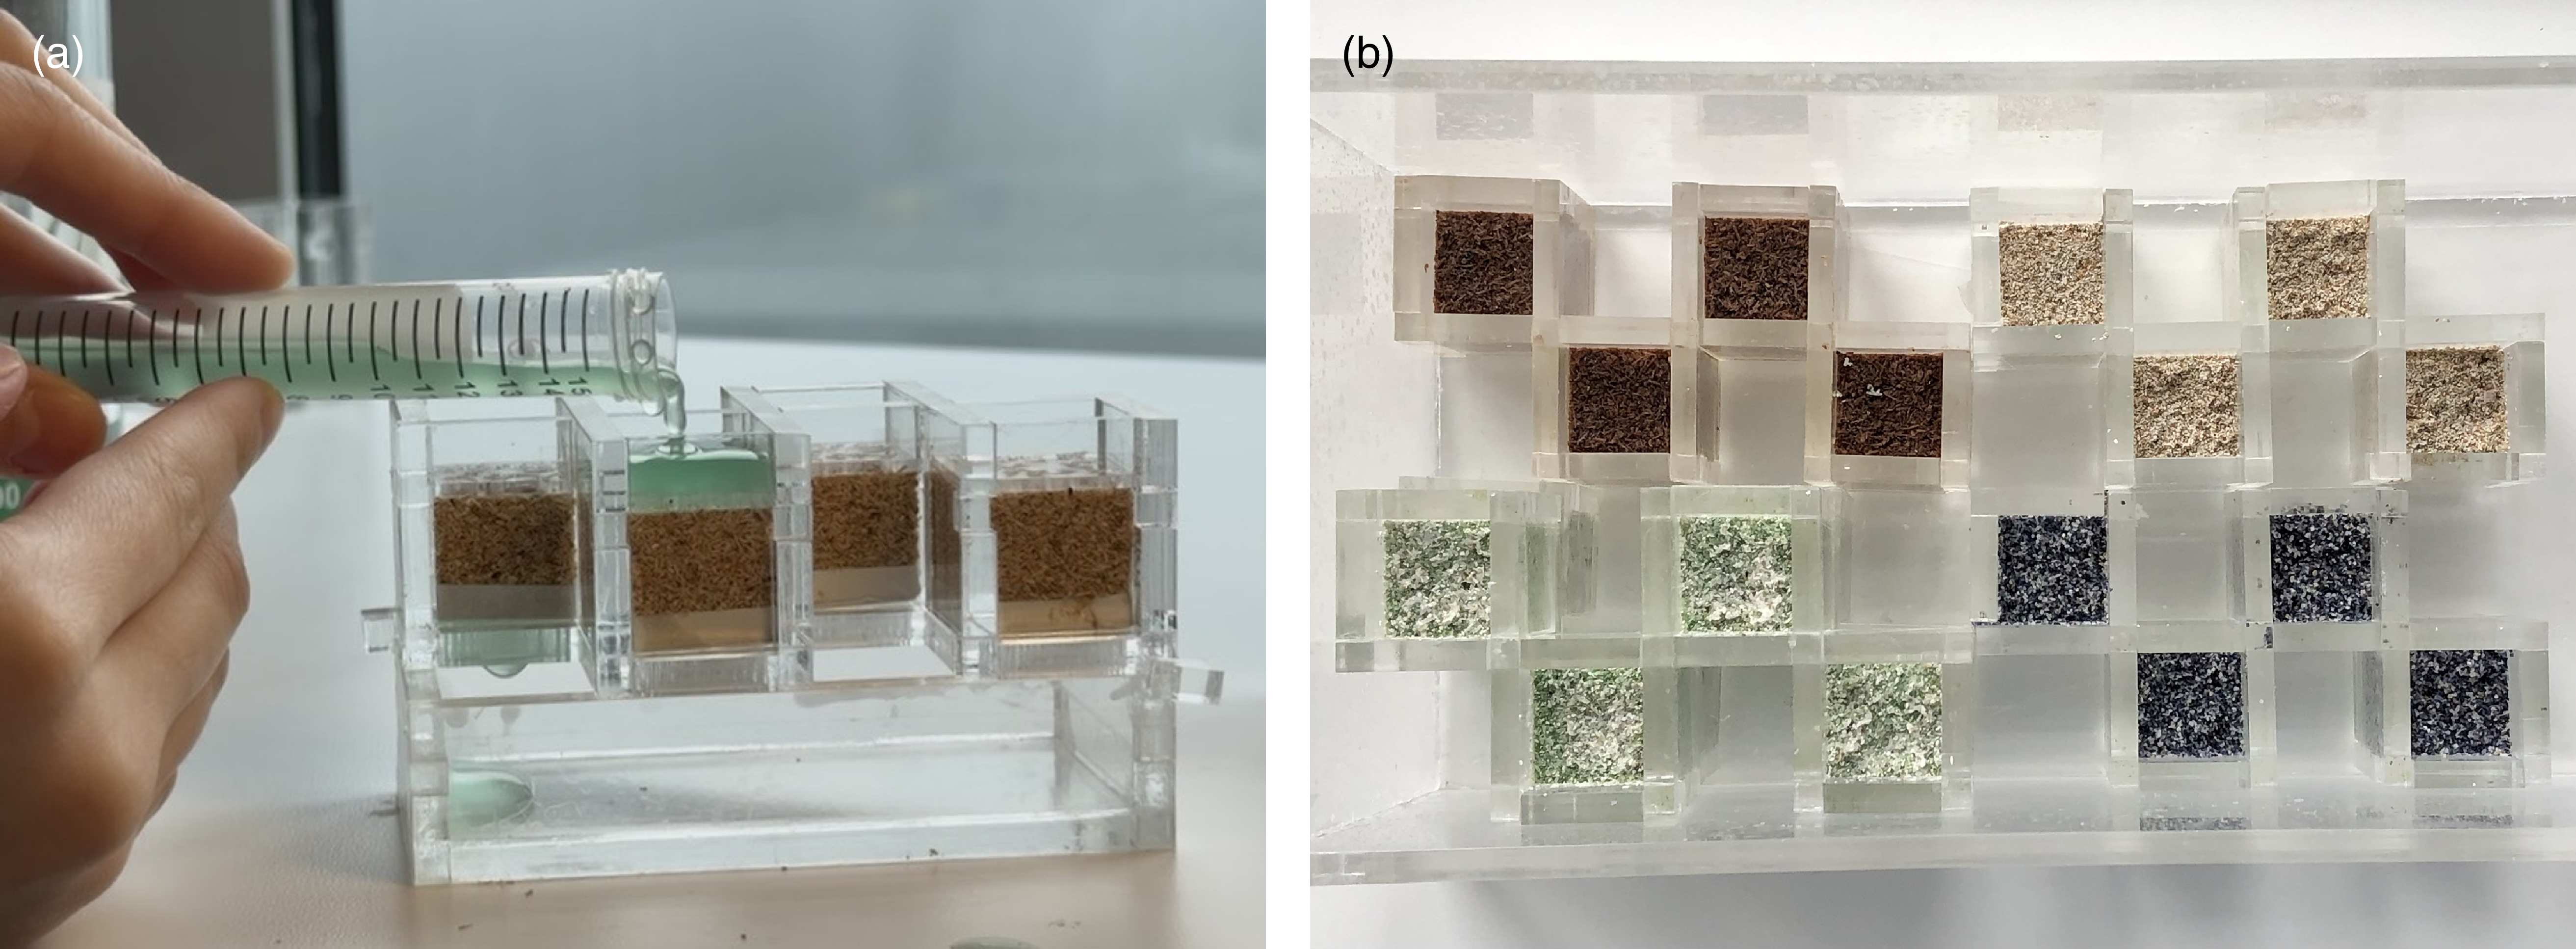
Two modular acrylic mould systems were used for the three biofabrication workflows. For the hydrogel systems, namely the gelatine and alginate systems, a mould consisting of four cubic compartments (2 × 2 × 2 cm) was developed, allowing for easy casting and demoulding (Figure 3a). For the non-gel system, a mould developed in a previous study (Shin et al. Reference Shin, Archer, Malpass and Collet2026) was used. This mould comprised four cubic compartments (2 × 2 × 2 cm) with perforated bases for drainage and an effluent collection container. A paper filter at the base of each compartment retained the materials while allowing excess medium to pass into a collection container below (Figure 3b).
Moulds used for the three biofabrication workflows: (a) mould used for the gelatine and alginate systems; and (b) mould used for the non-gel system.

Figure 3. Long description
Two labelled photographs of the modular acrylic mould systems. Panel (a) shows the mould used for the hydrogel systems (gelatine and alginate): a flat acrylic tray divided into four open cubic compartments, each measuring 2 by 2 by 2 cm, allowing material to be cast and demoulded as discrete cubes. Panel (b) shows the mould used for the non-gel liquid system, in which packed waste-derived materials are held in place while liquid mineralisation medium is repeatedly applied. The images convey the modular construction and the cube format shared across the workflows.
Bacterial strain
Synechococcus sp. PCC 7002 was obtained from the Grow Lab, Central Saint Martins, University of the Arts London, having originally been purchased from the Culture Collection of Algae and Protozoa (CCAP), UK. Cultures were grown in A⁺ medium containing 0.308 M NaCl, 0.02 M MgSO4, 0.08 mM Na2EDTA, 8.05 mM KCl, 2.52 mM CaCl2, 11.8 mM NaNO3, 0.37 mM KH2PO4 and 8.26 mM Trizma base, supplemented with 10 mL/L Trace Components (Heveran et al. Reference Heveran, Williams, Qiu, Artier, Hubler, Cook, Cameron and Srubar2020; Stevens et al. Reference Stevens, Patterson and Myers1973). Cells were maintained at an ambient temperature of 22–26 °C under cool-white fluorescent illumination at 180 μmol photons m−2 s−1 on a 12 h:12 h light:dark cycle (Heveran et al. Reference Heveran, Williams, Qiu, Artier, Hubler, Cook, Cameron and Srubar2020; Shin et al. Reference Shin, Archer, Malpass and Collet2026).
Biofabrication workflows
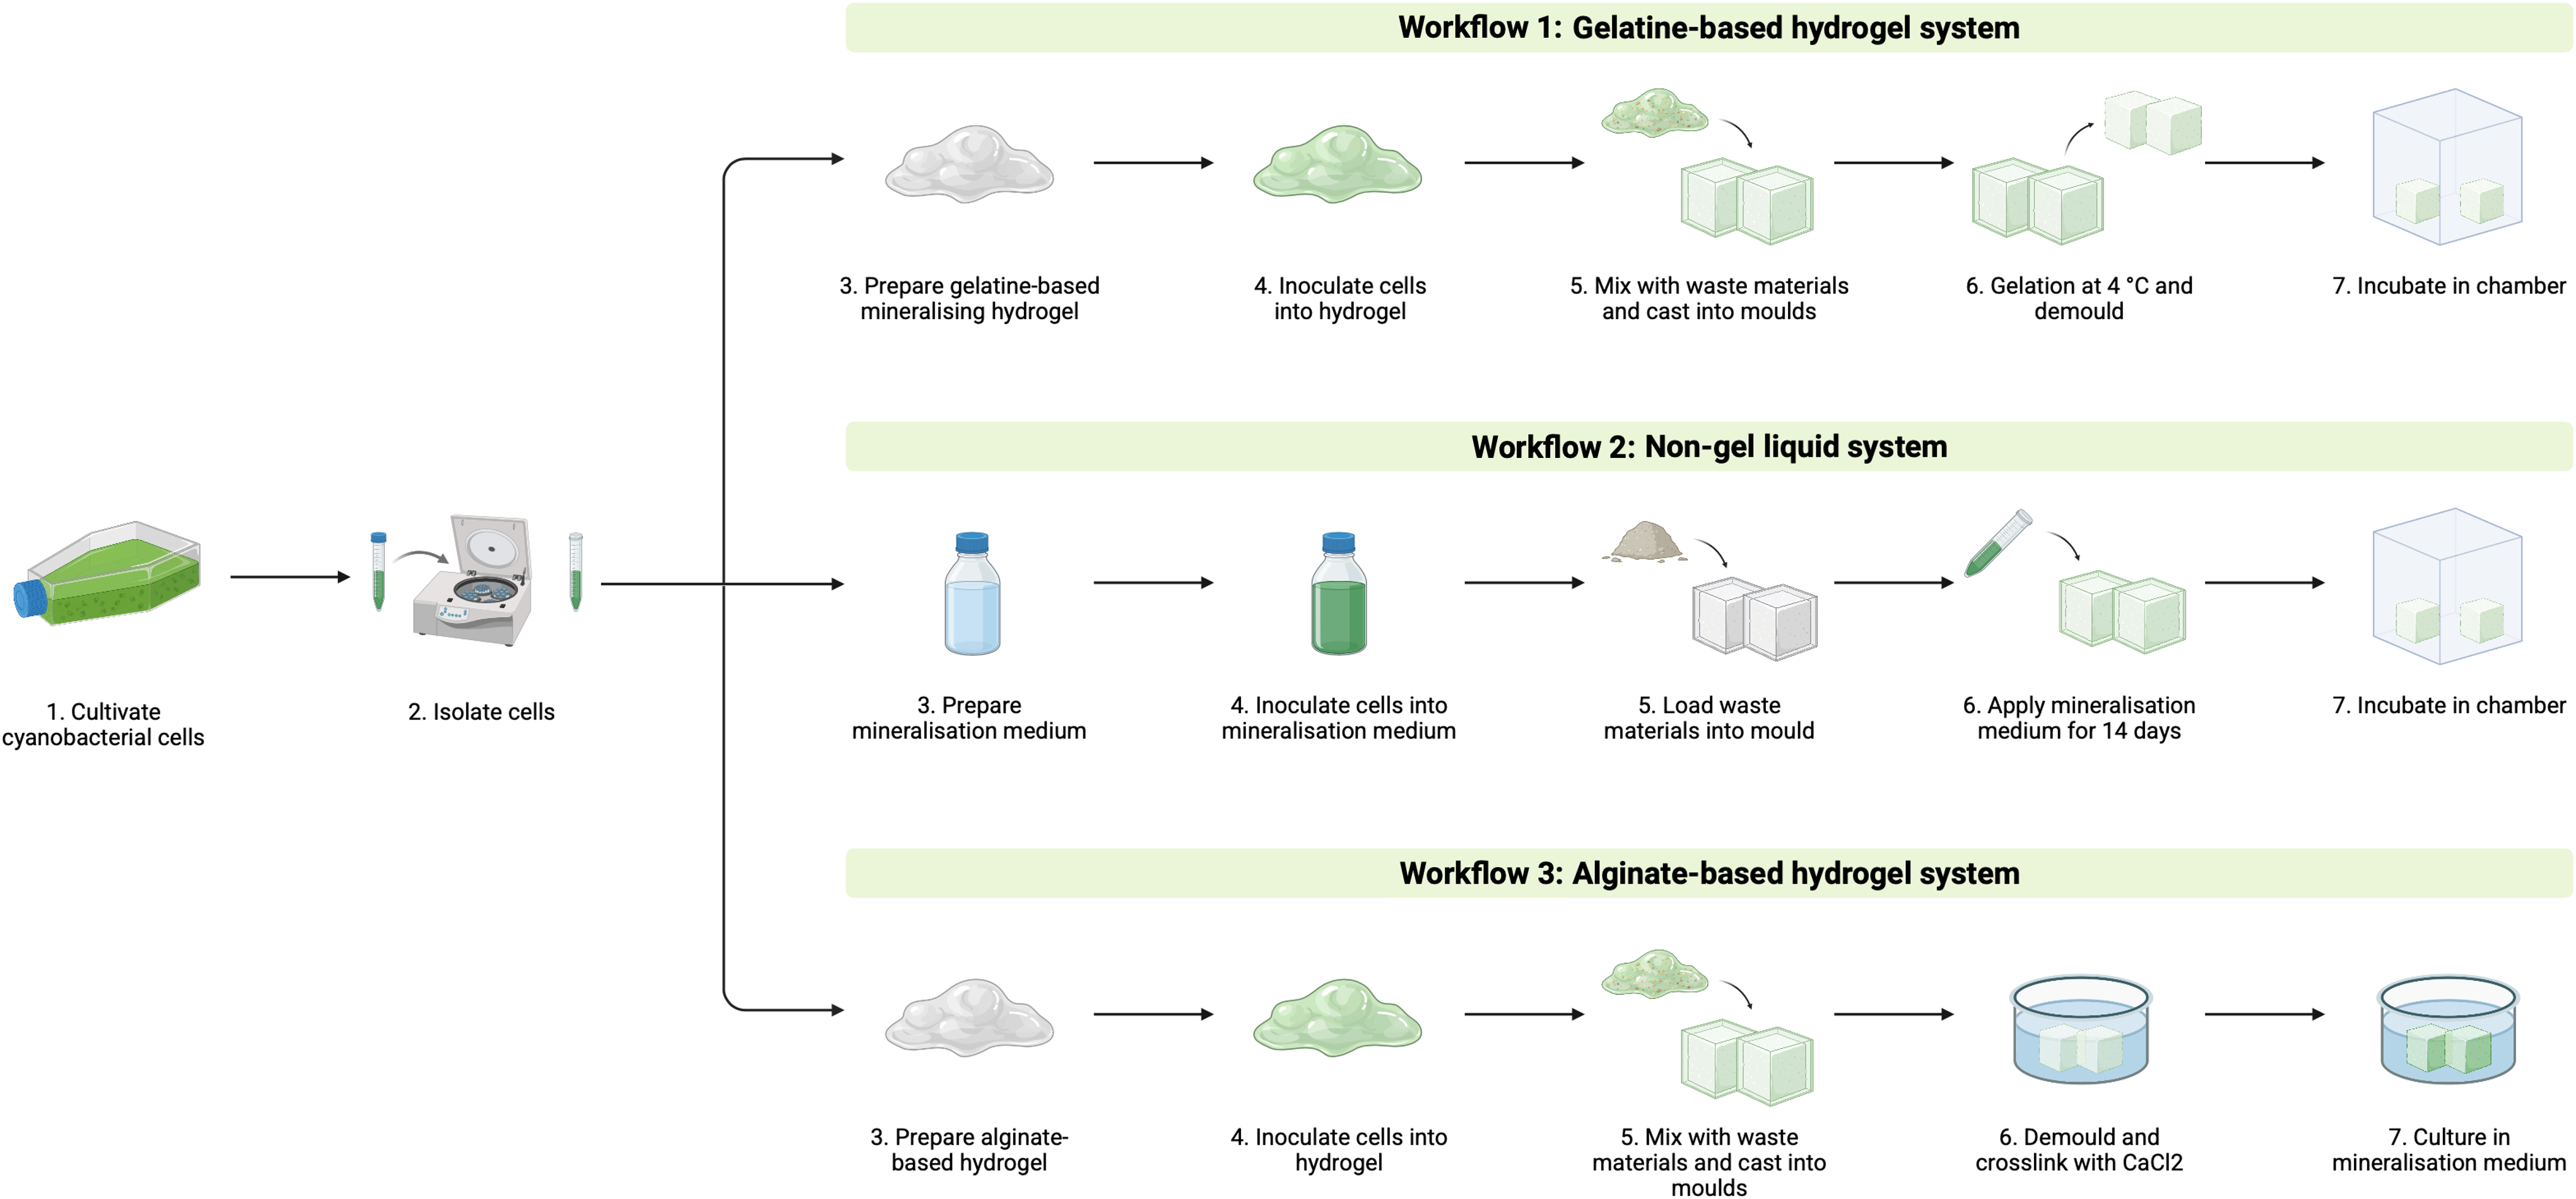
Material samples were fabricated by combining Synechococcus sp. PCC 7002 with the same set of eleven waste-derived materials through three photosynthetic biomineralisation workflows: the gelatine system, the non-gel system and the alginate system (Figure 4). These workflows were adapted from the gelatine-based hydrogel approach reported by Heveran et al. (Reference Heveran, Williams, Qiu, Artier, Hubler, Cook, Cameron and Srubar2020), the binder-free approach reported by Sidhu et al. (Reference Sidhu, Goyal and Reddy2022) and the alginate-based hydrogel approach reported by Reinhardt et al. (Reference Reinhardt, Ihmann, Ahlhelm and Gelinsky2023), respectively. The following subsections describe the preparation, fabrication, incubation and drying procedures for each workflow.
Overview of the three photosynthetic biomineralisation workflows used in this study: the gelatine-based hydrogel system, liquid non-gel system and alginate-based hydrogel system.

Figure 4. Long description
A comparative process diagram presenting the three biofabrication workflows as three parallel columns, each combining Synechococcus sp. PCC 7002 cells with the same eleven waste-derived materials. The gelatine-based hydrogel system column shows waste material embedded in a cell-inoculated mineralising gelatine hydrogel, cast into cube moulds, then incubated for 14 days. The liquid non-gel system column shows waste material packed directly into the mould and consolidated by repeated twice-daily application of cell-inoculated liquid mineralisation medium over 14 days. The alginate-based hydrogel system column shows waste material mixed into a cell-inoculated alginate-methylcellulose hydrogel, cast into moulds, ionically crosslinked, then cultivated in mineralisation medium for 14 days. The three columns share a common starting point (cells plus materials) and a common 14-day cultivation endpoint, highlighting where the binder type, crosslinking, and medium-application steps differ.
Workflow 1: Gelatine-based hydrogel system
In the gelatine system, waste-derived materials were embedded in an inoculated mineralising gelatine hydrogel, cast into cube moulds and incubated under controlled light and humidity conditions for 14 days.
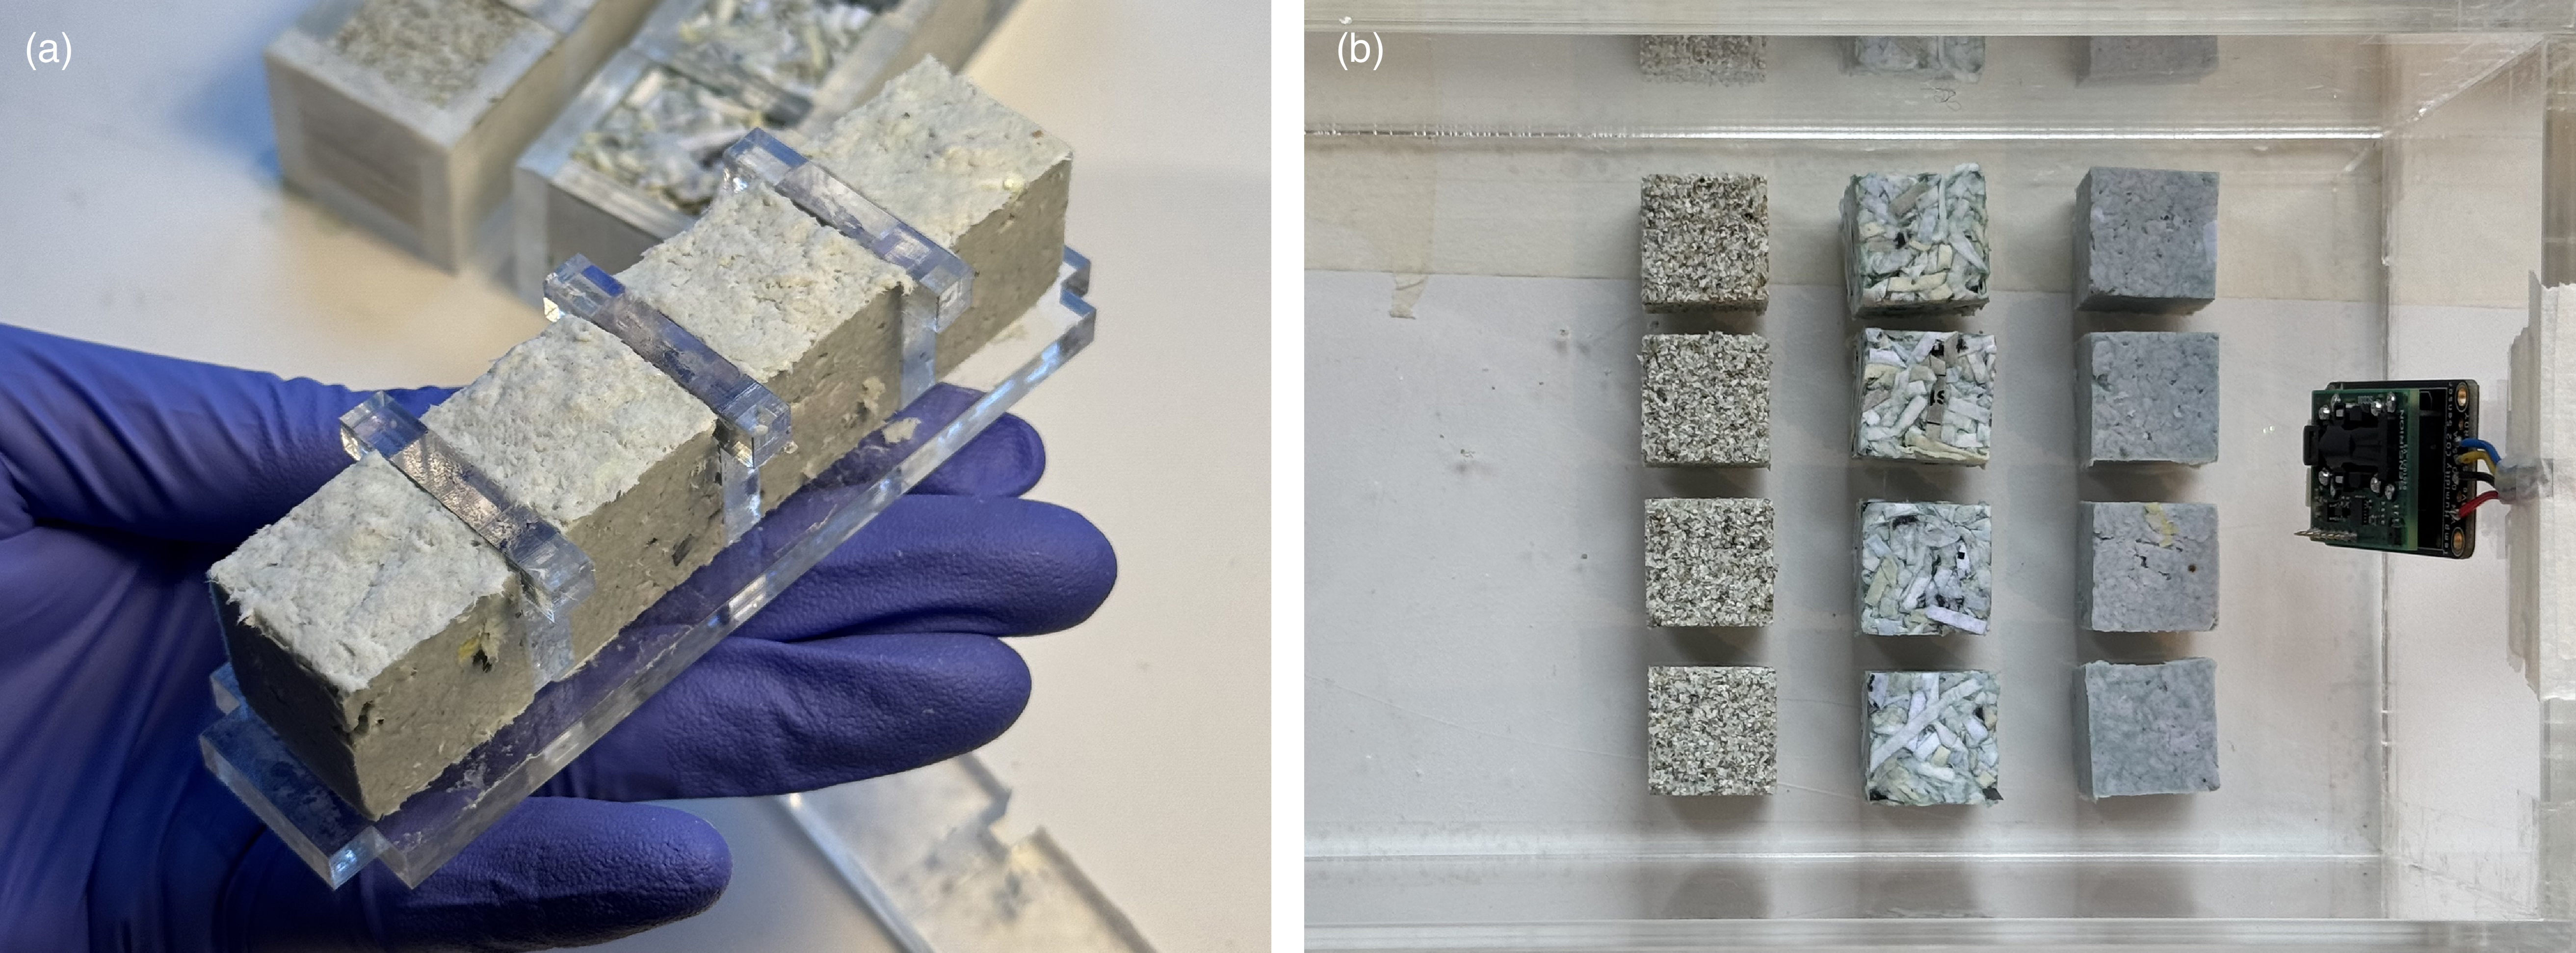
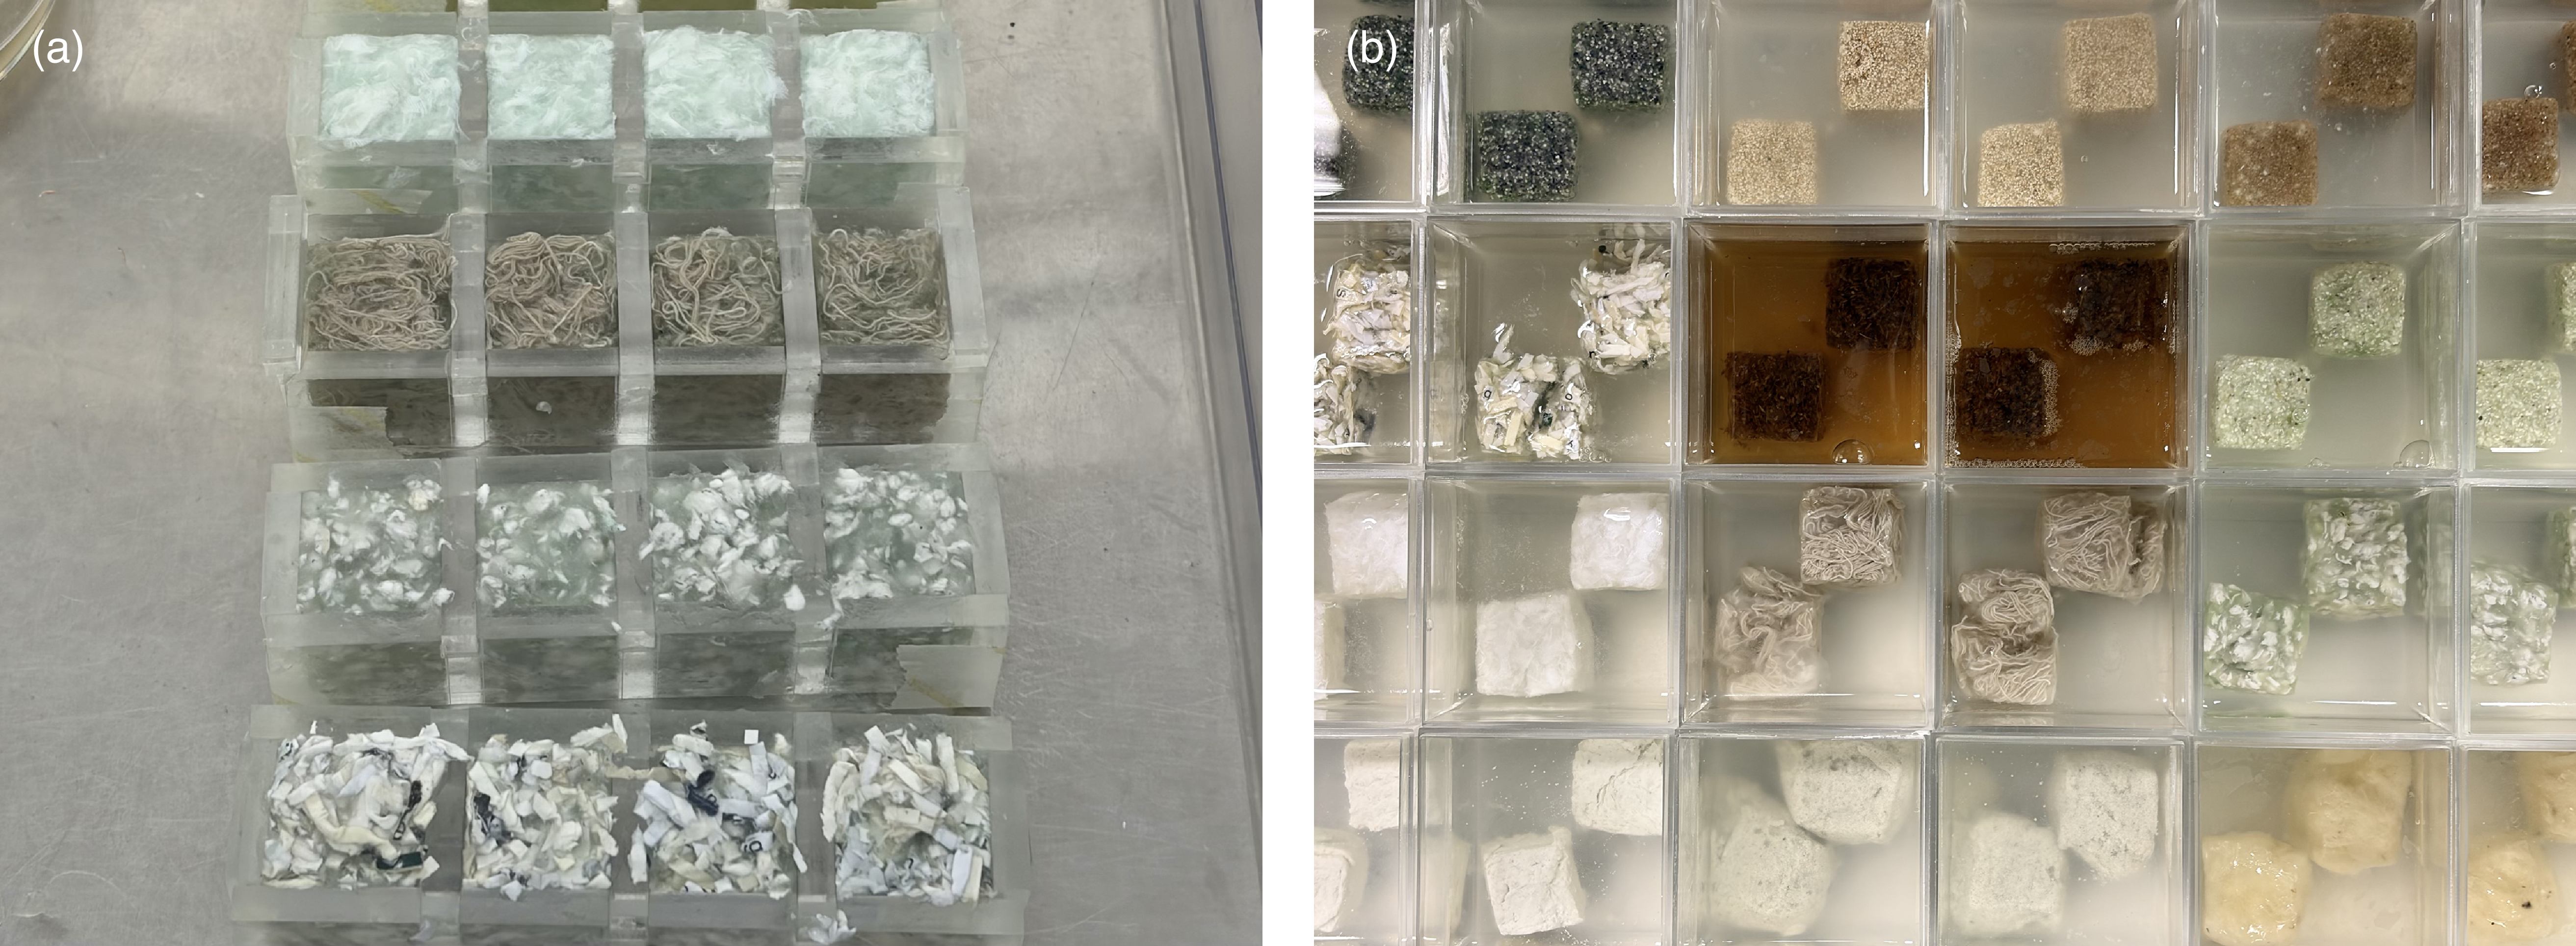
Gelatine (100 g/L) was dissolved at 50 °C in modified A⁺ medium prepared without CaCl2. The solution was cooled to 40 °C, supplemented with 100 mM NaHCO3 and adjusted to pH 7.6. CaCl2 was then added slowly to a final concentration of 100 mM. Synechococcus sp. PCC 7002 cells were inoculated into the gelatine solution at a starting density of OD730 = 0.3 and mixed thoroughly to ensure homogeneous distribution. Waste-derived materials were mixed with the inoculated gelatine solution and cast into 2 × 2 × 2 cm cube moulds. The moulded samples were stored at 4 °C for 8 hours and then demoulded (Figure 5a). Samples were incubated in a closed chamber maintained at 22–26 °C and 85–95 % relative humidity under a 12 h:12 h light:dark cycle (Figure 5b). After 14 days, the samples were removed from the chamber and air-dried for 3 days under ambient conditions.
Gelatine-based hydrogel workflow. (a) Gelatine-based samples cast in a mould. (b) Demoulded gelatine-based samples in the incubation chamber.

Figure 5. Long description
Two photographs documenting the gelatine workflow. Panel (a) shows the cell-inoculated gelatine hydrogel, containing embedded waste-derived material, placed in the four-compartment cube mould. Panel (b) shows the same samples after demoulding, placed in the incubation chamber under controlled light and humidity for the 14-day cultivation period.
Workflow 2: Liquid non-gel system
In the non-gel system, waste-derived materials were placed directly into the mould and consolidated through the repeated application of inoculated liquid mineralisation medium over 14 days, following the procedure used in our previous study (Shin et al. Reference Shin, Archer, Malpass and Collet2026).
To prepare the mineralisation medium, modified A⁺ medium prepared without CaCl2 was supplemented with 100 mM NaHCO3, adjusted to pH 7.6 and followed by the slow addition of 100 mM CaCl2. Synechococcus sp. PCC 7002 cells were inoculated into the mineralisation medium at a starting density of OD730 = 0.3. The inoculated mineralisation medium was gently applied to the packed waste-derived materials (Figure 6a). A 2.5 mL volume was applied to each sample twice daily during the 14-day incubation period. Samples were incubated under the same environmental conditions described above and air-dried for 7 days under ambient conditions (Figure 6b).
(a) Application of inoculated mineralisation medium to packed waste-derived materials, reproduced from Shin et al. (Reference Shin, Archer, Malpass and Collet2026). (b) Non-gel samples within the moulds in the incubation chamber.

Figure 6. Long description
Two photographs documenting the non-gel liquid workflow. Panel (a), reproduced from Shin et al. (2026), shows cell-inoculated liquid mineralisation medium being poured onto waste-derived material packed into a mould compartment; this application is repeated twice daily over the 14-day period to gradually consolidate the loose material. Panel (b) shows several non-gel samples held within their moulds inside the incubation chamber during cultivation, with visible green cyanobacterial pigmentation developing on the packed material surfaces.
Workflow 3: Alginate-based hydrogel system
In the alginate system, waste-derived materials were incorporated into an inoculated alginate–methylcellulose hydrogel, cast into moulds, ionically crosslinked and subsequently incubated in mineralisation medium for 14 days.
Alginic acid sodium salt was dissolved in deionised water to prepare the base solution. Methylcellulose and waste-derived materials were mixed with the alginate solution and left for 1 hour to allow the methylcellulose to swell. Synechococcus sp. PCC 7002 cells were inoculated into the mixture at a starting density of OD730 = 0.3 and mixed thoroughly to ensure homogeneous distribution. The inoculated mixture was cast into 2 × 2 × 2 cm cube moulds and demoulded after 1 hour (Figure 7a). Each sample was ionically crosslinked with 100 mM CaCl2 solution for 10 min, then transferred to mineralisation medium and incubated for 14 days under the same environmental conditions described above (Figure 7b). Following incubation, samples were air-dried for 3 days under ambient conditions.
(a) Alginate-based samples cast into moulds before ionic crosslinking. (b) Ionically crosslinked alginate-based samples incubated in mineralisation medium.

Figure 7. Long description
Two photographs documenting the alginate workflow. Panel (a) shows the cell-inoculated alginate-methylcellulose hydrogel, mixed with waste-derived material, cast into the cube moulds before crosslinking, appearing as a soft, uncured gel. Panel (b) shows the same samples after ionic crosslinking has set them into firm cubes, now submerged in mineralisation medium for the 14-day cultivation period. The panels illustrate the two-stage forming process distinctive to the alginate system: casting followed by ionic crosslinking.
Comparative assessment
To compare the three photosynthetic biomineralisation workflows from a product design perspective, this study used five design-led criteria: workflow feasibility, resource inputs, visible cyanobacterial retention, material qualities and preliminary biomineralisation indicators. These criteria were selected to consider both workflow processes and material outcomes, including how each workflow is prepared, maintained and handled, as well as how it shapes the resulting material samples. Although these criteria are interrelated, the first two primarily address workflow processes, while the latter three focus on material outcomes.
Workflow feasibility was assessed in terms of practical handling, casting reliability and labour requirements of each workflow across preparation, fabrication and incubation steps. Resource inputs were assessed in terms of the material, operational and temporal inputs required for each workflow. Material inputs included binder use, water for binder preparation, crosslinking solution and mineralisation medium. Operational inputs referred to daily maintenance requirements, while temporal inputs included incubation and ambient drying durations. All inputs were documented per 2 × 2 × 2 cm sample. Visible cyanobacterial retention was assessed qualitatively through macroscopic observation and 200 × digital optical microscopy using a Keyence digital microscope. The assessment considered the presence of visible pigmentation during incubation and after drying. This was used as a visual indicator of cyanobacterial retention, rather than as a quantitative measure of cell viability or photosynthetic activity. Material qualities were assessed by considering whether each sample retained its overall cubic geometry, developed structural cohesion after drying and exhibited visible changes, such as shrinkage, cracking, deformation or melting during incubation and drying. Preliminary biomineralisation indicators were assessed using the Keyence digital microscope at 200× magnification, focusing on visible white crystalline features on the material surfaces. These microscopy observations were treated as preliminary, as they cannot confirm the composition, mineral phase or formation mechanism of these features.
Selected SEM–EDS analysis
Paired non-inoculated control and inoculated alginate-based alumina (M11) samples were analysed to further examine the composition of crystalline surface features. M11 was selected as alumina is not an intrinsic calcium-bearing material, allowing calcium-rich deposits to be interpreted in relation to potential biomineralisation, rather than the material composition alone.
Surface morphology and elemental composition were analysed at the Grow Lab, using a TM4000 Plus tabletop scanning electron microscope (SEM) (Hitachi High-Tech, Japan) equipped with energy-dispersive X-ray spectroscopy (EDS). This analysis was used as supporting evidence rather than as a comprehensive validation of biomineralisation across all workflows and waste-derived materials, as SEM–EDS data were limited to the selected M11 sample pair.
Results
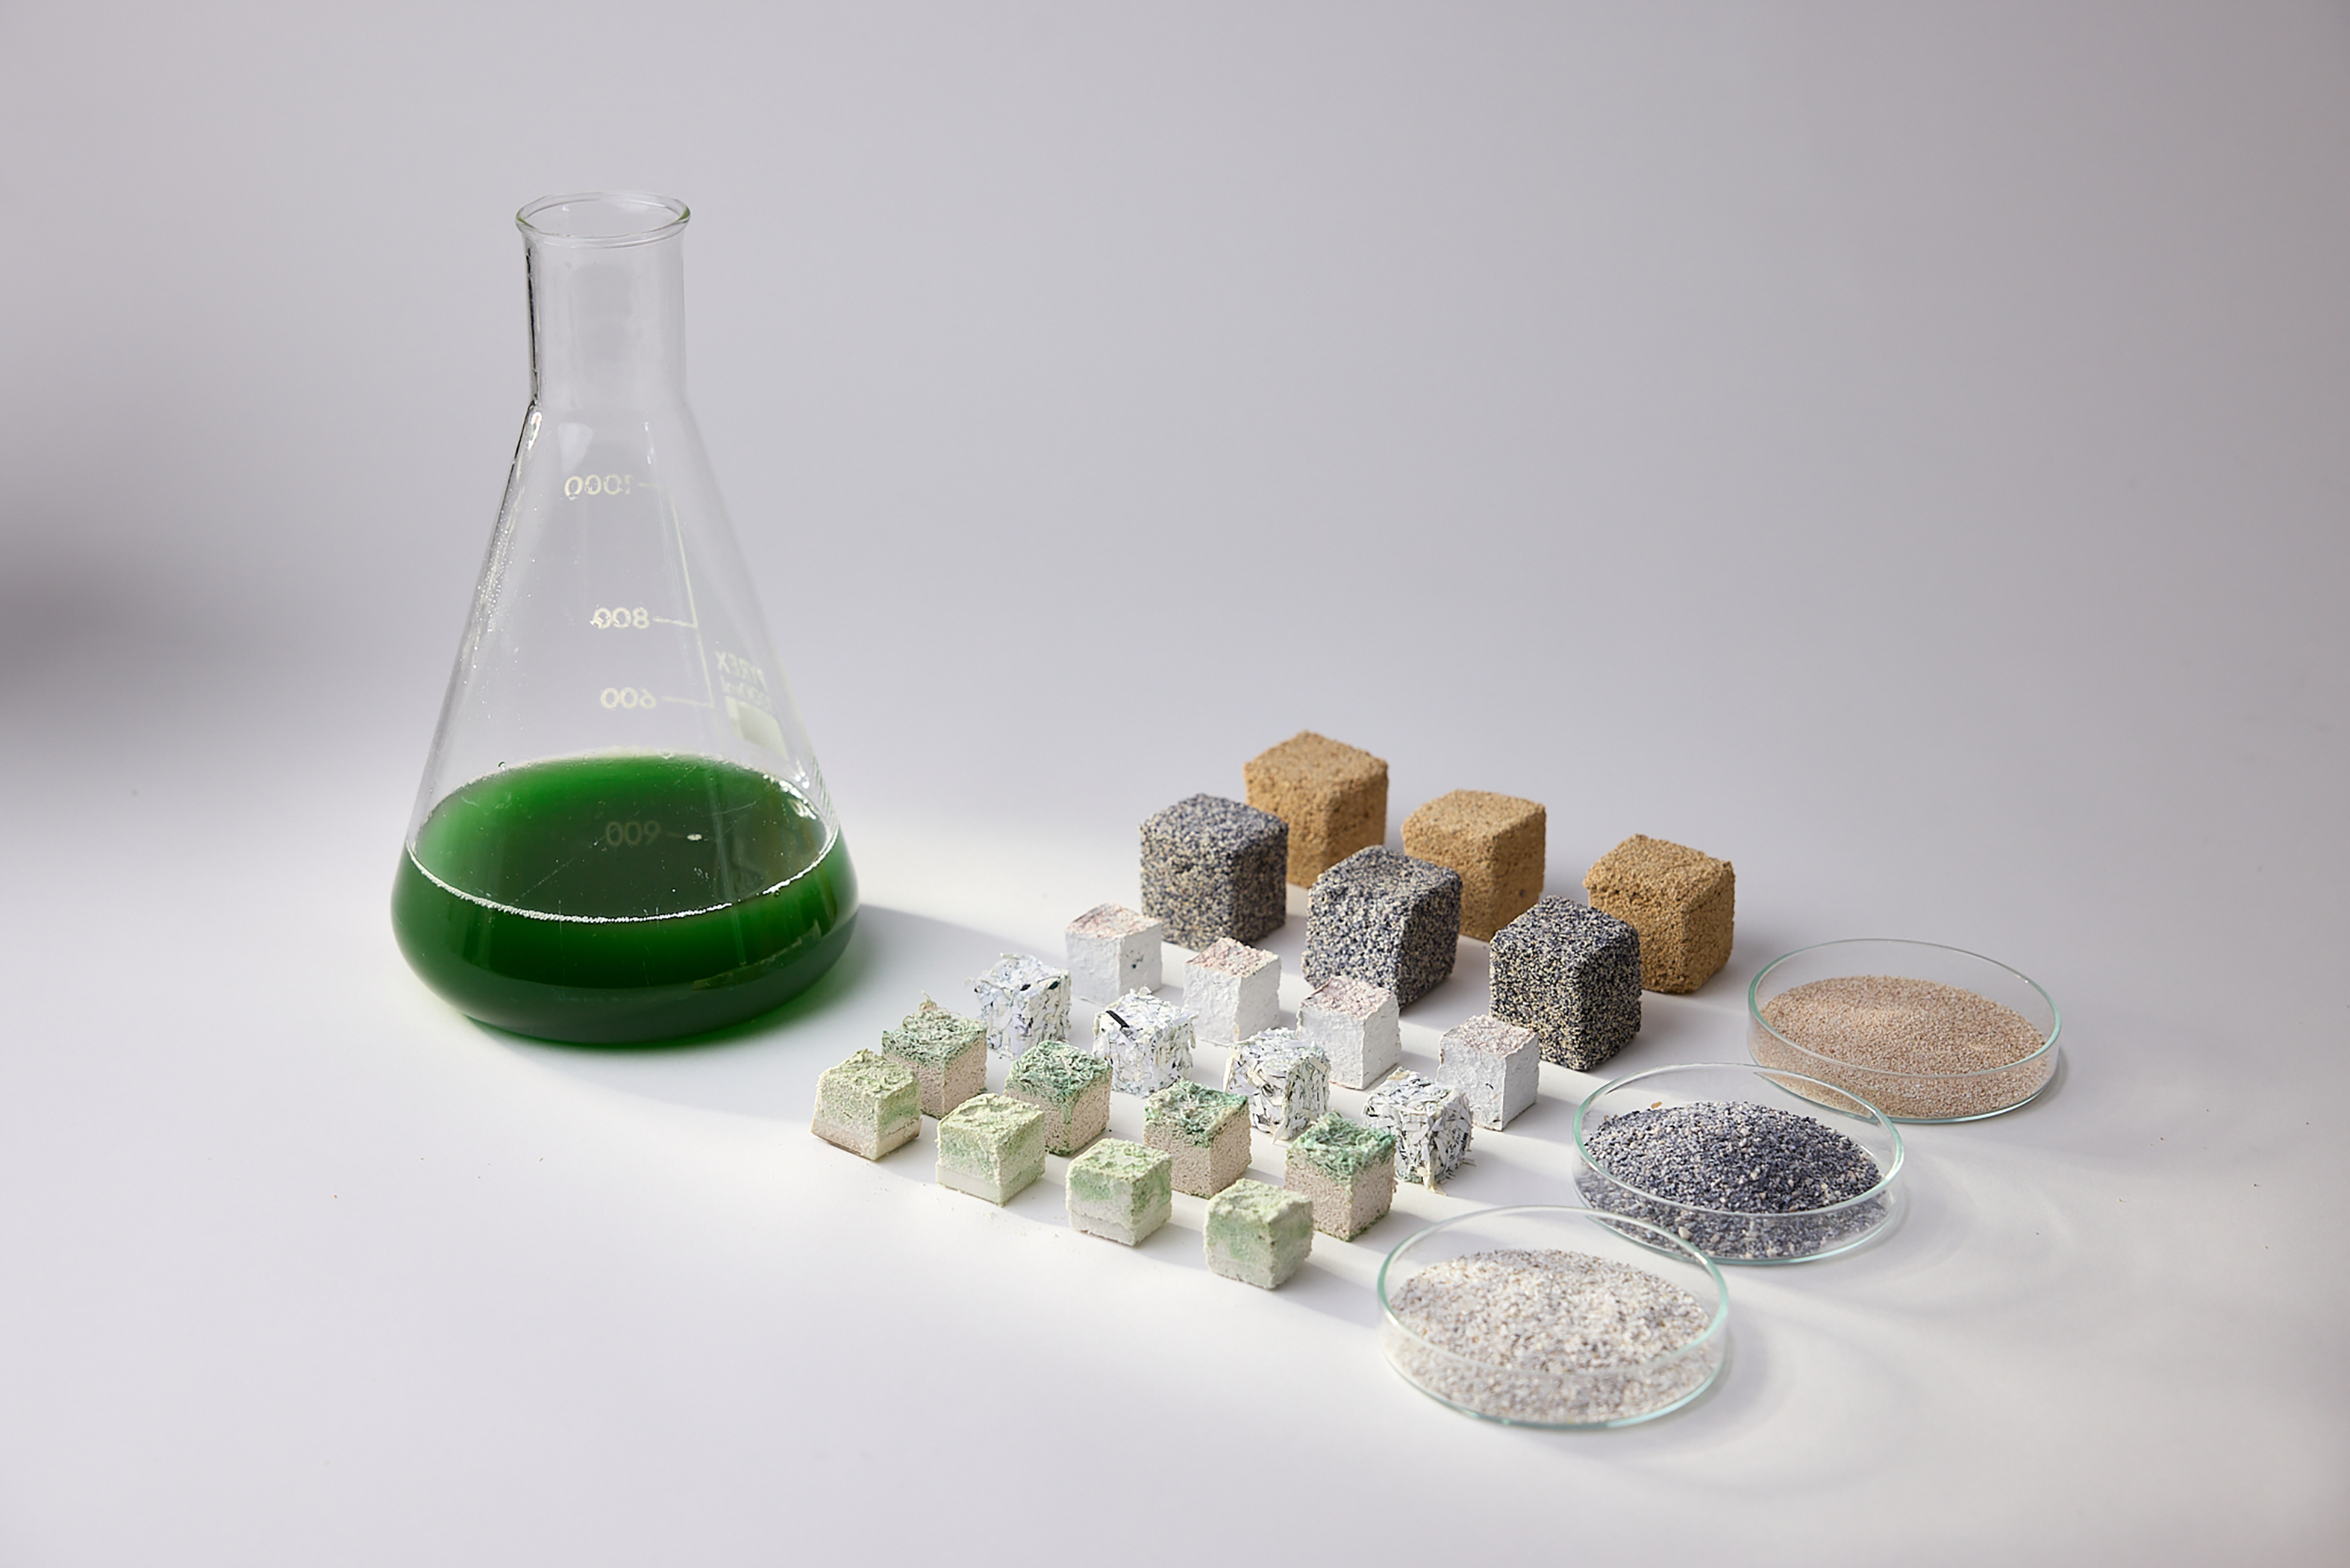
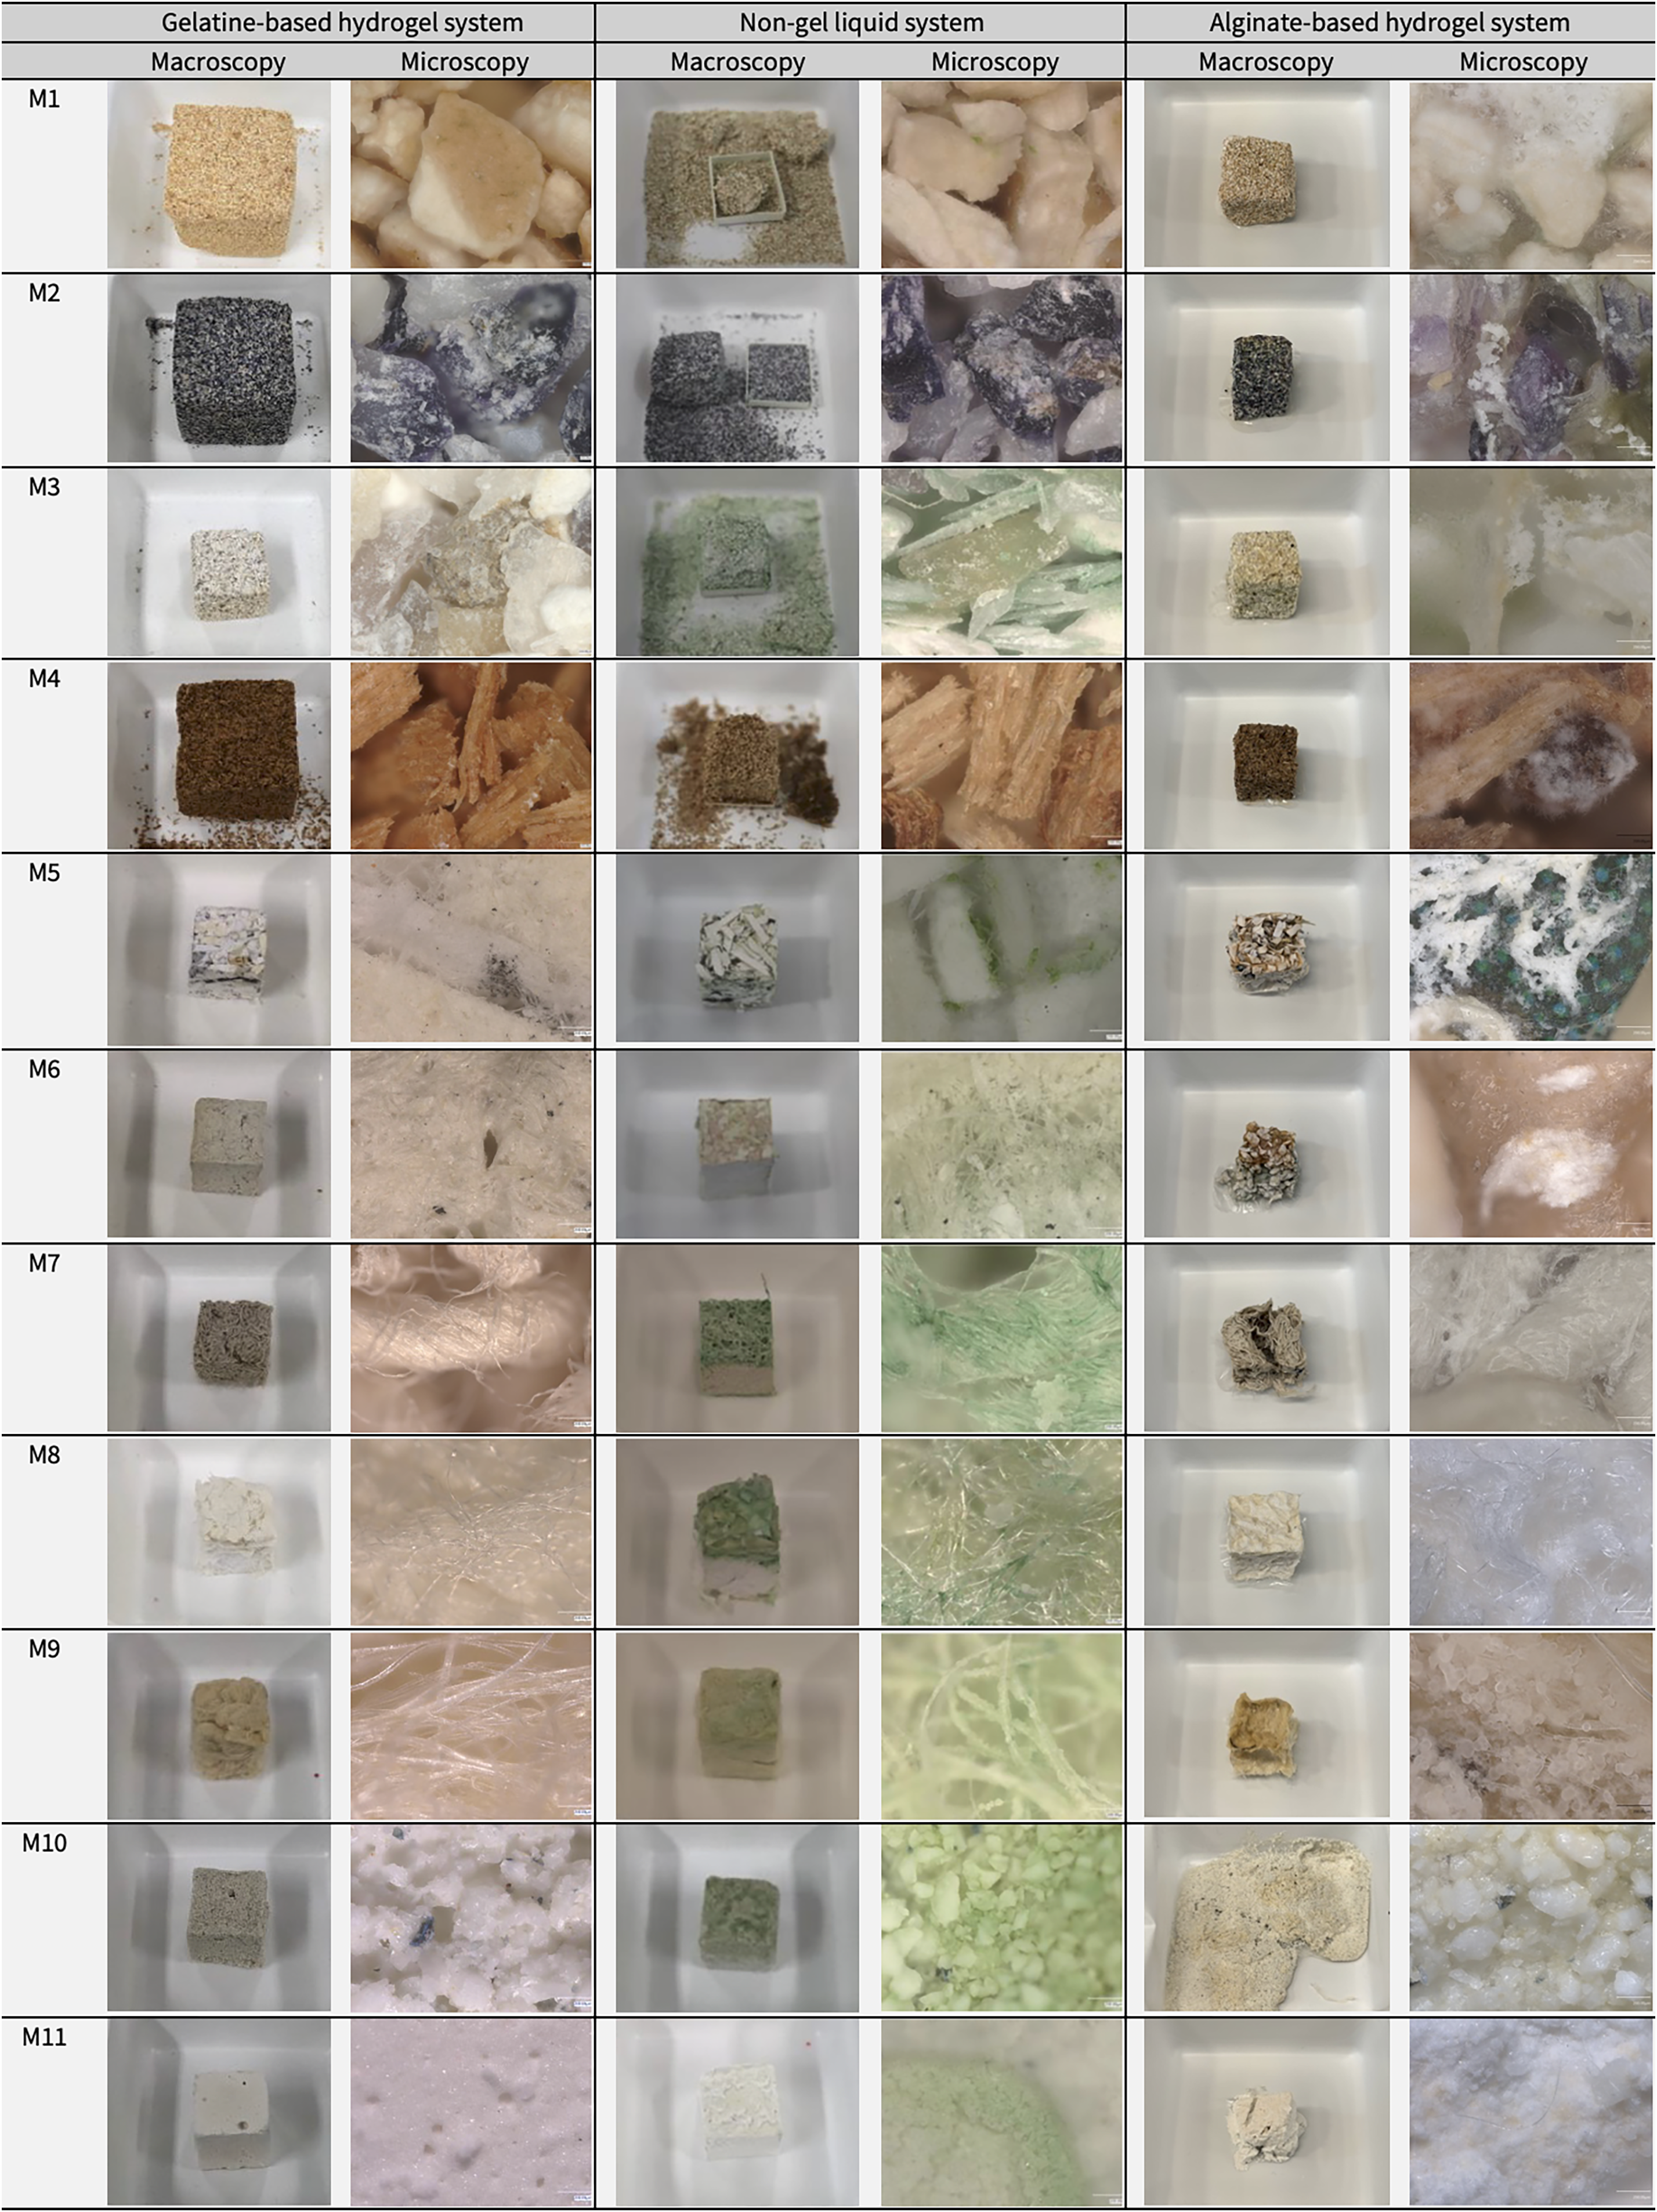
Three parallel material sample collections were developed using the gelatine, non-gel and alginate workflows. Each collection contained samples fabricated with Synechococcus sp. PCC 7002 and the eleven waste-derived materials. Figure 8 provides an overview of the representative sample collections, alongside the processed waste-derived materials and cyanobacterial culture used in the study. Figure 9 presents macroscopic and 200 × microscopy images of the 33 material outcomes produced across the three workflows. The three workflows and their resulting sample collections were compared using five assessment criteria: workflow feasibility, resource inputs, visible cyanobacterial retention, material qualities and preliminary biomineralisation indicators.
Representative photosynthetic biomineralisation material sample collection, showing cyanobacterial culture, processed waste-derived materials and fabricated samples developed through the three biofabrication workflows, reproduced from Shin et al. (Reference Shin, Archer, Malpass and Collet2026). Photograph by Paul Cochrane.

Figure 8. Long description
The figure presents a representative material sample collection for the study. It shows a flask or vessel of green Synechococcus sp. PCC 7002 cyanobacterial culture, the representative processed waste-derived materials, and the representative fabricated samples produced through the gelatine-based hydrogel, liquid non-gel, and alginate-based hydrogel systems.
Macroscopic and microscopic (200×) observations of material sample collections produced using three biofabrication workflows. Rows labelled M1–M11 correspond to the waste-derived materials defined in Table 1. Gelatine-based samples (M1, M2 and M4) were fabricated at 3 × 3 × 3 cm, whereas all other samples were produced at 2 × 2 × 2 cm.

Figure 9. Long description
The figure is a comparative image grid. Rows correspond to the eleven waste-derived materials M1–M11, and columns compare the gelatine-based hydrogel, non-gel liquid, and alginate-based hydrogel systems. Each workflow is represented by a macroscopic sample photograph and a 200x microscopic image. The grid shows differences in colour, surface texture, fibre or particle structure, green cyanobacterial pigmentation, and white crystalline features across the three workflows. It also notes that gelatine-based samples M1, M2, and M4 were made at 3 x 3 x 3 cm, while all other samples were 2 x 2 x 2 cm.
Workflow feasibility
The gelatine workflow demonstrated the highest feasibility among the three workflows. Samples were consistently castable and easy to demould across all waste-derived materials, making it the most straightforward workflow. Its main limitation was the temperature sensitivity of gelatine, which required a short handling window during sample fabrication and controlled incubation temperatures to prevent sample deformation.
The non-gel workflow showed the lowest feasibility. Although it did not require binder preparation, it involved additional steps, including designing customised moulds with drainage systems and twice-daily manual feeding with inoculated mineralisation medium over the 14-day incubation period.
The alginate workflow showed intermediate feasibility. The initial hydrogel preparation, cell inoculation, mixing and casting steps were broadly similar to those of the gelatine workflow. However, this workflow required additional ionic crosslinking of the samples in CaCl2 solution, followed by immersion in mineralisation medium for incubation. These additional handling steps increased process complexity compared with the gelatine workflow but required less daily maintenance than the non-gel workflow.
Resource inputs
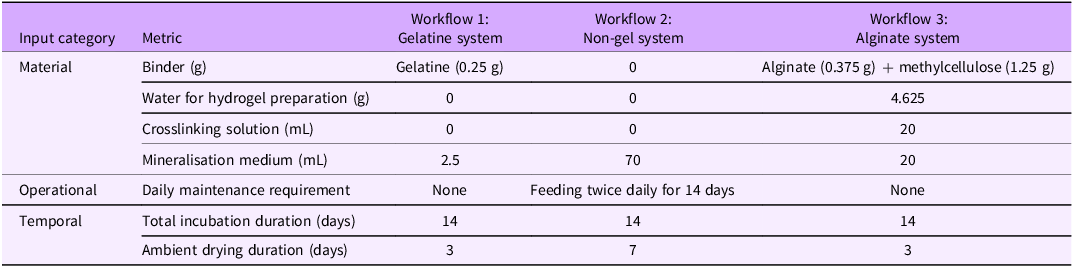
Resource inputs were quantified per 2 × 2 × 2 cm sample across the three workflows (Table 3).
Resource inputs required by three workflows, quantified per 2 × 2 × 2 cm sample

Table 3. Long description
The table compares resource inputs for the gelatine, non-gel, and alginate workflows. The gelatine system uses 0.25 g gelatine binder, no additional binder-preparation water, no crosslinking solution, 2.5 mL mineralisation medium, 14 days cultivation, 3 days drying, and no daily maintenance. The non-gel system uses no binder, no binder-preparation water, no crosslinking solution, 70 mL mineralisation medium, 14 days cultivation, 7 days drying, and twice-daily maintenance for 14 days. The alginate system uses 0.375 g alginate plus 1.25 g methylcellulose, 4.625 g water for binder preparation, 20 mL crosslinking solution, 20 mL mineralisation medium, 14 days cultivation, 3 days drying, and no daily maintenance.
The gelatine system required the lowest material and operational inputs. It used a low binder input (0.25 g), a single application of mineralisation medium (2.5 mL) and required neither crosslinking nor daily maintenance.
The non-gel system did not use a binder but required the highest mineralisation medium input (70 mL) and the highest operational input. This resulted from twice-daily application over the 14-day incubation period, corresponding to 28 maintenance interventions.
The alginate system required the highest material input during sample fabrication, including 1.625 g of binder components, 4.625 g of water for hydrogel preparation and 20 mL of CaCl2 solution for crosslinking. However, after fabrication, it required only 20 mL of mineralisation medium and no daily maintenance.
Regarding temporal inputs, all three workflows involved the same incubation period of 14 days but differed in drying duration. The gelatine and alginate samples dried within 3 days, whereas the non-gel samples required 7 days, reflecting the slower drying process within the mould.
Visible cyanobacterial retention
Cell input differed between the two hydrogel systems (gelatine and alginate) and the non-gel system. In both hydrogel systems, cells (OD730 = 0.3) were introduced once during fabrication. In contrast, the non-gel system received inoculated mineralisation medium (OD730 = 0.3) twice daily for 14 days, for a total of 28 applications. As a result, the non-gel system received approximately 28 times greater cumulative cell input and is therefore interpreted separately from the hydrogel systems.
The non-gel system exhibited intensified green pigmentation during incubation and substantial pigment retention after drying. In contrast, both hydrogel systems showed low final visible retention after drying. In the gelatine system, initial green pigmentation gradually faded during incubation and was no longer visible after drying. In the alginate system, green pigmentation intensified during incubation in the mineralisation medium, particularly in the upper layers exposed to light, but largely disappeared after drying.
As this assessment was visual and qualitative, further quantitative measurements of photosynthetic activity are needed to assess cell viability.
Material qualities
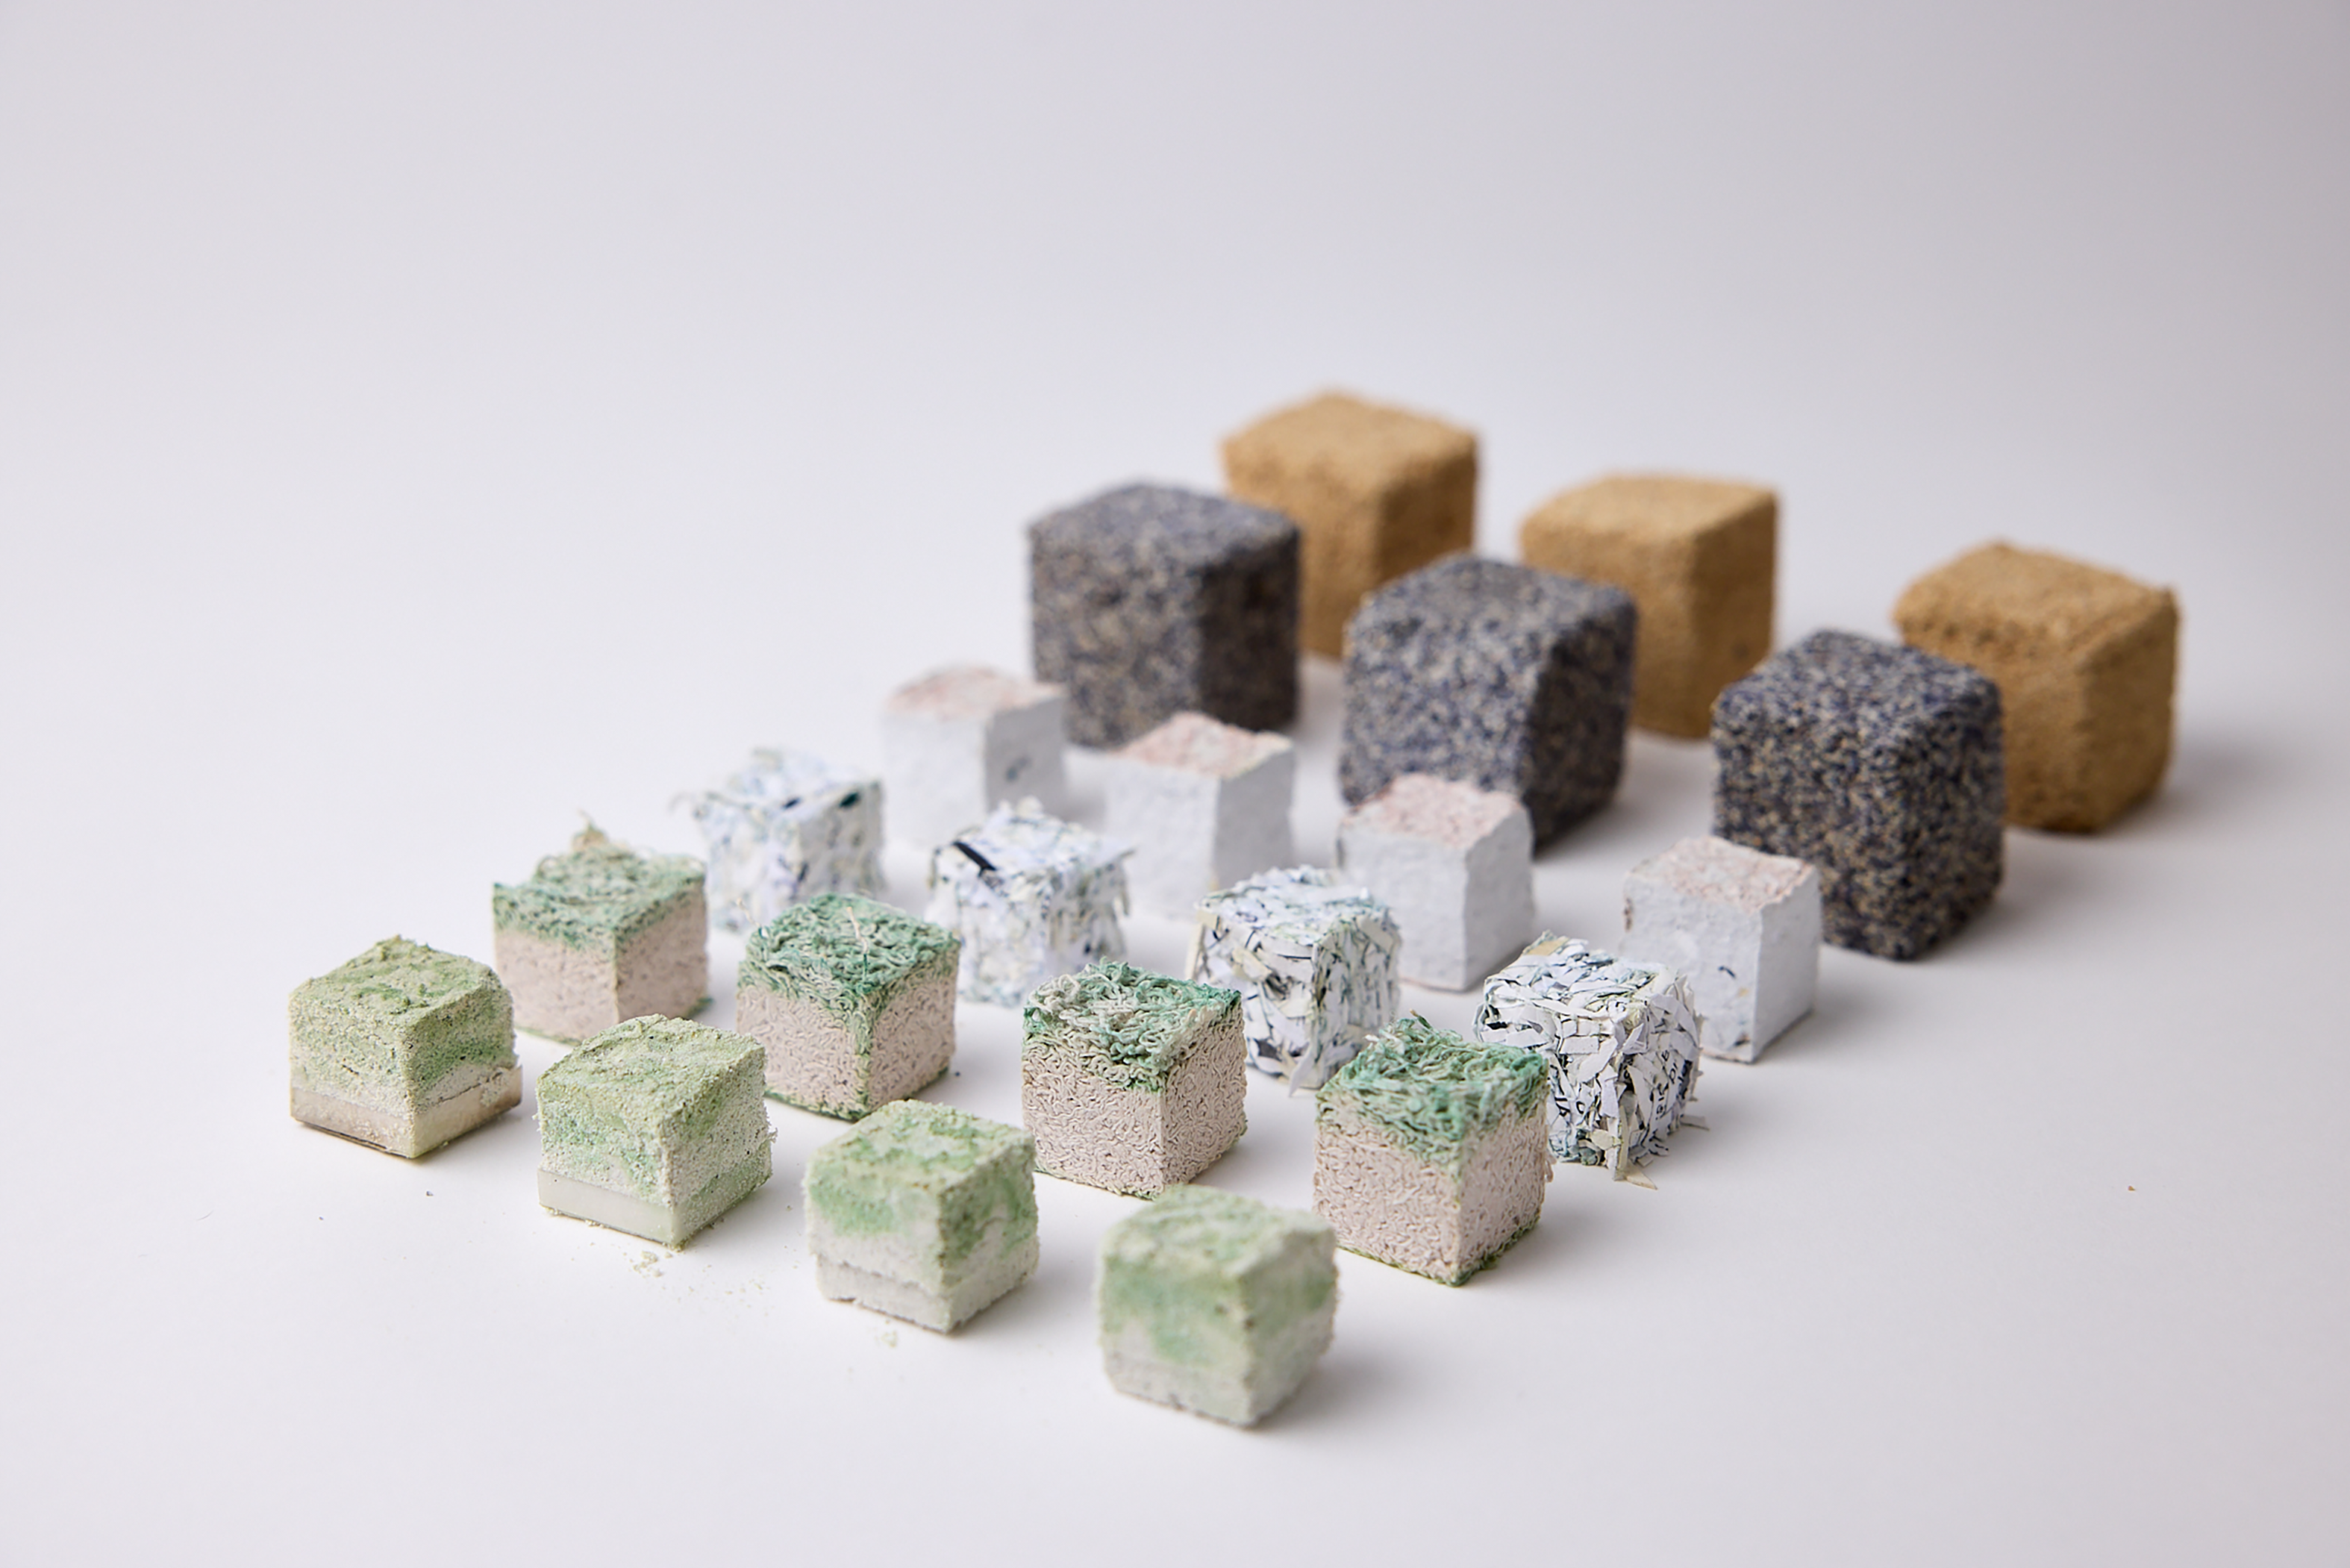
Material qualities differed both between workflows and between waste-derived material types within each workflow. Selected dried material outcomes illustrating differences in material appearance and structural cohesion are shown in Figure 10.
Selected dried material samples from the three workflows, showing visible variation in material appearance and structural cohesion across waste-derived material types. Photograph by Paul Cochrane.

Figure 10. Long description
The figure shows representative dried sample outcomes. In the foreground and middle ground are sixteen non-gel samples, each measuring 2 × 2 × 2 cm. These include molochite (M10), cotton (M7), dried paper (M5), and pulp (M6). All show some degree of consolidation. The molochite samples show green pigmentation on the upper surface. The cotton samples show green pigmentation concentrated mainly in the top layer. The dried paper samples retain a visibly shredded paper texture. The pulp samples have smoother surfaces with slight pink and green colouration on the upper areas. In the background are six larger gelatine-based samples, each measuring 3 × 3 × 3 cm, made from mussel shell (M2) and eggshell (M1). These appear consolidated and show the material character of the shell particles, with little or no visible green pigmentation.
The gelatine system produced the most structurally stable outcomes. Across most waste-derived materials, samples retained their overall cube form after drying, showed comparatively good cohesion and exhibited minimal shrinkage or cracking. The main exception was sawdust (M4), which remained brittle.
The non-gel system produced less robust outcomes than the hydrogel systems. Most samples retained their form after drying and showed no major shrinkage or deformation, but they were generally more brittle and prone to breakage. Cohesion varied by material type. Food waste samples (M1–M3) showed partial integration, with M2 and M3 appearing more cohesive than M1. Sawdust (M4) remained fragile, whereas paper samples (M5–M6) formed stronger structures, likely due to fibre entanglement rather than biomineralisation. Textile samples (M7–M9) and ceramic samples (M10–M11) showed moderate cohesion.
The alginate system exhibited low dimensional stability, with shrinkage observed across samples during drying. Outcomes also varied by material type. Food waste samples (M1–M3), sawdust (M4) and textile samples (M7–M9) generally retained their overall structure and showed some consolidation after drying, although cotton (M7) showed minor cracking. However, paper samples (M5–M6) and ceramic samples (M10–M11) showed shape distortion during immersion incubation.
Preliminary biomineralisation indicators
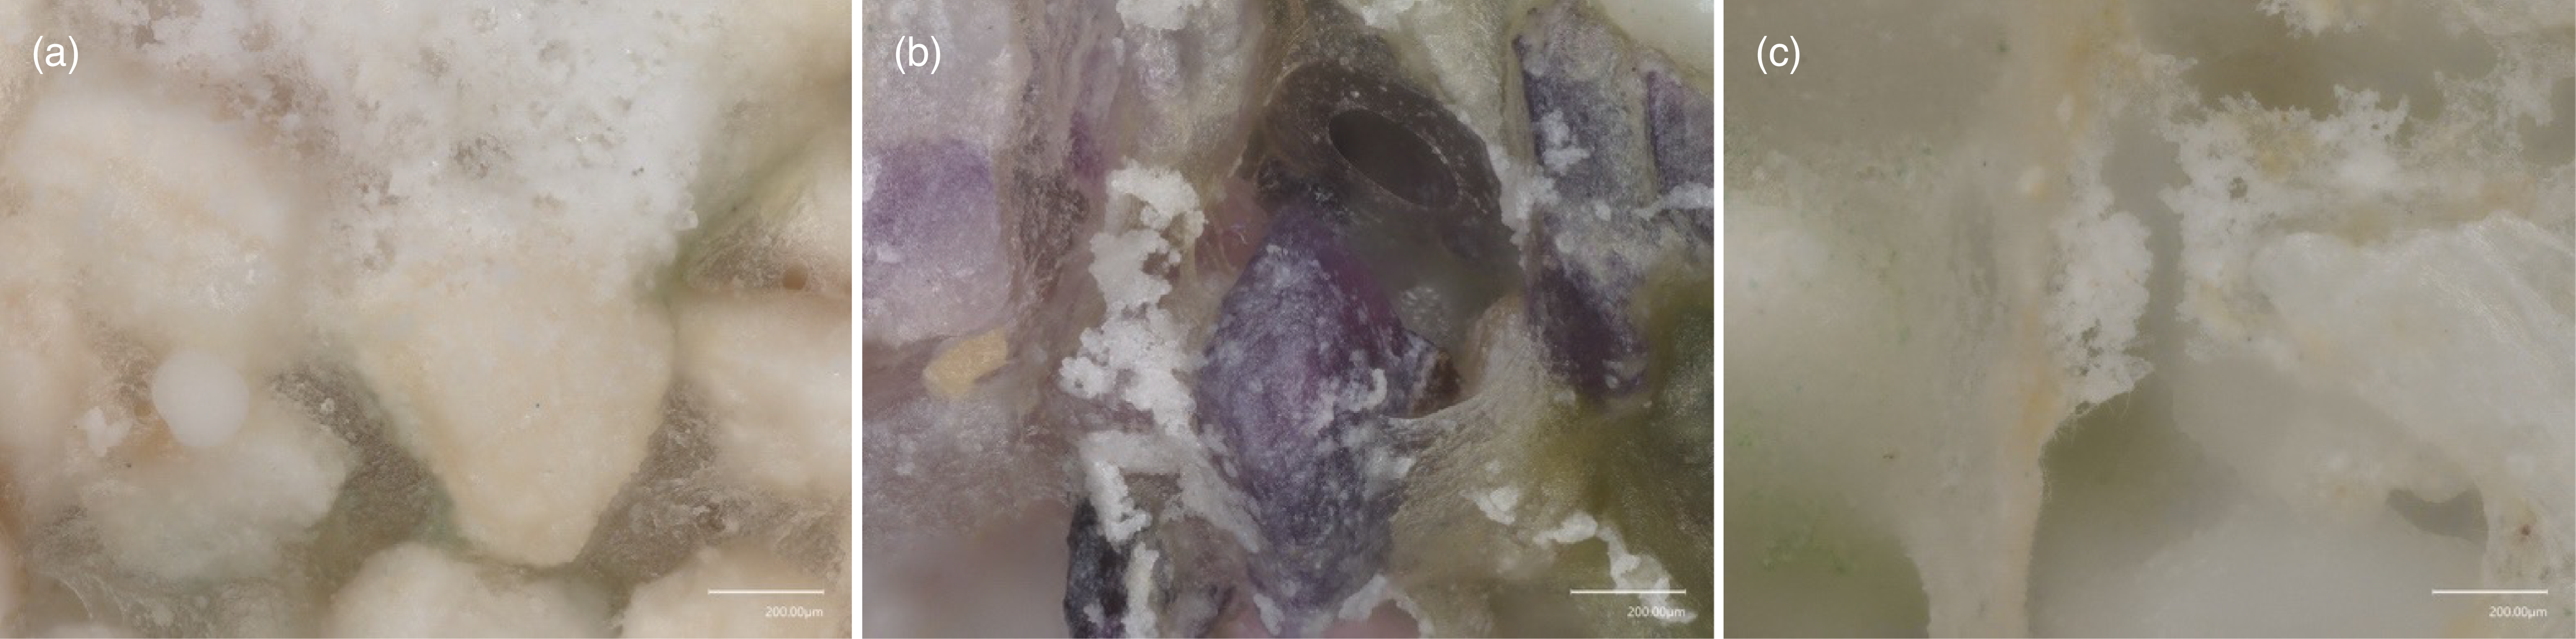
White crystalline features were most consistently observed in the alginate system, less consistently in the non-gel system and rarely in the gelatine system. Figure 11 presents 200 × microscopy details of selected alginate-based samples (M1–M3), in which white crystalline features were visible on the particle surfaces. While these features may indicate biomineralisation, abiotic precipitation during incubation or salt crystallisation from the mineralisation medium during drying cannot be excluded.
Keyence microscopy (200 ×) images of alginate-based samples (Scale bar = 200 μm). (a) M1, (b) M2 and (c) M3.

Figure 11. Long description
The three microscopy panels show surface details of alginate-based food waste samples. Panel a shows M1 eggshell, panel b shows M2 mussel shell, and panel c shows M3 oyster shell. At 200x magnification, the images show particles, greenish pigmentation, and visible white crystalline features on or around the material surfaces. The scale bar in each panel is 200 micrometres.
Selected SEM–EDS observations
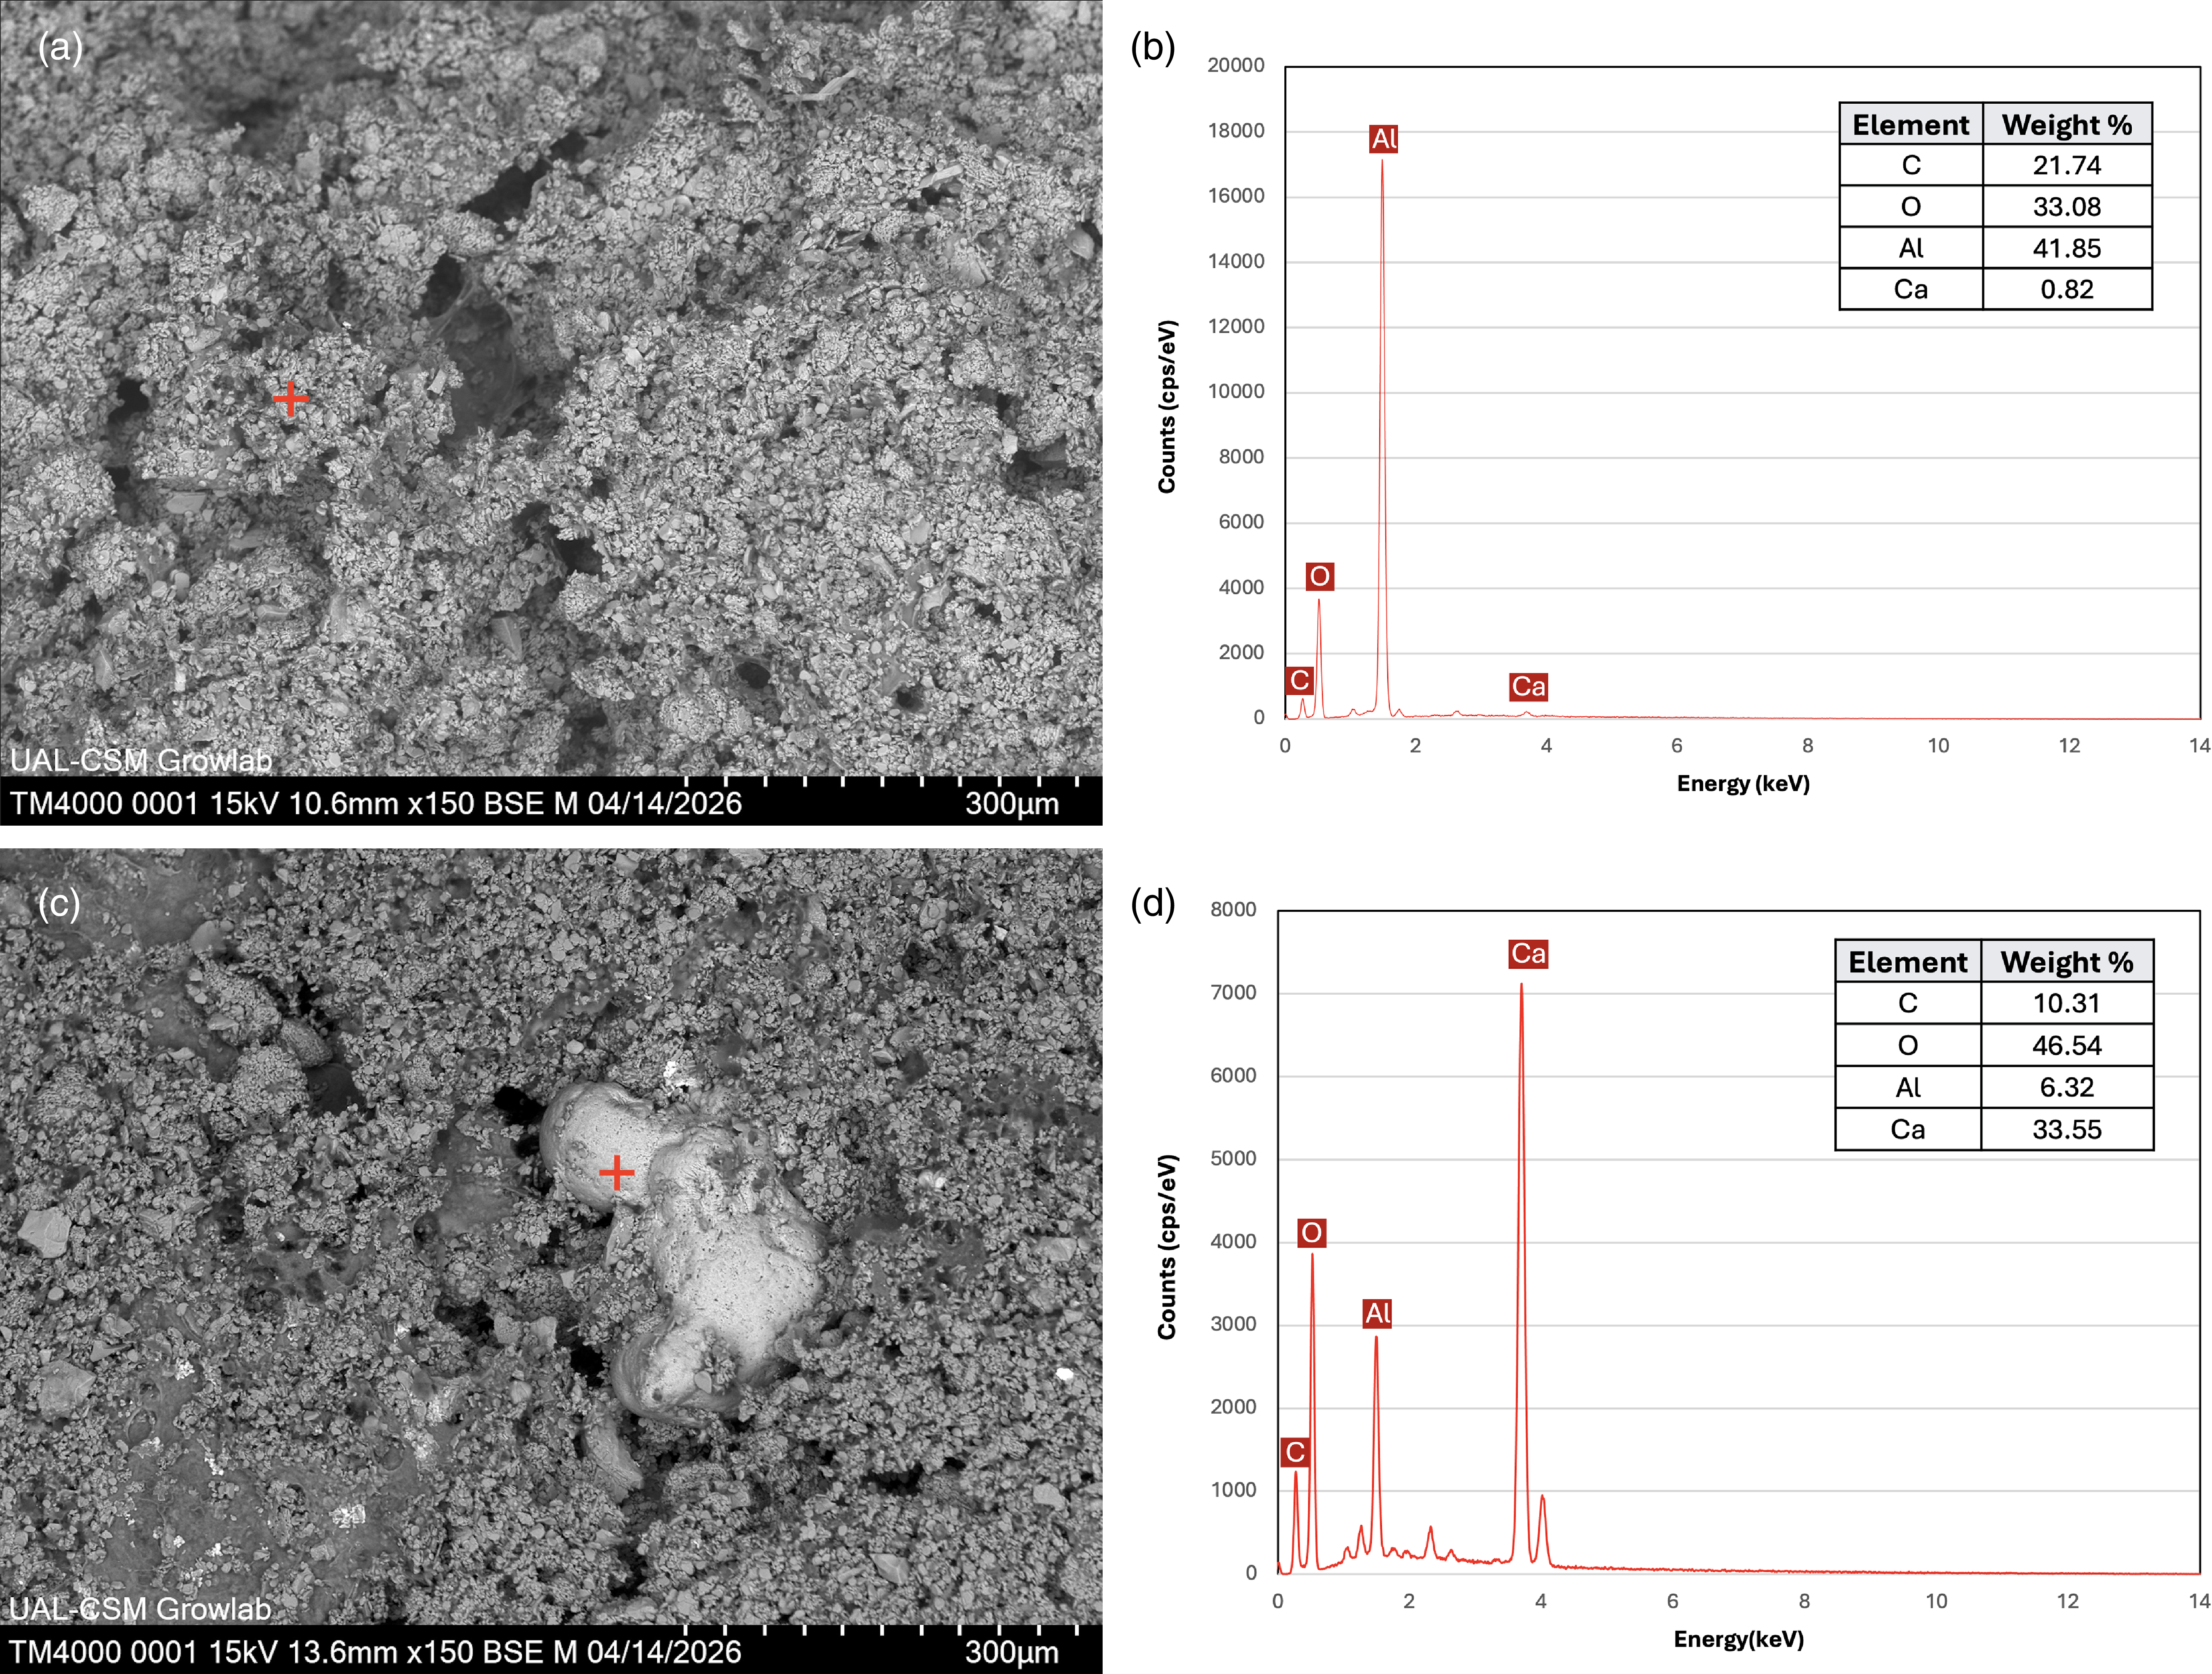
SEM–EDS analysis of selected paired alginate-based M11 samples provided supporting evidence for biomineralisation (Figure 12). The non-inoculated control showed a porous, granular surface and the corresponding EDS point analysis was dominated by aluminium and oxygen. In contrast, the inoculated sample showed rounded surface deposits. EDS point analysis on this deposit indicated a calcium-rich composition, with calcium substantially higher than in the control. However, the analysis did not confirm its mineral phase or whether its formation was biologically mediated. Because the SEM–EDS analysis was limited to a single inoculated sample and its control, these results are interpreted as supporting evidence rather than as conclusive proof of biomineralisation.
SEM–EDS analysis of a pair of alginate-based M11 samples. (a,b) Non-inoculated control and corresponding EDS point analysis. (c,d) Inoculated sample and corresponding EDS point analysis of an isolated rounded surface deposit. Crosses indicate EDS point locations. Scale bars: 300 μm.

Figure 12. Long description
The four-panel figure compares SEM–EDS results from alginate-based M11 ceramic samples. Panels (a) and (b) show the non-inoculated control, with a porous granular surface and EDS results dominated by aluminium and oxygen. Panels (c) and (d) show the cyanobacteria-inoculated sample and EDS analysis of a rounded surface deposit. The deposit shows a strong calcium peak and higher calcium weight percentage than the control. Red crosses mark EDS point locations. SEM scale bars are 300 micrometres.
Discussion
Workflow trade-offs
The comparison shows that no single workflow performed best across all criteria. Rather, each workflow offered a different balance of advantages and limitations.
The gelatine workflow offered an operationally straightforward route for producing stable material samples. It required low material and operational inputs and consistently produced samples with comparatively high structural stability. However, its limitations included the use of an animal-derived binder, low visible cyanobacterial retention after drying and thermal sensitivity during fabrication and incubation.
The non-gel workflow offered a contrasting route. Although it avoided binder use, it required the highest operational demand due to repeated application of the inoculated mineralisation medium. The resulting samples were less robust than hydrogel-based samples, even when they retained their overall form. This system showed the strongest visible cyanobacterial presence, but this was linked to substantial cumulative cell input.
The alginate workflow offered a combined approach. It allowed hydrogel-based fabrication while also enabling further cultivation in mineralisation medium. It showed the most consistently visible preliminary biomineralisation indicators, but the alginate–methylcellulose matrix introduced dimensional instability, including shape distortion during immersion incubation and shrinkage during drying.
Material-specific outcomes
The results also show that workflow performance is not independent of the waste-derived material type. Calcium-bearing carbonate materials tended to support visible crystalline features and partial cohesion. Sawdust remained fragile in several workflows, suggesting that loose particulate materials may require additional binding or structural support. Paper-based materials developed strong cohesion that may result from fibre entanglement rather than biomineralisation alone. Textile and ceramic materials exhibited distinct limitations, including shrinkage, deformation and limited structural support. This suggests that workflow and material selection should be considered together.
Circularity beyond waste-derived material inputs
From a circularity perspective, using waste-derived materials alone is insufficient to define a workflow as circular. The gelatine system reduced operational complexity but relied on an animal-derived binder. The non-gel system avoided binders but increased medium use and daily care. The alginate system avoided animal-derived binders but required higher hydrogel inputs, calcium crosslinking and immersion culture. These trade-offs show that circularity should be assessed across the whole workflow, including material origin, resource use, processing requirements, operational complexity and temporal demands.
Limitations and future directions
Biomineralisation evidence and validation
Although white crystalline features were observed under digital optical microscopy, these observations remain preliminary. SEM–EDS analysis of a pair of alginate-based M11 samples provided supporting evidence of calcium-rich deposits. However, as this analysis was restricted to a single representative sample and its control, it does not validate biomineralisation across all waste-derived materials or across all three workflows. Further characterisation using X-ray diffraction, Raman spectroscopy or Fourier transform infrared spectroscopy is required to confirm the chemical identity and mineral phase of the deposits and to establish stronger evidence of biomineralisation.
Waste-derived material function and calcium contribution
The selected waste-derived materials provided compositional and physical diversity, enabling comparison of the three biofabrication workflows across a range of material properties. In this study, material classification was based on reported composition. However, the specific contribution of each waste-derived material to biomineralisation was not directly examined. Further work is needed to clarify how the calcium availability in waste-derived materials influences biomineralisation performance.
Media dependency and circularity constraints
All three workflows required cyanobacterial biomass and synthetic mineralisation media, while the non-gel workflow additionally required repeated applications of inoculated medium. This dependency limits the system’s circularity, even when waste-derived materials are used as inputs. As previously discussed, replacing synthetic media with waste-derived nutrient streams may help reduce this dependency (Shin et al. Reference Shin, Archer, Malpass and Collet2026). Preliminary tests demonstrated that vermicompost leachate can support the growth of Synechococcus sp. PCC 7002 under controlled conditions, but further work is needed to determine whether it can also function as a mineralisation medium for CaCO3 precipitation.
Geometric constraints, light penetration and design implications
White crystalline features and green pigmentation were observed mainly near the surface, with limited evidence inside the samples. This suggests that the cube geometry restricted light penetration, potentially limiting cyanobacterial activity and biologically mediated mineral precipitation within the material. Thick, solid forms may therefore be less suitable for photosynthetic biomineralisation. Future work will therefore explore alternative geometries that improve light access and air exchange, such as porous, layered or modular structures.
Conclusion
This paper compared three cyanobacteria-integrated photosynthetic biomineralisation workflows: the gelatine, non-gel and alginate systems across waste-derived materials. By applying these workflows to the same set of eleven waste-derived materials, the study developed three parallel material collections. These collections serve as comparative design research artefacts, enabling assessment of both the fabrication process and material outcomes of each workflow. The three workflows were assessed using five criteria: workflow feasibility, resource inputs, visible cyanobacterial retention, material qualities and preliminary biomineralisation indicators.
The comparison shows that each workflow offers distinct trade-offs in biofabrication processes and material outcomes. The gelatine system provided the most reliable casting and handling stability but introduced limitations related to the use of an animal-derived binder, thermal sensitivity and weak visible retention of cyanobacterial pigmentation. The non-gel system reduced binder dependence and showed the strongest visible cyanobacterial pigmentation but required greater medium input and more frequent care. The alginate system supported hydrogel-based fabrication and immersion cultivation and showed the most consistently visible preliminary biomineralisation indicators but showed drying shrinkage and partial material deformation.
The study also highlights that the use of waste-derived materials alone does not make a workflow circular. Circularity must be considered across the whole biofabrication system, including not only material origin but also resource and operational demands. Future work will examine how these workflows can be developed to achieve greater circularity, particularly by using waste stream-derived nutrient sources. The next stage will also include geometric studies to improve light access and air exchange, together with further mineralogical and biological analyses to confirm biomineralisation and quantify cyanobacterial activity.
Overall, this study suggests that photosynthetic biomineralisation should be understood not as a single material solution, but as an interconnected biofabrication process shaped by cells, materials, media, binders and incubation conditions. By identifying the trade-offs between the gelatine, non-gel and alginate systems, this study offers an initial basis for adapting photosynthetic biomineralisation workflows towards circular product design.
Data availability statement
The data supporting the findings of this study are included within the article.
Acknowledgements
Most experiments were conducted in the Grow Lab at Central Saint Martins, University of the Arts London. The authors gratefully acknowledge the technical support of Barbara Paes, Paula Corsini and Shem Johnson from the Grow Lab. We also thank Dr Alex Ball and the Natural History Museum, London, for facilitating access to SEM equipment and supporting the SEM–EDS analysis conducted in the Grow Lab. Paper and textile waste materials were provided by the CSM Publication Workshop and Knit Workshop, while ceramic waste materials were supplied by Mantec Technical Ceramics. We are grateful to Paul Cochrane for photographic documentation. Figure 4 was created using BioRender.com. ChatGPT was used to assist with improving clarity and readability.
Author contributions
Conceptualisation: Hyejo Shin; Carole Collet; Lorraine Archer; Matt Malpass; Alice Taylor. Methodology: Hyejo Shin; Carole Collet; Lorraine Archer. Data curation: Hyejo Shin. Data visualisation: Hyejo Shin. Writing original draft: Hyejo Shin. All authors approved the final submitted draft.
Financial support
This research received no specific grant from any funding agency, commercial or not-for-profit sectors.
Competing interests
None.
Ethical standards
Ethical approval and consent are not relevant to this article type.

 Open access

