NOMENCLATURE
- wm
-
allowable crosswind magnitude
- cw
-
allowable crosswind component
- CW
-
number of crosswinds that exceed allowable limits
- i
-
wind direction
- j
-
magnitude of wind velocity
- r
-
radius of the wind rose
- TW
-
total number of wind observations
- UF(α)
-
usability factor for runway direction α
- α
-
angle between true north and the centre line of the runway template
- ϴ
-
angle giving the directions completely covered by runway template
1.0 INTRODUCTION
The airport facilities such as passenger terminals, taxiways/apron configurations, circulation roads and parking areas are located according to the runway direction. The wind direction and magnitude of wind speed strongly influence the runway orientation and number of runways in the airport. The aircraft landing and take-off operations for a given aircraft are considered safe only when the wind component at right angles to the direction of travel is less than the maximum allowable crosswind of that aircraft. This allowable crosswind largely depends upon the size and operating characteristics of aircraft(Reference Mousa1).
The Federal Aviation Administration (FAA) and the International Civil Aviation Organization (ICAO) recommend that runways should be oriented so that the usability factor of the airport is not less than 95%. The usability factor is the percentage of time during which the use of the runway system is not restricted because of an excessive crosswind component(Reference Ashford, Mumayiz and Wright2). Allowable crosswind components are the basis for the airport reference code associated with the critical aircraft that has the shortest wingspan or slowest approach speed. When the wind coverage is less than 95%, a crosswind runway is recommended(Reference Horonjeff, McKelvey, Sproule and Young3).
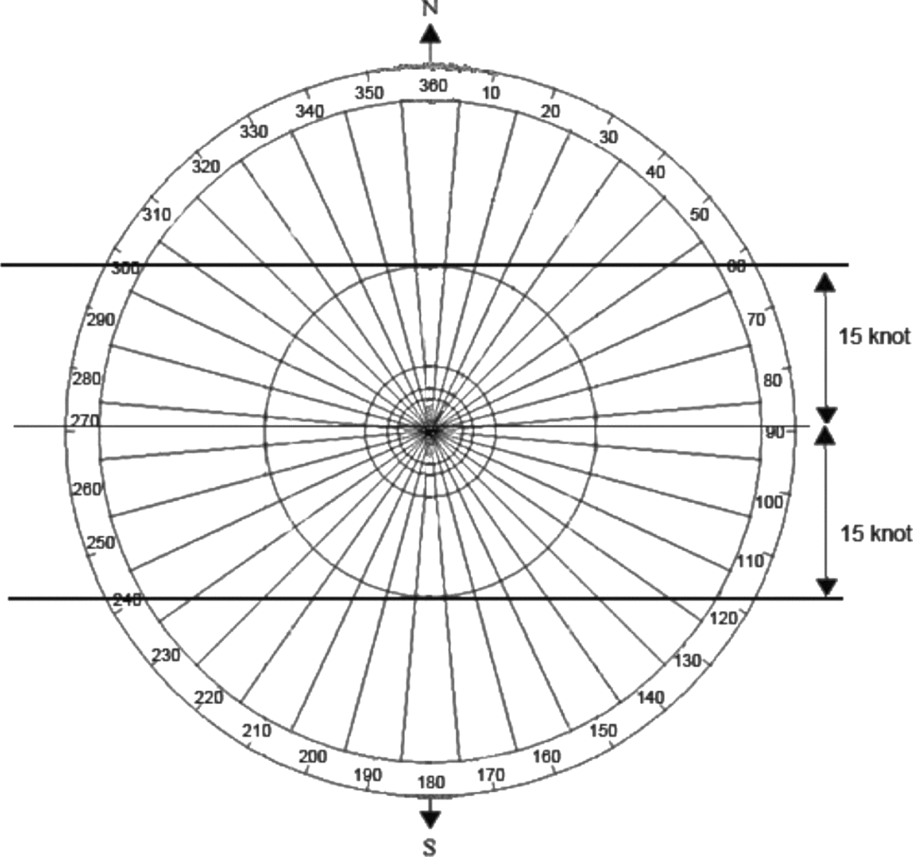
Once the maximum allowable crosswind component is selected, the most desirable direction of runways for wind coverage can be determined by examining the average wind characteristics at the airport. A wind analysis should be based on reliable wind distribution statistics that extend over as long a period as possible, preferably for at least five years. The wind data are arranged according to velocity, direction and frequency of occurrence. The appropriate orientation of the runway or runways at an airport can be determined through graphical vector analysis using a wind rose. A standard wind rose consists of a series of concentric circles cut by radial lines using polar coordinate graph paper. The radial lines are drawn to the scale of the wind magnitude such that the area between each pair of successive lines is centred on the wind direction(Reference Ashford, Mumayiz and Wright2,Reference Horonjeff, McKelvey, Sproule and Young3) . On a template, three equally spaced parallel lines have been plotted. The middle line represents the runway centreline, and the distance between the centreline and each outside line is, to scale, the allowable crosswind limit. As seen in Fig. 1, the template is placed over the wind rose in such a manner that the centreline on the template passes through the centre of the wind rose. Optimum directions can be determined from this wind rose by rotating the template, until the sum of the percentages included between the outer lines is at a maximum. When one of the outer lines on the template divides a sector of wind direction and magnitude, the partially covered sector is estimated visually(Reference Horonjeff, McKelvey, Sproule and Young3).
Edited version of FAA's wind rose.

The FAA(4) has developed a computer program for determining the runway orientation as part of the airport design software. The program provides a spreadsheet for calculating the percentage of wind coverage given inputs of wind data and runway direction specified by the user. Although this program is capable of calculating wind coverage precisely, optimising the orientation of two-runway configurations, the optimum wind coverage can be computed after manually pre-setting and solving all the runway orientations one by one. The same method may be repeated for each combination of the first and second runway until the combined wind coverage reaches the usability factor's requirements(Reference Change5).
Mousa and Mumayiz(Reference Mousa and Mumayiz6) developed a computer model called WNDROS based on a mathematical formulation using AutoCAD which transfers circles and radial lines of the wind rose method into points with numeric coordinates. In determining the wind coverage for a given runway direction, the model calculates the areas of sectors covered, fully or partially, by the runway template and determines a factor for adjusting the wind data of covered sectors. Having obtained the adjusted percentages of wind for all sectors, the model then calculates overall wind coverage of the runway by summing the adjusted wind percentages of all sectors covered by the runway template.
Mousa(Reference Mousa7) improved the WNDROS model and developed an integrated computer model (WNDROS2) for optimising runway orientation at airports with two-runway configurations. A new mathematical formulation was developed to calculate areas of individual sectors covered by the second runway template, as well as areas of sectors in the overlap of the two-runway templates. New features also were included in this model to evaluate wind coverage for preselected runway orientations for any setup of wind data, wind speed groups, and crosswinds. In the next study, Mousa(Reference Mousa1) enhanced WNDROS programs by converting its code into Visual BASIC to provide the user interface and other features. A revised VB-WNDROS model, which runs through a driven menu with a graphical user interface, was developed.
Jia et al(Reference Jia, Chung, Huang, Petrilli and The8) developed a system called airport runway optimisation (ARO) to determine the optimum runway orientation based on geographical information systems (GISs). The ARO system uses the GIS-based wind rose method with customised GIS functions and database management tools to determine the optimum runway orientation. The ARO system creates a GIS-based wind rose, loads wind data from the wind databases into the wind rose and executes the selected optimisation process. The method avoids intensive geometric computations involved in solving the partial coverage problem by taking advantages of GIS functions.
Sarsam and Ateia(Reference Sarsam and Ateia9) proposed a computer program for the management of airport design that also provides instant information regarding the optimum runway orientation, location and length. The software developed is tested for output accuracy using the data of three existing national and international airports in Iraq.
Chang(Reference Chang10) developed a computer model that can provide a combination of acceptable runway orientations, changing the allowable crosswind limit flexibly and determining the optimal orientations of two-runway configurations. Instead of visual estimation or geometric computation, an analytical method for wind coverage analysis is provided in this study. The model allows the runway orientations to be traded off with additional factors such as available land, existing obstructions, topographic difficulties, flight path interference among runways and airports, noise pollution and other environmental impacts while satisfying the operational requirements of aircraft for landing and take-off. In the next study, Chang(Reference Change5) developed an enhanced version of this model for multiple runway configurations.
Bellasio(Reference Bellasio11) provided a methodology to evaluate the effect of gust in optimum runway orientation. In the study, the wind data of three different airports are analysed as the case studies, considering both observed values and estimated gusts. The analysis of the wind data and the graphical representations are obtained by means of the WindRose PRO3 software, which is the enhanced version of FAA's wind rose methodology.
Laat and Roling(Reference Laat and Roling12) proposed a model which can be used for a runway location and orientation suitability analysis, in combination with GISs. The model takes into account the population density, noise, wind, infrastructure and terrain. This study focuses primarily on the factors affecting the runway location instead of the optimisation of runway orientation.
Oktal and Yildirim(Reference Oktal and Yildirim13) developed a new model called CORO (Calculation of Optimum Runway Orientation) with an approach different from the studies mentioned above. In all these studies, the determination of optimum runway orientation is based on the FAA's conventional wind rose method, and it is presumed that wind data assigned to each cell on the wind rose are distributed uniformly according to the assumption of the FAA(4). This assumption may decrease the accuracy of the results obtained, especially from the data sets containing the non-uniform distribution of wind magnitudes. Alternatively, in the CORO model, the number of wind observations is used directly in the calculations without grouping wind velocities; the use of wind percentages is also excluded. Thus, the errors arising from the partial coverage problem and the FAA's assumption for wind rose method are eliminated.
Although the CORO model accurately determines the optimum runway directions and usability factors, this version has limited capability and flexibility for computing usability factors for multiple scenarios and predefined runway configurations. The runway orientation is determined not only by wind but also by some other factors. The optimum runway direction given the largest value of usability factor may not be convenient in all conditions. The constraints such as obstacles located on take-off and landing trajectory, topographic difficulties for the construction of runway, noise impact, flight path interference among runways and airports and some other environmental limitations cause the selection of a runway direction which is different from the optimum.
This study presents a new tool for optimising wind coverage and runway orientation. While the previous model can only calculate and display the optimum runway orientations for two/three-runway configurations, the new model called TORO (Tool for Optimum Runway Orientation) can calculate and visualise the usability factors for all directions and for any allowable crosswind component. The TORO Model also provides the solutions for single-, two- or three-runway configurations predefined by user according to the constraints on the runway alignment(s). Consequently, in the TORO model, the problem of optimising runway orientation is solved with an approach different from the previous model to gain flexibility and new capabilities. The equation set developed for the calculation of the usability factor can be used to find out not only the wind coverages of the first runway template but also the wind coverages of second and third runway templates.
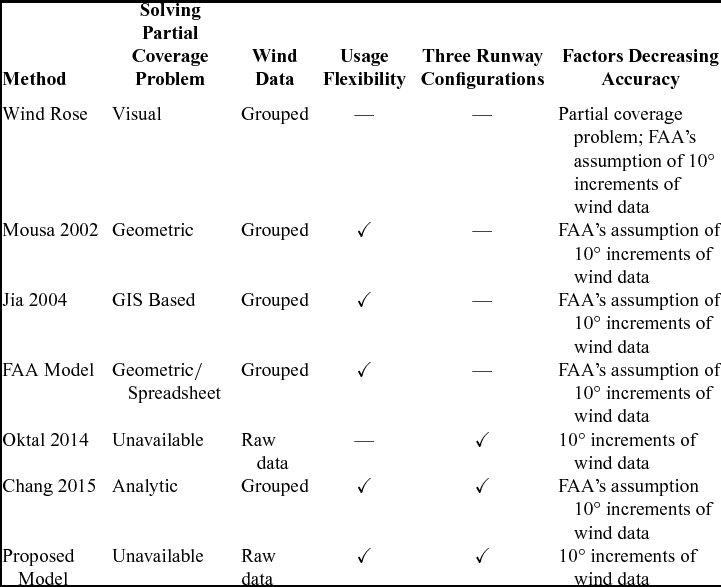
Another novelty in the proposed model is the usage of allowable crosswind magnitude as the variable instead of the allowable crosswind component. In the new model, the selected crosswind component is transformed into a crosswind magnitude of which the value changes with 10° increments. In this way, the accuracy of the proposed model is increased. The raw wind data are similarly used in the new model to eliminate the potential error sources in wind rose method. The feature comparison of the major previous studies and the proposed model are summarised in Table 1. The detailed presentation of the proposed model is given in the following sections.
Comparison of the previous studies and the proposed model

2.0 PRESENTATION OF USER INTERFACE
The new computer model named TORO is written in CSharp (C#), which is a Windows-based application. The proposed model provides the solutions for two types of analyses – the first for finding out automatically the optimum runway configuration giving the largest usability factor, and the second for determining the suitable runway directions according to the preselected runway configurations. The first and the second analyses consist of four and six calculation steps respectively. The calculation process of runway orientations and usability factors for both analyses are explained below:
-
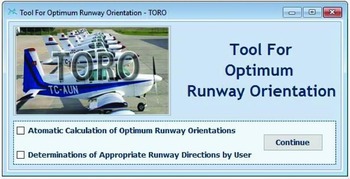
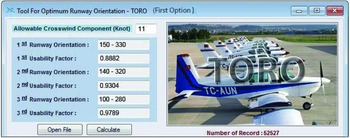
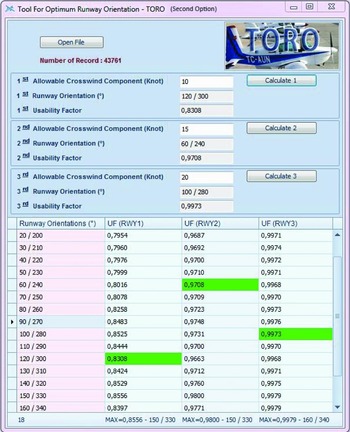
1. Selecting the type of analysis. The user can select one of two options for calculating the usability factor and runway orientations by clicking on the related button. The main page of the user interface (the start-up screens of the first and the second types of analysis) are depicted in Figs 2, 3 and 4, respectively. On the screen of the first analysis option, the optimum orientations of the primary runway and the crosswind runways (if necessary) and their usability factors are displayed as seen from the example given in Fig. 3. The screen of the second analysis presents the more detailed computational results and provides the selection boxes to evaluate the different alternatives of three-runway configurations. Although the screen designs are different, the following two calculation steps are mainly the same for both types of analysis.
-
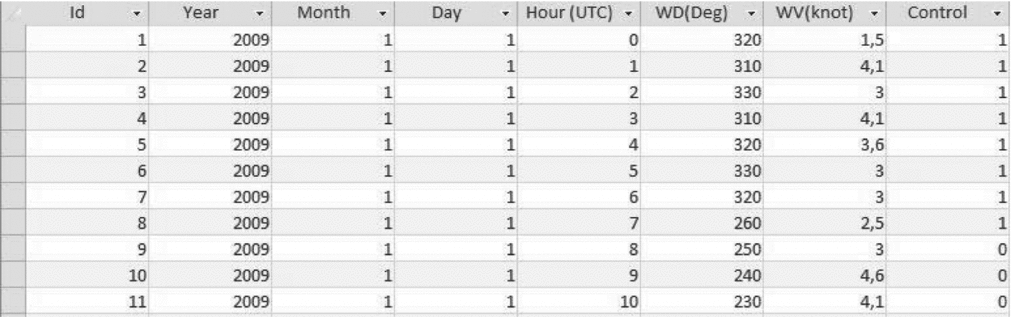
2. Loading the wind data for the selected site. The wind data table, which contains station number, date and time of observation, wind velocity and wind direction, is prepared in Microsoft Access format. This format is chosen to prevent double counting of any wind data during the calculation process. A small part of a wind data set is illustrated in Fig. 5. Related wind data can be browsed via computer and imported into the program by clicking on the ‘Open File’ button. After the wind data are loaded into the program, the total number of records is displayed at the right bottom part of the screen of the first analysis option and at the top of the screen of the second. All wind observations are coded as 0 in the Access table before the calculations.
-
3. Entering the allowable crosswind component. Determination of the allowable crosswind(s) is critical, and it forms the basis of the airport reference code(Reference Ashford, Mumayiz and Wright2). The selected allowable crosswind component is entered in designated fields of the selected type of analysis. While the computation steps performed for the determining optimum runway orientations are based on the same values of the crosswind component in first analysis option, the computations for preselected runway configurations can be performed with preferred values in the second.
-
4. Calculation of the usability factor for the first runway. If the automatic calculation of optimum runway orientations is selected as an option from the main page, the optimum orientation in degree for the first runway and the largest value of usability factor appear on the screen by clicking on the ‘Calculate’ button. If the usability factor is more than 95%, the computation process for the first type of analysis is terminated. Otherwise, as illustrated in Fig. 3, the usability factor is calculated until its value reaches more than 95% for the second runway orientation (and the third if needed). In case of the second option, the results appear at the second column ‘UF (RWY1)’ of the table located at the bottom part of the screen as depicted in Fig. 4. Among the results, the largest or preferred value of the usability factor and its direction are assigned to ‘1st Runway Orientation’ and ‘1st Usability Factor’ fields by double-clicking on the selected usability factor. This feature of the TORO model allows the user to select any runway direction among 18 alternatives for the following computations for second and third runway orientations. After this selection, the wind records covered by the template of the first runway are coded as 1 in the Access table.
-
5. Calculation of the usability factors for two-runway configurations. After entering the second allowable crosswind component in the designated box, the usability factors for all directions are displayed at the ‘UF (RWY2)’ column of the table by clicking on the ‘Calculate 2’ button. The wind observations, which are counted as crosswinds for the first runway orientation and which are just covered by the second runway template, are added to the wind coverage of the first template in order to calculate the new usability factor. Additional wind records are coded as 1 in the Access table to calculate the usability factor of a two-runway configuration. This process is repeated for each direction.
-
6. Calculation of the usability factors for three-runway configurations. After the selection of the usability factor of preferred two-runway configuration and then entering the third allowable crosswind component, the preferred orientation of the third runway and its usability factor are selected among the results listed in the fourth column of the table by clicking on the ‘Calculate 3’ button. As illustrated in Fig. 4, the runway directions selected by the user and their usability factors are highlighted on the screen. After each step of calculations, the largest value of the usability factor and its direction are also displayed in the last line of the results table. The computations performed in Steps 5 and 6 are on-demand execution processes in line with the requirements. The user can terminate or change the calculation process in any step.
Main page of user interface.

The illustration of first analysis screen.

The illustration of second analysis screen.

Wind data table in Access format.

3.0 STRUCTURE OF THE MODEL AND CALCULATION OF USABILITY FACTOR
In the model, the wind rose of FAA, which is composed of 36 wind directions, is used without grouping the wind magnitudes. The radius of the wind rose (r) is taken at 100 Kn (nautical miles per hour), which is the maximum wind velocity for the following calculations. The runway template defined by the allowable crosswind component is rotated automatically around the centre of the wind rose, with 10° differences starting from the true north. The usability factor is calculated accordingly for 18 different directions of the runway template. The calculation of the usability factor can be expressed by the following equations:
 $$\begin{eqnarray}
UF(\alpha ) = \frac{{\sum\limits_{{{i}} = {{0}}}^{{{360}}} {\sum\limits_{{{j}} = {{0}}}^{{{100}}} {{{T}}{{{W}}_{{{ij}}}} - } {{ }}C{W_T}(\alpha )} }}{{\sum\limits_{{{i}} = {{0}}}^{{{360}}} {\sum\limits_{{{j}} = {{0}}}^{{{100}}} {{{T}}{{{W}}_{{{ij}}}}} } }},
\end{eqnarray}$$
 $$\begin{eqnarray}
C{W_T}(\alpha ) &=& \sum\limits_{{{i}} = \theta }^{{{90}}} \sum\limits_{{{j}} = {{w}}{{{m}}_{{1}}}(i)}^{{{100}}} {{{C}}{{{W}}_{{{ij}}}}(\alpha ) + } {{ }}\sum\limits_{{{i}} = {{90}}}^{{{180 - }}\theta } {\sum\limits_{{{j}} = {{w}}{{{m}}_{{2}}}(i)}^{{{100}}} {{{C}}{{{W}}_{{{ij}}}}} } (\alpha )\nonumber\\
&& +\; \sum\limits_{i = 180 + \theta }^{270} {\sum\limits_{j = w{m_3}(i)}^{100} {C{W_{ij}}(\alpha ) + \sum\limits_{i = 270}^{360 - \theta } {\sum\limits_{j = w{m_4}(i)}^{100} {C{W_{ij}}(\alpha )} } } } ,
\end{eqnarray}$$
where α = 0°, 10°,. . ., 170° is the angle between true north and the centre line of the runway template; i = 0°, 10°,. . ., 360° is the wind direction; j = 0, 1,. . ., 100 is the magnitude of wind velocity; TW is the total number of wind observations; CW is the number of crosswinds that exceed allowable limits; cw is the selected allowable crosswind component; wm is the allowable crosswind magnitude; and the angle θ giving the directions completely covered by the runway template.
In Equation (1), the usability factors for each direction α are calculated by dividing the wind coverage of the runway template by the total number of wind observations. Each wind observation that exceeds the allowable crosswind limit and that blows from the directions outside the region determined by the angle θ from both sides of the runway centre line is counted as a crosswind. The wind coverage of a template for each direction α is computed by subtracting the number of crosswinds from the total number of wind observations. Since the magnitude of the allowable crosswind (wm) changes with 10° increments starting from the angle θ, the number of crosswinds is separately calculated for each quadrant and then the wind observations which are counted as crosswind are accumulated as seen in Equation (2). The following equations describe the variation of allowable crosswind magnitudes in each quarter circle. If the calculated value of allowable crosswind magnitude is fractional, it is rounded to the nearest integer.
 $$\begin{equation}
w{m_1}(i) & =& \frac{{cw}}{{\sin{{ (}}i)}},\\
\end{equation}$$
 $$\begin{equation}
w{m_2}(i) & =& \frac{{cw}}{{\cos(i - 90)}},\\
\end{equation}$$
 $$\begin{equation}
w{m_3}(i) & =& \frac{{cw}}{{\sin(i - 180)}},\\
\end{equation}$$
 $$\begin{equation}
w{m_4}(i) & =& \frac{{cw}}{{\cos(i - 270)}}
\end{equation}$$
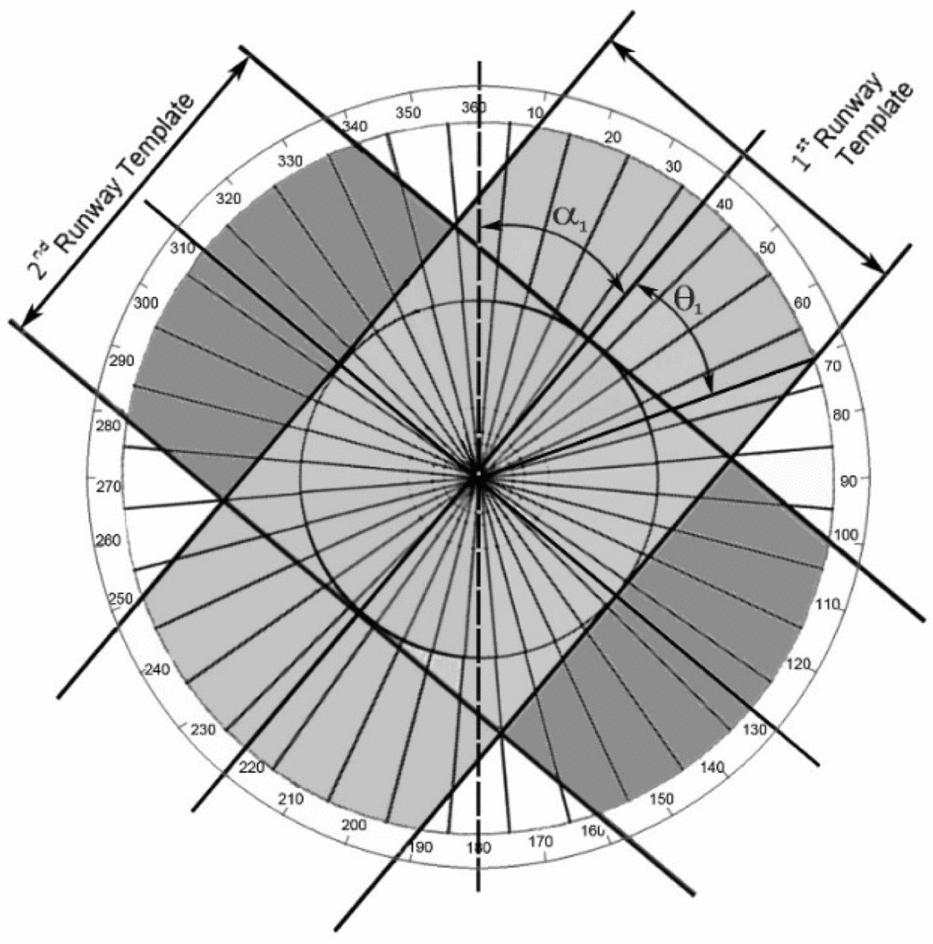
As illustrated in Fig. 6, angle θ, defined for the determination of wind directions excluding the crosswind component, is computed in the following equation:
 $$\begin{equation}
{\it \theta = {\rm arcsin}} \frac{{cw}}{r},
\end{equation}$$
where cw is the allowable crosswind component and r is the radius of the wind rose. The directions that may contain crosswinds exceeding the allowable limits can be determined by Equation (7). Since wind data are arranged according to the directions which are divided into at least 10° increments, angle θ, which gives the directions that are completely covered by the runway template, is rounded to the nearest multiple of 10°(Reference Oktal and Yildirim13). The equation set defined above can be used in both types of analysis not only for single-runway orientations but also for two- and three-runway configurations.
Determination of directions completely covered by the runway template.

In the first analysis option mentioned above, after the highest value of the usability factor and the optimum runway orientation are determined; if the usability factor is less than 95%, the calculation in this condition is performed for the second and the third optimum runway orientations until a value greater than 95% is obtained. The wind observations, which are counted as crosswinds for the first runway orientation and are covered by the second runway template, are added to the wind coverage in the first template in order to calculate the new usability factor. If the usability factor is still less than 95%, the same process is repeated for determining the third runway orientation(Reference Oktal and Yildirim13).
In the second option, the computational results obtained from the equation set are listed for 18 directions. After the selection of both the preferred runway direction among 18 results and the second allowable crosswind component, the usability factors for two-runway configurations are calculated. As mentioned above, the same calculation process is performed for the third runway orientation. Finally, the preferred value among the usability factors computed for each runway direction α is selected. Since some wind observations may be covered by two or three templates, the wind records first covered by a template are coded as 1 to eliminate double counting of wind observations. The wind statistics are consequently prepared in Access format. This feature of Access tables enables the user to compute the cumulative wind coverages of two- and three-runway configurations by using the same equation set.
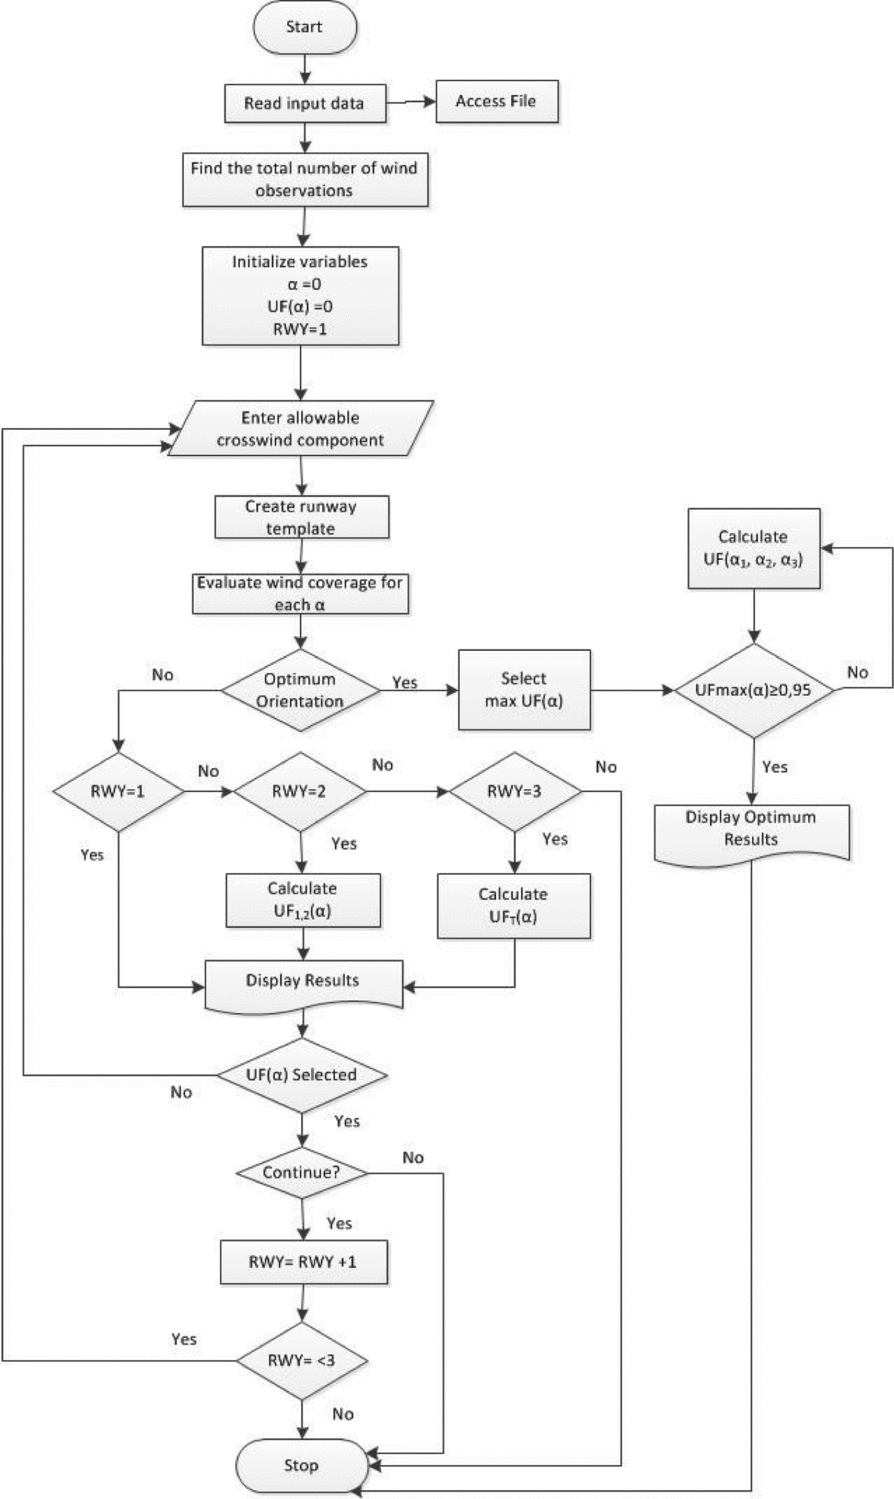
The flowchart shown in Fig. 7 illustrates the execution process of the TORO model for the determination of optimum runway orientations. As depicted in the flowchart, in the ‘Optimum Orientation’ step, if requested, the largest value of usability factor and optimum runway orientations can be found automatically without any user intervention. In the ‘UF(α) Selected’ step, computation of the usability factors can be renewed by changing runway configuration and the value of the allowable crosswind component. The calculation can also be furthered to compute the usability factors for two- and three-runway configurations. The ‘Continue’ step allows the user to terminate the computation process depending on his or her preferences.
Flowchart of TORO model.

4.0 MODEL VALIDATION
The model developed is tested with three numerical examples. The wind data set connected to Istanbul Ataturk Airport is used in all analyses. In the first example, the optimum runway orientations calculated both from the proposed model and the conventional wind rose technique are compared to verify the reliability of the new model. In the second analysis, the wind data set used for the first example is modified to prove how the FAA assumption mentioned above decreases the accuracy especially in the case of non-uniform distribution of wind observations. The flexibility of the TORO model is demonstrated in the last example.
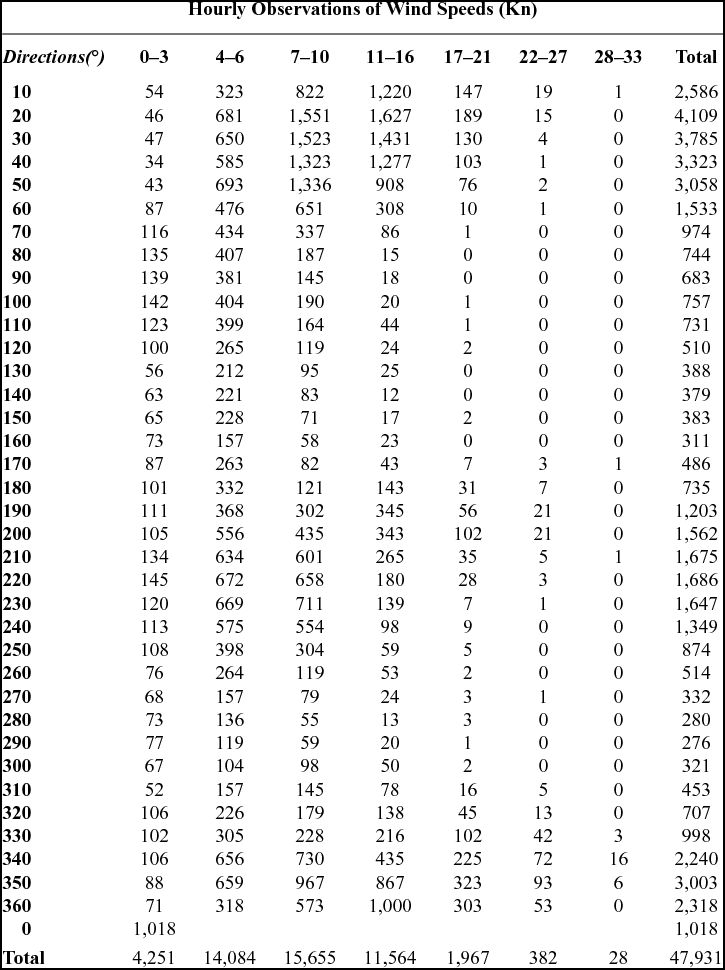
The wind data set of Istanbul Ataturk Airport containing 47,931 records incorporating the years 2009-2014 is provided from the General Directorate of Meteorological Service in Turkey. In the first analysis, while the wind records of the Ataturk Airport are loaded directly to the program in Access format for calculations using the TORO model and the same data set is grouped according to the wind velocities for the analysis performed in FAA's wind rose method. The grouped wind data set of Istanbul Ataturk Airport is given in Table 2. The optimum runway orientation problem is solved with both techniques by taking into account an allowable crosswind component as 10 Kn. For calculations using the wind rose method, AutoCAD is used to measure graphically the areas of fractional sectors of the wind rose. Since all researchers focus on eliminating the partial coverage problem, the results obtained from the AutoCAD program are also significant for other existing models.
The grouped wind data set of Istanbul Ataturk Airport

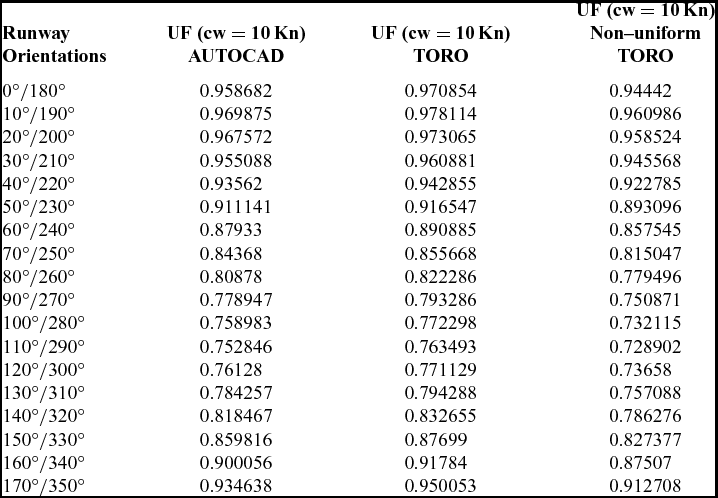
The optimum runway orientation is found to be 10°/190° from both techniques, with usability factors of 97.81% from the TORO model and 96.98% from the wind rose method. We believe that the difference in the usability factor values calculated from the two methods originates with the FAA's assumption mentioned previously. If the number of partially covered cells and their wind percentages increase, the accuracy of the analysis results obtained from the wind rose method would decrease. The error arising from the FAA's assumption cannot be measured by a grouped wind data set. The analyses performed with ungrouped raw wind data sets would give the better results in the TORO model.
In this framework, the second analysis is performed to demonstrate the sensitivity of the TORO model to non-uniform distributions of wind observations. The wind data set used in the first analysis is modified for this purpose. The magnitudes of all wind observations covered by a cell on the wind rose are assigned to be the largest value of the corresponding wind velocity interval. This modification is carried out for each cell containing wind velocities larger than 10 Kn. When the calculation process is repeated for the TORO model using the modified wind data set, the optimum runway orientation is found to be the same as in the first analysis, but the largest value of usability factor decreases to 96.09%. Since the wind observations covered by each cell on wind rose are grouped, the optimum runway direction and its usability factor do not change in the wind rose technique. If the runway orientation optimisation problem is solved with a wind data set containing a number of high-speed wind observations and different effective wind directions, the analysis results of the TORO model will change considerably. The results obtained from the first and the second analysis are illustrated in Table 3.
Computational results of first and second analyses

The third numerical example is added to the study to demonstrate the flexibility of TORO Model. During the determination of appropriate runway directions before the construction of airport elements, the planner may need to analyse different runway configurations because of some constraints related to environment and airfield. In this case, the TORO model gives opportunity to the planner to evaluate different alternatives and to find the best solution in practice. Some examples computed by TORO model for different scenarios are summarised in Table 4.
Usability factors of preselected runway orientations

5.0 CONCLUSION
This paper presents a new numerical model for the determination of optimum runway orientations under multiple scenarios and different runway configurations. The problem is solved with a different approach and a new equation set used for individual computations of runway coverages. Since the errors arising from the partial coverage problem and the FAA's assumption mentioned previously are eliminated, the model gives more accurate results, especially in data sets containing non-uniform distribution of wind magnitudes.
It may not be possible to orient the runways in optimum directions at all times due to navigational and environmental obstructions. Therefore, the flexibility as well as accuracy of an airport planning tool is an important feature for planners. The results presented in the numerical examples demonstrate that the TORO model is more accurate and flexible in comparison with the previous studies. The new model can analyse runway orientations and compute usability factors under any combination of allowable crosswind component and preselected runway directions.
A model with such features would be considered as an essential part of a combined airport planning and design tool for analysing multiple scenarios and alternate runway alignments. The capability and utility of the TORO model can also be improved by integrating it with other useful computer applications such as Geographic Information Systems.
ACKNOWLEDGEMENTS
The authors would like to thank the anonymous referees for their valuable contribution to this paper.