1. Introduction
In Europe, market-consistent valuation has been widely adopted, particularly as a valuation framework of Solvency II for calculating defined-benefit (DB) pension liabilities. Pension liabilities for DB plans can be specified as a stream of risk-free cash flows. The underlying goal of market-consistent valuation is to replicate these non-traded cash flows by using deeply liquid financial instruments. However, this task is challenged by the fact the terms of pension liabilities are frequently beyond the terms of the available market instruments. In particular, the liquidity of financial market fades away beyond the term of 30 years even in developed markets, while pension funds usually face ultra-long-term (30 years and longer) commitments with maturities of more than 70 years.
Due to the scarcity of the long-term market instruments, the valuation of the ultra-long-term pension liabilities always requires an extrapolation of the yield curve beyond the last liquid point of the financial market. Studies on interpolating and extrapolating yield curves have been well established. Broadly speaking, interpolation algorithms can be classified as either spine-based or function-based approaches. As an example of the spline-based method, the U.S. Federal Reserve uses Svensson (Reference Svensson1994)'s approach to estimate the U.S. government yield curve.Footnote 1 The Bank of England employs Waggoner (Reference Waggoner1997)'s spline methodology to build the yield curve. Smith and Wilson (Reference Smith and Wilson2001) and Nelson and Siegel (Reference Nelson and Siegel1987) are the two famous examples of function-based methods for term-structure modeling. The European Insurance and Occupational Pensions Authority (EIOPA) adopts the Smith–Wilson technique for both interpolation and extrapolation of the yield curve. Function-based approaches are usually based on a limited number of parameters hence the term structure can be infinitely smooth, but market points cannot be fitted precisely. In contrast, spline functions often involve more parameters, allowing a better fit for price of traded bonds while sacrificing the smoothness. A natural way to extrapolate the yield curve is to assume that the last forward rate observed can continue to hold after that maturity. However, this simple rule is fragile against instantaneous economic conditions. The large variation of forward rates at the last liquid point is transferred to the rest of the extrapolated curve which makes the valuation of long-term liabilities very volatile.
Conditional on a perfectly interest rate model and accurately estimated parameters, it is possible to replicate the ultra-long-term liabilities precisely using a duration matching strategy if leverage is allowed. In practice, smoothing the discontinuous bond prices is always challenged by parameter uncertainty even with the underlying interest rate model specified. Parameter uncertainty is associated with the ambiguity about the value of the exact parameters given that the underlying model represents the true data generating process. Even in a liquid bond market, it is frequently the case that more than one deeply liquid instruments that promise the same amount of future cash flows are traded at different prices. Variations in issue size, coupon rate and other bond-specific factors may easily influence the estimation results. Furthermore, many smoothing techniques such as Nelson and Siegel (Reference Nelson and Siegel1987) are based on minimizing sums of squared deviations and can give rise to more than one local solution. A small parameter misspecification under the interpolation phase may result in an explosive impact in the extrapolation phase.
Different from the traditional inter- and extrapolation method, this paper develops a prudent dynamic hedging strategy to price the ultra-long-dated liabilities. We propose to construct a leveraged bond portfolio to replicate the ultra-long-term interest rate risks, using the liquid fixed-income vehicles. The incompleteness of the fixed-income market prevents investors from a perfect hedge. We employ an option-style utility function to minimize the downside risks. The resulting hedging portfolios can provide investors a market-consistent value of the ultra-long-dated liability as well as a complete term-structure of the market-consistent discount rate toward and beyond the market last liquid point.
We adopt the robust control theory along the lines of Hansen and Sargent (Reference Hansen and Sargent2007) to deal with the fear of parameter uncertainty. Investors who worry about parameter misspecification look for a prudent policy that is resilient against fragile beliefs about the likelihood of the state variables. Such decision rules are called robust policies. In particular, we formulate a min–max two players' game to deal with the fear of parameter misspecification. With accessibility to short positions, we construct a dynamic hedging portfolio to minimize the expected shortfall of an ultra-long-maturity commitment. Parameter-uncertainty behavior is represented by an artificial agent (max-player) who decides to perturb the estimated long-term bond premium over the investment horizon to maximize the expected shortfall by the end of hedging horizon. We impose a per-period uncertainty set to restrict the size of distortions. To calibrate the bound, we link the distortions to the econometric parameter estimation error. The bounded distortions imposed to the bond premium are related to the Good Deal Bound of Cochrane and Saa-Requejo (Reference Cochrane and Saa-Requejo2000), which restricts the maximum Sharpe ratio in an incomplete market. Our robust optimization framework differs from Hansen and Sargent (Reference Hansen and Sargent2007), in which they introduce a relative-entropyFootnote 2 term to penalize the drift distortions and use detection error probabilities to calibrate the entropy parameter. The Hansen and Sargent framework implicitly imposes an ‘aggregate budget’ constraint toward the distortions rather than a time-homogeneous constraint.
We introduce a robust least squares Monte Carlo (LSMC) method to solve this dynamic hedging problem. It is a regression-based method that combines, in essence, the methods of Brandt et al. (Reference Brandt, Goyal, Santa-Clara and Stroud2005), Carroll (Reference Carroll2006) and Koijen et al. (Reference Koijen, Nijman and Werker2010). As an extension to the existing literature, we impose the preference for robustness to the algorithm. We derive the optimal solution for the max-player analytically, while the hedging position for the min-player is solved numerically. The essential idea behind the regression-based numerical method is to describe the realized value function proxy as a polynomial expansion function of the risk factors.
We summarize three features of the robust-hedging portfolio. First, the preference for parameter uncertainty only matters when the hedging horizon is beyond the market last liquid point. Fear of parameter uncertainty induces an additional demand for the liquid long-term bonds when the instantaneous solvency ratio is low. In other words, our results suggest investors who have concerns about parameter uncertainty take a more aggressive risk position than those who are confident about the point estimates of the underlying model parameters. This is because the liability-driven robust investors are afraid of an over-estimated long-term bond premium. In their views, the point-estimate indicated hedging strategy is not taking enough risky portfolio to offset the downside risk. Although this result contradicts many other robust asset allocation studies such as Maenhout (Reference Maenhout2004) and Shen et al. (Reference Shen, Pelsser and Schotman2019) who suggest a more conservative portfolio for robust investors. Essentially, among all these robust asset allocation studies (including ours), concerns about parameter uncertainty can be translated to the fear of an over-estimated risk premium of the reference estimate. The result also implies the hedging recommendations for robust investors are highly related to the underlying objective functions.
Second, the optimal hedging portfolio depends on the hedging horizon and the current funding ratio, regardless of the preference for parameter uncertainty. Funds with a longer liability duration require a higher allocation to the liquid long-term bonds than those with a shorter duration. This result is alone line the financial literature such as Campbell and Viceira (Reference Campbell and Viceira2001), Benzoni et al. (Reference Benzoni, Collin-Dufresne and Goldstein2007) and Lucas and Zeldes (Reference Lucas and Zeldes2006). Insolvent funds with lower instantaneous funding ratio also require more allocation to the liquid long-term bonds to offset their larger downside risks. Joint with the preference for robustness, our results imply that when funding ratio is low the robust-hedging policy suggests a much more aggressive risk-taking position than the naive one which does not consider parameter uncertainty. Third, we find that a higher spot rate is associated with a riskier portfolio, which applies to both robust and naive policies. For the long-term bonds become more attractive when spot rate hikes.
The leveraged bond portfolios obtained from our stylized dynamic hedging problem enable investors to build up a market-consistent term structure of discount rate and to calculate the price of the ultra-long-term liabilities. First, we find that the yield curve constructed by the robust-hedging policy is always lower than the one constructed by the naive policy, indicating that robust investors require more initial wealth to replicate the same amount of long-term commitments than naive investors. In other words, robust investors would always present a higher value of the ultra-long-term liability than naive investors. Second, when the spot rate is low, we show that both hedging-policy linked yield curves are higher than the model-based yield curve. That means when interest rate is low, the market-consistent discount rate derived from the leveraged dynamic hedging portfolios will result in a lower level of funding requirement than the extrapolated, model-based discount rate.
Many studies contribute to the issue of liability driven asset allocation for pension plans. Pioneer work by Sharpe and Tint (Reference Sharpe and Tint1990) introduces a surplus management approach to manage the liability risk. Detemple and Rindisbacher (Reference Detemple and Rindisbacher2008) extend it to a dynamic framework. Ang et al. (Reference Ang, Chen and Sundaresan2013) include a shortfall penalty term which resembles an option-style objective function to the mean-variance framework of Sharpe and Tint (Reference Sharpe and Tint1990). This paper is related to Föllmer and Leukert (Reference Föllmer and Leukert2000), in which investors also face an option-style objective function and aim to minimize the shortfall risk in incomplete markets. As an extension, we impose parameter uncertainty to the hedging problem and we provide a semi-explicit solution in incomplete markets. This paper is also closely related to Shen et al. (Reference Shen, Pelsser and Schotman2019). Instead of having a stochastic liability diffusion process, we assume a deterministic liability and this gives a different risk appetite to the robust investors.
Our work is closely related and extends the literature on asset allocation with ambiguity aversion or model uncertainty from the industry application perspective. Epstein (Reference Epstein2010) presents comprehensive review of studies on asset pricing with ambiguity aversion or model uncertainty, as well as the theoretical connection between two streams of literature. Early studies are dominated by the Bayesian paradigm. Klein and Bawa's (Reference Klein and Bawa1976) is one of the first studies to consider the effect of model uncertainty on portfolio choice. They look at a two-period model and find that in the presence of estimation risk, the optimal hedging portfolio differs from the traditional analysis. Barberis (Reference Barberis2000) extends the study in a multi-period economy setting while keeping the hedging decision static, and finds that ignoring estimation risk may result in an over-aggressive portfolio. Brennan (Reference Brennan1998) incorporates Bayesian learning with parameter uncertainty and finds that low risk-averse investors put more wealth into risky assets after learning while the high risk-averse investors are more conservative with their portfolio. A more recent approach is the max–min expected utility paradigm developed by Gilboa and Schmeidler (Reference Gilboa and Schmeidler1989). Gilboa and Marinacci (Reference Gilboa and Marinacci2011) claim that Gilboa–Schmeidler's axiom is a neo-Bayesian paradigm because it allows decision makers to have a set of subjective priors. The agent aims to maximize her utility under the least preferred prior in order to demonstrate an aversion to uncertainty. As an extension, Hansen and Sargent (Reference Hansen and Sargent2001) managed to transform Gilboa–Schmeidler's static theory into a dynamic version through the techniques of robust control theory.
This paper employs the robust control technique to deal with the hedging problem with concerns of model uncertainty. To measure model uncertainty, Anderson et al. (Reference Anderson, Hansen and Sargent2003) introduced an endogenous drift term to the law of motions of the state variables. Under their framework, the notion of drift distortion is formally measured by relative entropy, a statistical method to calculate the difficulty of distinguishing between two models. In our setting, investors only fear a subclass of interest-rate model misspecification, namely the mean-reversion parameter under the physical measure ${\cal P}$ and the unconditional mean parameter under the risk-neutral measure ${\cal Q}$
 . In the same manner of Maenhout (Reference Maenhout2004) we turn the general model uncertainty framework of Anderson et al. (Reference Anderson, Hansen and Sargent2003) to a first-moment parameter uncertainty problem. Essentially, investors only worries about the misspecification of the first moment of bond premium. Different from Maenhout's work, we adopt an expected shortfall objective function rather than the standard Merton (Reference Merton1969)'s model. Furthermore, we impose a time-homogeneous uncertainty set to restrict the parameter perturbations rather than the relative entropy which approach commonly adopted in the robust control literature.
From industry application viewpoint, this paper contributes to the studies on discount rate and pension liability valuation. Regulatory frameworks such as Solvency II for European insurers stress the importance of market-consistent pricing of liabilities. This requires an extrapolation of the discount curve beyond the market liquid point. Studies on extrapolating the term structures has not received enough attention until EIOPA adopt the concept of an ultimate forward rate (UFR). The UFR approach requires liability valuation by pension funds to incorporate the assumption that forward interest rates must converge to a priori specified value for a certain specified maturity. Many criticisms and modifications have been suggested since their original proposal. Although Dybvig et al. (Reference Dybvig, Ingersoll and Ross1996) prove that the UFR can never fall under the assumption that such a rate exists. Vellekoop (Reference Vellekoop2016) argues that there is no theoretical or empirical evidence to support the assumption that UFR converges to a value that does not change over time. Broeders et al. (Reference Broeders, Jong and Schotman2014) argue that the UFR method is exposed to both parameter and model uncertainty. Our work retrials the liability valuation problem by adopting the robust-hedging technique. Our approach embraces the concept of market-consistent valuation toward and beyond the market last liquid point and is resilient against parameter uncertainty.
The rest of the paper proceeds as follows. Section 2 describes the one-factor affine term-structure model employed in our economy. The dynamic robust optimization problem is explained in Section 3. Section 4 elaborates the regression-based techniques on solving our dynamic programing problem. Section 5 discusses the robust optimal solution and we provide policy evaluation of the robust policy. Section 6 concludes.
2. Term-structure model
The term-structure model is based on the framework of Duffee (Reference Duffee2002) and Duffie and Kan (Reference Duffie and Kan1996). We assume that the spot rate r t follows the one-factor Vasicek model:

where the superscript ${\cal Q}$ denotes parameters under the risk-neutral measure. The current interest rate r t moves toward its mean value $\theta ^{\cal Q}$
 at the speed of $\kappa ^{\cal Q}$
 , and $W_t^{\cal Q}$
 is a univariate Brownian motion. Both $\theta ^{\cal Q}$
 and $\kappa ^{\cal Q}$
 are non-negative constants. Vasicek model is a special version of Ornstein–Uhlenbeck process with a constant volatility σ.
For the purpose of hedging the risk of an ultra-long-term liability using shorter-term bonds, one-factor affine term-structure model is particularly suited since very long rates are mostly affected by the most persistent factor. Let P(t, T) = P(τ) be the time t price of a discount bond maturing at time T with τ = T − t. The τ-period bond price model can be written as

with


where B(τ) is the volatility of the τ-period long-term bond returns relative to the spot rate volatility. The corresponding τ-period zero rate is

The Vasicek model implies that bond prices follow the diffusion

The investment decisions depend on the pricing kernel π t of the economy under the physical measure ${\cal P}$ , which determines the expected bond premia

where λ t is the market price of risk (MPR) associated with bond expected returns. Departing from the original Vasicek (Reference Vasicek1977) model, in which the price of risk parameter is assumed constant, we adopt Duffee (Reference Duffee2002)'s framework by imposing an essential affine extension of the price of risk such that λ t depends on the spot rate:

We therefore parameterize λ t as a linear affine function of r t with constant coefficients λ 0 and λ 1.
According to Girsanov's theorem, the relation between two measures are given by

Hence the stochastic process of bond price under the physical measure ${\cal P}$ is given by

and the spot rate under ${\cal P}$ measure is given by

and the expressions for λ 0 and λ 1 are given by


2.1 Model calibration
The five structural parameters ${\bf b} = \left[{\matrix{ {\kappa^{\cal P}} \hfill & {\theta^{\cal P}} \hfill & {\sigma^2} \hfill & {\kappa^{\cal Q}} \hfill & {\theta^{\cal Q}} \hfill \cr } } \right]^{\prime}$ are estimated using the generalized method of moments (GMM) method. We obtain the data from the European Central Bank (ECB) statistical data warehouse. The estimation window consists of daily Euro-area nominal government bonds of constant maturities of 3 months, 5 years and 10 years with triple A issuing ratings over the sample period September 6, 2004 to November 15, 2013.Footnote 3
Summary statistics are displayed in Table 1. The average 3-month rate is 1.62% with a standard deviation of 1.45%. The 5-year rate has a mean of 2.61% with standard deviation of 1.1%. The 10-year bond has the highest average rate but lowest volatility among the three. The augmented Dickey–Fuller test shows that we cannot reject the unit root hypothesis for any of the three series.
Summary statistics

Std, standard deviation; Δ, one-period lag; ADF, the augmented Dickey–Fuller unit root statistics with a 5% critical value of −2.86.
Mean and standard deviation of the sample series, mean and standard deviation of one-period lag and the autocorrelations of 3-month, 5-year and 10-year treasure yields denoting r t, Y t(5) and Y t(10), respectively. The table reports the summary statistics of ECB data set for the sample period September 6, 2004 to November 15, 2013.
In Table 2, we report the parameter estimation results. The parameters are expressed in annual terms. The first two columns of Table 2 report the estimated values and standard deviations of structural parameters. The unconditional mean of spot rate, $\theta ^{\cal P}$ , is about 1.615%. The annual speed of reversion $\kappa ^{\cal P}$
 is 17.164%, which is associated with a half-life of the short rate of 4 $\lpar { = \lpar \ln \lpar 2\rpar /\kappa^{\cal Q}\rpar = \lpar \ln \lpar 2\rpar /17.164\percnt \rpar } \rpar$
 years.Footnote 4 The spot rate has an instantaneous volatility of σ = 0.525%, which is associated with a long-term variance of 1.6 bp $\lpar { = \lpar \sigma^2/2\kappa^{\cal P}\rpar = 0.273\,{\rm bp}/17.164\percnt } \rpar$
 . Estimate for σ has a relatively lower standard error than other parameters indicating that spot-rate volatility can be estimated more accurately. The rest of Table 2 reports the correlation matrix of parameters. $\kappa ^{\cal P}$
 and $\theta ^{\cal P}$
 are negatively correlated, indicating that an increase in the long-term spot rate is associated with a decrease of the speed of reversion.
GMM estimates

The table reports the estimation results of the five structural parameters ${\bf b} = \left[{\matrix{ {\kappa^{\cal P}} \hfill & {\theta^{\cal P}} \hfill & {\sigma^2} \hfill & {\kappa^{\cal Q}} \hfill & {\theta^{\cal Q}} \hfill \cr } } \right]^{\prime}$ using GMM. The first two columns display the expected values and the standard deviations of the point estimates $\hat{{\bf b}}$
 . The remaining body displays the correlation matrix of $\hat{{\bf b}}$
 . We choose k = 20 as the number of lags applied in Newey West estimator. Estimations are based on the ECB data over the sample period September 6, 2004 to November 15, 2013.
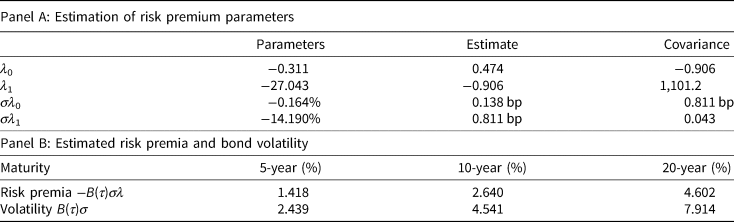
Panel A of Table 3 reports the point estimates of λ 0 and λ 1, as well as the expected values of σλ 0 and σλ 1. Panel B presents the expected risk premia and volatilities of the nominal bonds with maturities of 5 years, 10 years and 20 years. Longer-term bonds have higher expected risk premia and are also associated with higher volatilities than bonds with shorter maturities.
Market price of risk and bond risk premium

The table presents the estimation results for λ 0, λ 1, σλ 0 and σλ 1 over the sample period September 6, 2004 to November 15, 2013. The table also reports the estimated risk premium and return volatility of 5-, 10- and 20-year bonds when r t = 1%, using the estimated results displayed in Table 2.
2.2 Parameter uncertainty
In this section, we embrace the concept of parameter uncertainty to the bond pricing models introduced in Section 2. Following the framework of Anderson et al. (Reference Anderson, Hansen and Sargent2003) and Hansen and Sargent (Reference Hansen and Sargent2007), we assume that investors treat bond diffusion processes as approximate models for the unknown true state evolution. Similar to Maenhout (Reference Maenhout2004) and Shen et al. (Reference Shen, Pelsser and Schotman2019), we reduce the general model uncertainty problem to a first-moment parameter uncertainty problem by assuming that the investors only fear a subclass of parameter misspecification.
We start with a general setting of parameter uncertainty. Assuming that vector ${\bf b}$ is estimated with error. Let ${\bf b}_0$
 be the true value of the structural parameters. Then ${\bf b}-{\bf b}_0$
 represents a parameter misspecification vector that satisfies the following condition

where ${\bf \Sigma }$ is the variance–covariance matrix of ${\bf b}$
 . Given that ${\bf b}-{\bf b}_0$
 is normally distributed, the following statistical inference holds

where $\kappa ^2 = CV_\alpha /N$ is a function of the critical value of the Chi-square distribution χ 2(5) at significance level α.
In the general setting, we need to deal with five-dimensional uncertainties. However, the covariance matrix Σ only has two eigenvalues (0.0334 and 0.0054) that are significantly different from zero. We therefore shrink the five-dimensional parameter uncertainty problem to a two-dimensional parameter uncertainty problem. In particular, we assume parameters that have the largest estimated standard deviations are exposed to parameter uncertainty and the rest parameters can be estimated precisely. Table 2 shows that, among the five parameters, $\kappa ^{\cal P}$ and $\theta ^{\cal Q}$
 have the highest standard deviations for both sample periods. Therefore, these two parameters are most likely to be misspecified.
Let $\kappa _0^{\cal P}$ and $\theta _0^{\cal Q}$
 be the true value of $\kappa ^{\cal P}$
 and $\theta ^{\cal Q}$
 , respectively. Then let $\Delta \kappa ^{\cal P}$
 and $\Delta \theta ^{\cal Q}$
 be the estimation error of the two parameters:

where $\Delta \kappa ^{\cal P}\ne 0$ and $\Delta \theta ^{\cal Q}\ne 0$
 are also called distortion parameters. The rest three parameters are estimated precisely with their true values equal to the estimated values, σ 0 = σ, $\kappa _0^{\cal Q} = \kappa ^{\cal Q}$
 and $\theta _0^{\cal P} = \theta ^{\cal P}$
 . Therefore, function B(τ) is independent of parameter uncertainty under our setting, since $\kappa ^{\cal Q}$
 can be estimated with a reasonable level of accuracy. As a result, only the drift term λ t of the bond-price diffusion process (8) is exposed to parameter uncertainty. In other words, investors only consider the misspecification issue of the coefficients of the risk premium function λ t, namely λ 0 and λ 1.
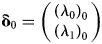
Define ${\bf \delta } = \left({\matrix{ {\lambda_0} \cr {\lambda_1} \cr } } \right)$ and let ${\bf \delta }_0$
 be the true value of ${\bf \delta }$
 with ${\bf \delta }_0 = \left({\matrix{ {{\lpar {\lambda_0} \rpar }_0} \cr {{\lpar {\lambda_1} \rpar }_0} \cr } } \right)$
 , where (λ 0)0 and (λ 1)0 represent the true values of λ 0 and λ 1, respectively. Then we transfer the perturbations to the risk premium parameters, λ 0 and λ 1:

where c 0 = c 0t and c 1 = c 1t are the two time-varying perturbation parameters with their values depending on instantaneous state variables and hedging horizon:

Next, we map the joint distribution of the general estimation-error vector ${\bf b}-{\bf b}_{\bf 0}\sim {\cal N}\lpar {0\comma \;{\bf \Sigma }} \rpar$ to vector ${\bf c}$
 using the first order Taylor expansion. Therefore, vector ${\bf c}$
 is also asymptotically normal with

where ${\bf c} = {\bf c}_t$ is the instantaneous distortion vector and $\Omega = {\bf J}\Sigma {\bf J}$
 , with ${\bf J}$
 the Jacobian matrix of ${\bf \delta }$
 with respect to structural parameter ${\bf b}$
 . We assume that there is an artificial agent (‘nature’) who makes an instantaneous decision on ${\bf c}_t$
 such that the true value of bond premium perturbs from the point estimate. The distortions c 1 and c 2 shift the drift of the bond diffusion process (8) by a unit of Bσ(c 0 + c 1r t). Hence they specify a set of alternative measures referring to different specifications of the stochastic process known as a Girsanov kernel.
The distortions are bounded by a time-homogeneous uncertainty set ${\bf S}$ . A larger uncertainty set ${\bf S}$
 indicates a higher degree of uncertainty aversion. To calibrate the bound of the specification error ${\bf c}_t$
 , we relate the distortions to the econometric parameter estimation error. We obtain a statistical constraint on ${\bf c}$
 using the property that ${\bf {c}^{\prime}}\Omega ^{{-}1}{\bf c}$
 is Chi-square distributed. This leads to the following uncertainty set ${\bf S}$
 :

where $\gamma ^2 = CV_\alpha /N$ with $CV_\alpha$
 denoting the critical value of χ 2(2) at significance level α and N is the sample size.
Our uncertainty set differs from the Hansen and Sargent framework in two ways. First, under their framework the perturbations are formally measured by relative entropy. The entropy term penalizes drift distortions that move away from the reference model. The relative entropy parameter plays the same role as a Lagrange multiplier of the Hamilton–Jacobian–Bellman equation for optimality. However, this Lagrange multiplier implicitly imposes a constraint on the following bound for the specification error:

where η 0 sets the average size of the potential model misspecification. The uncertainty set (14) is an aggregate-budget style present-value bound that restricts the distortions cumulatively over the decision horizon T. This present-value constraint (14) is time-inconsistent. However, our uncertainty set (13) is a time-homogeneous constraint that we can impose cleanly on nature's future actions without keeping track of what has happened in the past.
The second difference is related to the uncertainty set calibration. Under the Hansen and Sargent framework, the boundary parameter η 0 is linked to relative entropy which in essence is a Lagrange multiplier over the misspecification bound (14). Hansen and Sargent (Reference Hansen and Sargent2007) use a Bayesian model selection problem (also called the detection error probability method) to calibrate this relative entropy parameter. The detection error probability method performs likelihood ratio tests under the two models based on available data. A higher degree of robustness leads to a lower detection error probability. We follow Shen et al. (Reference Shen, Pelsser and Schotman2019) by calibrating the boundary of the uncertainty set using statistical reference.
We choose a significance level of α = 5% at which the corresponding critical value of χ 2(2) is 5.99. We also assume that the minimum sample horizon for estimation is ${\cal N} = 200$ time units. Hence, as a benchmark, the misspecification bound is γ = 0.17 or γ 2 = 0.03. Either a longer data set or a higher significance level would reduce the bound parameter γ and results in a smaller uncertainty set for c t, which indicates a gaining confidence over the reference model.
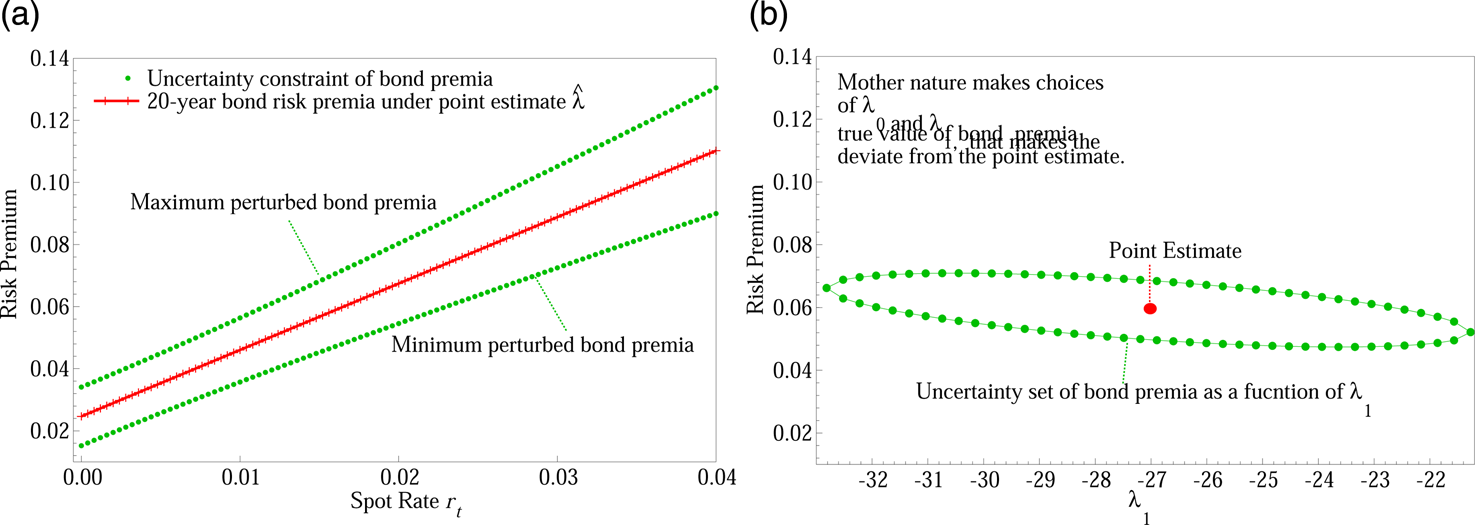
The value of bond premium, −B(τ)σλ, is governed by the instantaneous spot rate r t and is subject to parametric misspecification. Figure 1a presents the 20-year nominal bond risk premia, −B(20)σλ, for a realistic range of spot rates. The solid dotted line plots the 20-year bond risk premia as a function of r t using the point estimates $\hat{\lambda }_0$ and $\hat{\lambda }_1$
 . For example, when spot rate is 1%, the associated 20-year bond risk premium is 4.6%, which is consistent with Table 3. The dotted lines surrounding the point estimates of bond premia represent the upper and lower boundaries of the perturbed bond prima driven by the distortions c 0 and c 1 with $\lcub {c_0\comma \;c_1} \rcub \in {\bf S}$
 . The bond risk premium is not sensitive to B(τ), since B(τ) is independent of parametric misspecification issues. Bond risk premium is increasing with the spot rate. In short, misspecification of MPR results in a perturbation of the bond premium of around 200 basis points either downward or upward.
Bond premia. The figure presents the 20-year bond risk premia for different spot rates under different choices of λ 0 and λ 1. The ambiguity of MPR constrained by set ${\bf S}$ is shown in (13) with γ 2 = 0.03. Panel 1a presents the minimum and maximum values of bond premia within the feasible region for different r. The point estimate premia $\hat{\lambda }$
 are located in between the two extremes. Panel 1b plots the feasible region of bond premia for different choices of λ 1 under the unconditional expectation of spot rate.

The uncertainty set ${\bf S}$ has a circular shape in the {c 0, c 1} space with zero in the center, but it turns to an ellipsoid shape when mapping to the ${\bf \delta }$
 space. Figure 1b plots the uncertainty set that maps the perturbation vector ${\bf c}_t$
 to the {B(20)σλ, λ 1} space. The uncertainty set is centered by the point estimate $\lcub {B\lpar {20} \rpar \sigma \hat{\lambda }\comma \;{\hat{\lambda }}_1} \rcub$
 with r = 2%, where $\hat{\lambda } = \hat{\lambda }_0 + \hat{\lambda }_1r$
 . The center of the uncertainty set shows that given the point estimates, $\hat{\lambda }_1 = {-}27.04$
 and $\hat{\lambda }_0 = {-}0.31$
 , the associated 20-year bond premium equals to 6%. The very narrowly shaped ellipsoid spaced is mainly driven by the large variation between the point estimates of λ 0 and λ 1.
3. Robust optimal portfolio choice
3.1 Dynamic replication strategy
The agent with wealth X t at time t = 0 aims to replicate an ultra-long-dated liability with payoff equal to one at a long end maturity time T by investing in two liquid fixed-income instruments: a long-term zero coupon bond with maturity τ 2, where τ 2 < T; and a short-term bond. Let the long-term bond maturity be the same as the term of market last liquid point. The hedging horizon T is assumed beyond the term of the last liquid point of the financial market. The replication strategy is constructed based on dynamic hedging and the agent is only interested in eliminating the downside risk. Therefore the hedging criterion is defined over the expected shortfall [1 − X T]+ at time T. This hedging criterion allows the agent to replicate the ultra-long-term cash flow as much as possible by active trading using the minimum amount of wealth. If the agent is not aware of parameter uncertainty, the hedging portfolio relies fully on the point estimator $\hat{\delta } = \left({\matrix{ {{\hat{\lambda }}_0} \cr {{\hat{\lambda }}_1} \cr } } \right)$ and we define such specification-error-free trading strategy as a naive policy. The naive dynamic optimization problem is defined as

The fraction of wealth allocated to long-term bonds with maturity τ 2 at time t is indicated by w t and leverage is allowed. The law of motion of wealth is given by

where we omit the subscripts t.
For the dynamic trading strategy (15), we omit the effect of rollovers which occur when reinvesting wealth from matured bonds into newly issued bonds of the same feature. We assume that the invested fixed-income securities are continuously issued and are liquidly traded during the entire decision horizon. Even when the remaining hedging horizon is shorter than then the marketable term, the investor still keeps on active trading. If we stop the active trading as soon as the market becomes complete when the remaining maturity of the liability equals to maturity of long-term bond, then the expected shortfall hedging criterion would not be minimized and the required initial capital for hedging long-term liabilities can be higher.
3.2 Robust hedging
The robust control method is formulated by a min–max expected utility framework which according to Hansen and Sargent (Reference Hansen and Sargent2007) resembles a two-player zero-sum game. The investor who fears parametric misspecification takes the role of min-player and seeks a robust-hedging policy that minimizes the expected shortfall at maturity T under the worst-case scenario decided by the artificial agent. The artificial malevolent agent takes the role of max-player and makes a decision on distortions ${\bf c}_t$ given the min-player's choice. The equilibrium of the game gives us an instantaneous robust hedge. The robust optimization problem is given by

the artificial agent makes an instantaneous decision on c 0 and c 1 bounded by the time-homogeneous constraint ${\bf S}$ , as thus controls the risk premium parameters λ 0 and λ 1.
4. Numerical technique
Robust hedging with an expected shortfall objective function does not allow for an analytical solution, so we use a numerical approach instead. Our method in essence combines the methods proposed by Brandt et al. (Reference Brandt, Goyal, Santa-Clara and Stroud2005) and Koijen et al. (Reference Koijen, Nijman and Werker2007) to approximate the conditional expectation that we encounter in solving the dynamic programing by polynomial expansions in the state variables. We also follow Diris (Reference Diris2011)'s approach to parameterize the coefficients of the approximation function by a quadratic function of portfolio weights, such that we can calculate the optimal portfolio under each path analytically. Furthermore, this method allows us to achieve an accurate result using a very small grid of testing portfolios. As an extension, we integrate the robustness ingredient to the standard simulation-based algorithm.
We start by simulating a large number of N sample paths with length T years of bond returns using Euler discretization. We also choose an M-dimensional grid for financial wealth values. The wealth grid points are indicated by X j, j = 1, …, M. In total, we have (M × N) grid points at each point in time.
The algorithm for the robust policy consists of two parts. First, the stylized design of our robust control problem (17) enables us to solve max-player's decision analytically. This is because the max-player's decision only influences the long-term bond premia −B(τ 2)σλ, which is independent of min-player's decision. As B(τ 2) is independent of parametric uncertainty, the max-player is simply dealing with a quadratic programing problem. Therefore, under the assumption that w t ≥ 0, maximizing the expected shortfall problem for the max-player boils down to a problem of minimizing the bond premia. Therefore, we can analytically solve for nature's decision.
The optimal decisions on c 0 and c 1 are the solutions of the following quadratic programing problem:

where $\alpha _t = \left({\matrix{ 1 & {r_t} \cr } } \right)$ . We can easily find the optimal solution for ${\bf c}_t$
 :

Therefore, the decision for the max-player at each rebalancing time step t depends exclusively on r t. The min–max problem is now simplified to the minimization problem alone.
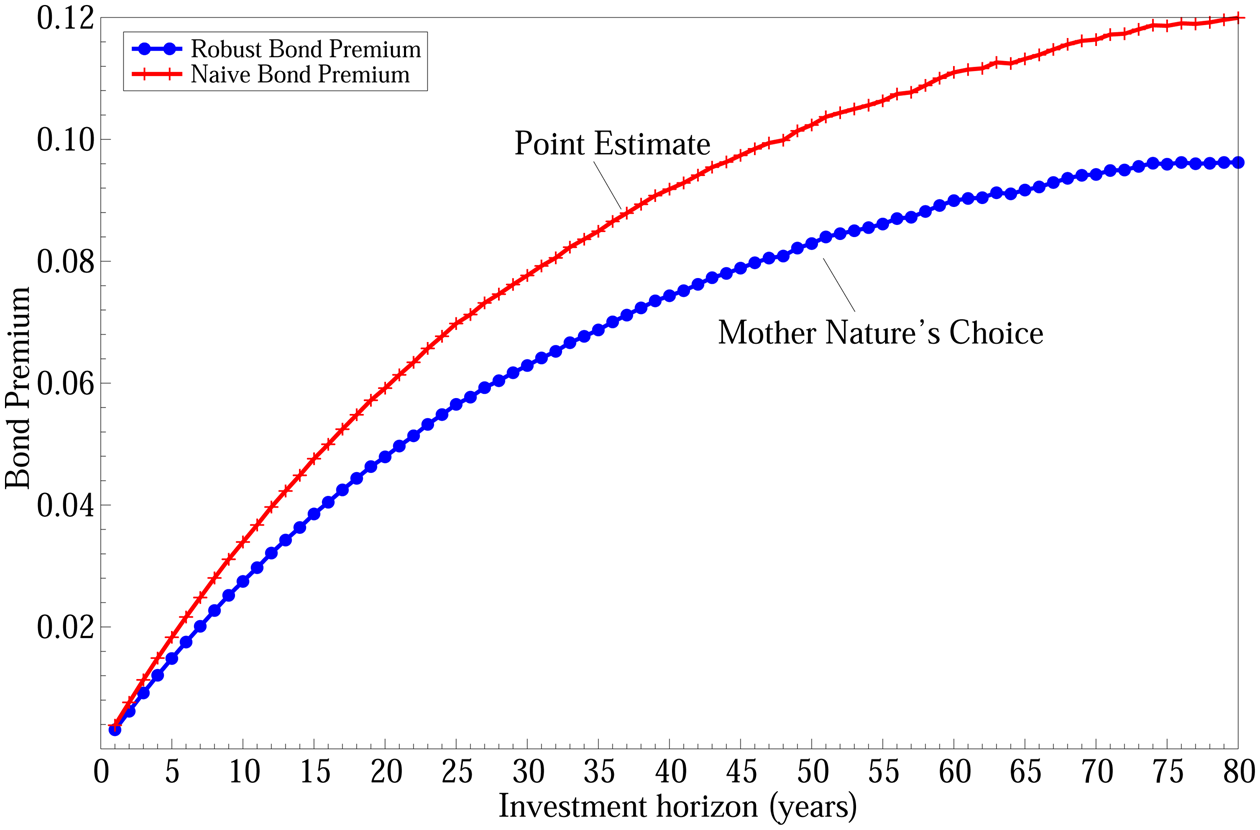
Figure 2 displays the robust optimal bond premium as a function of bond maturity against the point-estimate implied bond premium. The max-player intends to minimize the bond premium so as to maximize the expected shortfall at time T. As a result, the robust bond premium at any maturity is always lower than the corresponding naive one. Ignoring parametric uncertainty does not create dramatic influence to the short-term bond premium. For example, without considering misspecification issues, a 5-year bond premium would at most be over-estimated by 40 basis points under the worst case scenario. The impact of ignoring parameter uncertainty for long-term bond investors can be substantial. A 30-year long-term bond premium can be over-estimated by as large as almost 1.6%, if investors fully reply on the point estimates when determining hedging and investment decisions. The dispersion between the naive and the robust bond premia increases with the bond maturity, indicating that investors with more allocation to long-term fixed-income securities are more likely to be exposed to larger-scale parameter uncertainty problem. One can also conclude from Figures 1a and 2 jointly that a higher instantaneous spot rate is associated with a larger spread between the max-player's and the naive investor's view on bond premium.
Nature's decision on bond premium. The figure presents nature's choice of bond risk premium against the naive estimate ${-}B\lpar \tau \rpar \sigma \hat{\lambda }$ under different bond maturities. The instantaneous spot rate is equal to 2%.

In the second part of the algorithm, we use the backward LSMC method to solve for optimal portfolios. We summarize the LSMC algorithm in three steps.
Step 1. At time step t, i.e., starting from period T − Δt and iterating to period 0, construct realized loss V T = (1 − X T)+ for all simulated paths using the following information:
• Robust optimal portfolio from previous time steps $w_s^\ast \lpar {s = t + \Delta t\comma \;\ldots \comma \;T-\Delta t} \rpar$

• Optimal natures decision from previous steps $\lambda _s^\ast$
(this is analytically solved)• A small grid of testing portfolio w h, h = 1, …, H
• Spot rate r i,s with i = 1, …, N
• Current wealth X j,t, j = 1, …, M


so we have a cross-section size of N × M × H.
Step 2a. Run a cross-sectional regression by approximating the realized objective function V T,ijh calculated in step 1 on trajectories of state variables as well as the testing portfolio w h on a second-order polynomial expansion (including cross term) at a certain point in time:

Step 2b. Now we parameterize the approximate conditional value function as a quadratic function of portfolio weights such that we can analytically calculate the optimal portfolio.
For a naive investor, the first part of the algorithm can be ignored since nature does not play a role in the naive hedging framework. Appendix A elaborates on the LSMC algorithm in more detail.
5. Long-term investors and bond premia uncertainty
In this section, we investigate the impact of parametric uncertainty on bond portfolio allocations. Section 5.1 analyzes the robust optimal portfolio. Section 5.2 discusses the property of the robust yield curve deduced from the robust-hedging portfolio.
5.1 Optimal portfolio choice
Figure 3 plots the optimal allocation to the 20-year (τ 2 = 20) nominal bonds, w t, as a function of the investment horizon. The rest amount, 1 − w t, allocates to the short-term bonds. We do not limit the opportunity for shorting in the money market for two reasons. First, in many countries pension funds are allowed to leverage. For example, the big-six Canadian pension funds increased their average leverage to 24% in 2017, from 19% in 2009.Footnote 5 Second, we aim at constructing an optimal bond portfolio that can replicate the ultra-long-term liability risk as much as possible when funds are underfunded and when the market last-liquid-point is not long enough to reach the hedging horizon. Such a replication portfolio can not only help investors measure the non-tradable liability risk, but also provide investors a minimum funding requirement that guarantees the future cash-flow commitment via dynamic trading. One can also use this minimum funding requirement with a τ-year maturity to calculate the corresponding τ-year discount rate y(τ).
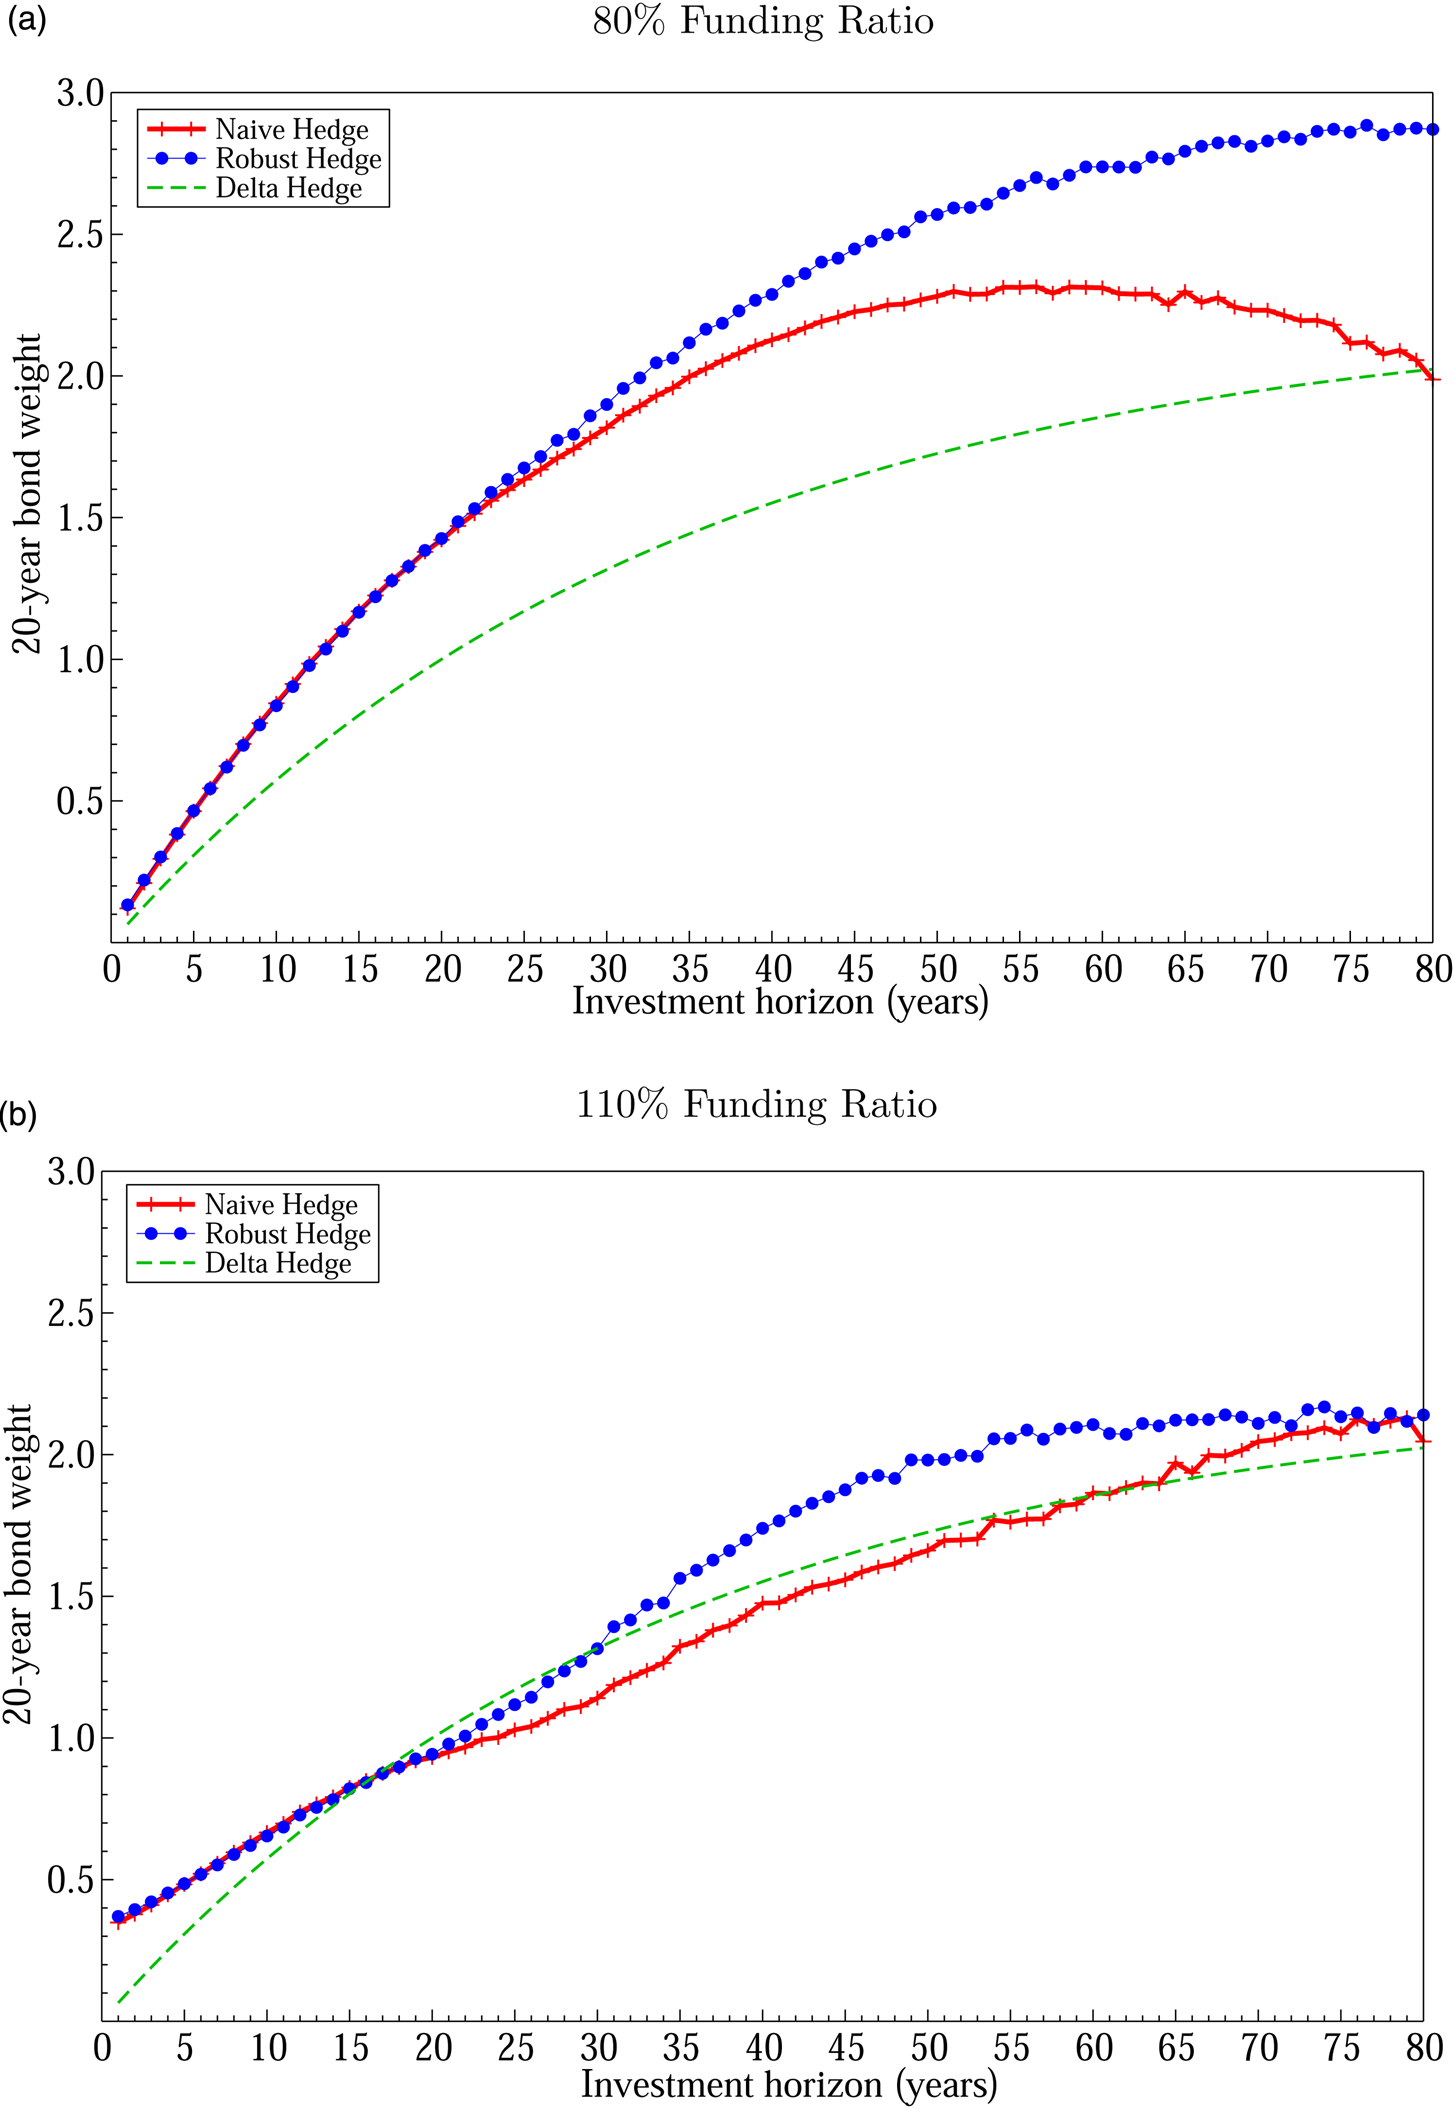
Optimal bond portfolio for different horizons. The figure plots 20-year bond weights against different investment horizons when current funding ratio is 80% (a) and 110% (b) for different hedging policies. The present spot rate is 2%. The weights are based on three different hedging policies: naive hedge, robust hedge and delta hedge. Results are based on 10,000 draws of predictive bond distribution.

Figure 3 displays three different hedging policies: (1) a naive policy that relies purely on the point-estimate based investment opportunity set; (2) a robust policy that considers parametric uncertainty and (3) a delta-hedging policy that eliminates the model-implied ultra-long-term liability risk without considering speculative potential when confronting with solvency risk.
Delta Hedging The delta of a long-dated liability is defined as the rate of change of the price of liability with respect to the price of the underlying τ 2-year bond, which is given by

assuming the Vasicek model is valid for all maturities. We use Δ as a benchmark to compare with some dynamic hedging strategies that consider the solvency conditions. Let funding ratio, a fraction of the current wealth level X 0 and a hypothetical present value of liability P(0, T), be the measure of the solvency position of a fund. If the funding ratio is lower than one, then this fund has a higher expected value of liability than of its assets, which implies under-funding.
We consider two funding scenarios in Figure 3. Figure 3a presents the three hedging policies when the fund is underfunded with a funding ratio of 80%. Figure 3b shows the results when the fund is not facing a solvency issue with a funding ratio of 110%.
Regardless of solvency positions, Figure 3 demonstrates two risk management incentives. First, long-term investors have more holdings on the long-term bonds than short-term investors, which is consistent with financial literature (e.g., Campbell and Viceira, Reference Campbell and Viceira2001).Footnote 6 As shown in both figures, allocation to 20-year bond is increasing with the hedging horizon at a diminishing rate for all hedging policies since intertemporal hedging component B(τ) increase with hedging horizon. For example, the delta hedge Δ = 1, 1.5 and 1.8 for long-term investors with investment horizons of 20, 40 and 60 years, respectively. Second, short-term investors put less weights on the long-term bonds compared to long-term investors. Pension funds that have a shorter hedging horizon are usually more mature than those with a longer-term hedging horizon, and are also associated with a shorter liability duration. Benzoni et al. (Reference Benzoni, Collin-Dufresne and Goldstein2007) and Lucas and Zeldes (Reference Lucas and Zeldes2006) argue that mature funds should have a lower level of risk-taking because their projected liabilities are more akin to those of a short-duration bond rather than of risky financial instruments, as the cash flows resulting from promised pension benefits become less uncertain for mature funds. In addition to these risk incentives, Figure 3 also shows that delta hedge is independent of funding status. As shown in (19), delta hedge is simply a function of τ and is irrelevant to the funding ratio. As a result, delta investors do not have incentives to take extra risks to offset mismatched liabilities when the fund is underfunded.
Next, we dive deep into the two funding scenarios. When funds have insufficient wealth to cover their liabilities (see Figure 3a), both naive and robust investors look for speculation opportunities to catch up the mismatch. As a result, both hedging policies are above the delta hedge over the investment horizon. In other words, delta strategy may effectively eliminate the long-term interest-rate risk but does not help to meet the long-dated commitments when facing an insufficient solvency status. We summarize two takeaways from Figure 3a. First, when hedging horizon is shorter than the last liquid point (T ≤ 20), robust investors would choose an identical hedging portfolio as naive investors. This is because when investment horizon falls within the last liquid point, the financial market becomes complete. As a result, concerns about parametric uncertainty vanish. For example, both naive and robust investors with 5-year hedging window would choose to put about 45% of their current wealth to the 20-year long-term bonds to minimize the asset-liability mismatch at a funding ratio of 80%.
Second, when hedging horizon is beyond the market last liquid point of 20 years, naive and robust-hedging policies start to diverge. Investors who worry about misspecification issues take a riskier hedging position by investing more long-term bonds than naive investors. This is because robust investors are afraid that the point estimate on the 20-year bond premium can be over-estimated. In their view, the point-estimate implied hedging strategy is not taking enough risk to offset the downside risk. Hence, a more aggressive hedging portfolio is appreciated by robust investors. The gap between the robust and the naive policies is increasing with hedging horizon, indicating that concerns about the impact of parametric uncertainty on long-term bond returns are accumulating over the investment horizon. Remark, the concavity-shaped naive policy at the long end of hedging horizon is likely to be caused by numerical issues.
At first glance, the second takeaway from Figure 3a contradicts the existing literature. For instance, both Maenhout (Reference Maenhout2004) and Shen et al. (Reference Shen, Pelsser and Schotman2019) show that robust investors prefer a more conservative portfolio than naive investors. Essentially, robust investors among all studies (including ours) have concerns about an over-estimated risk premium implied by the reference estimation. As a result, they will employ alternative opportunity sets surrounding the point-estimate one and take one of the perturbed opportunity sets that brings the worst case scenario to their objective functions. Therefore, investment recommendations for robust agents are mainly driven by the underlying objective functions. For example, in Maenhout (Reference Maenhout2004)'s framework, robust investors aim to maximize their terminal wealth. Concerns about parametric uncertainty make them believe that the referenced investment strategy overstate the expected returns of risky assets. Therefore, robust investors adjust their risk-return tradeoffs of risky assets downward and also reduce their risk holdings accordingly. In Shen et al. (Reference Shen, Pelsser and Schotman2019)'s framework, investors aim to minimize an expected shortfall objective function that involves a stochastic liability constraint. In this case, robust investors not only worry about an over-estimated expected stock return, but also an under-estimated expected liability return in the meantime. Therefore, a conservative portfolio is appreciated by robust investors. Different from either studies, investors under our framework are facing a guaranteed commitment, which increases robust investors' incentives to take more risks to offset the over-estimated risk premium.
In Figure 3b, we plot the three hedging policies when funding ratio is greater than one. When market is complete (T ≤ 20), the three hedging policies are identical.Footnote 7 This is because when the current funding ratio is above one, downside risks fade away. Neither robust nor naive investors have incentives to take extra risks, since one can fully replicate the long-dated payoff by constructing a bond portfolio via delta hedging. When hedging horizon reaches beyond the market last liquid point, naive policy still closely follows the delta hedge. This is because when over funding, the likelihood of facing a shortfall is relative small via dynamic hedging. As a result, naive investors' hedging component is dominated by the intertemporal hedging component B(T), which matches the delta hedge. To measure the long-term interest rate risk, naive investors extrapolate the yield curve beyond the last liquid point based on the point estimates. Robust investors, however, would extrapolate a set of yield curves and employ the one that creates highest expected shortfall by the end of the hedging horizon. Therefore, robust investors have more incentives to take extra risks to hedge potential solvency risk than naive investors even if the fund is now over-funded.
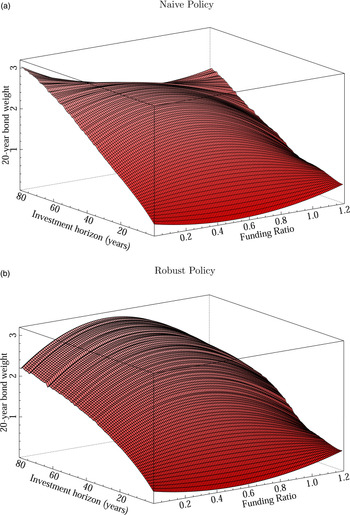
We now investigate how sensitive the two optimal hedging policies are in response to the changes of instantaneous funding ratio over different hedging horizons. Figure 4 displays the optimal asset allocations to the 20-year bonds for naive (see Figure 4a) and robust (see Figure 4b) hedging policies in three-dimensional graphs as functions of a reasonable range of the funding ratio and the investment horizon. We can draw three conclusions from Figure 4. First, as also observed in Figure 3, when the hedging horizon is shorter than the market last liquid point, robust investors make the same investment decision as naive investors, for liabilities can be fully replicated in a complete market. Second, when the hedging horizon is beyond the market last liquid point, robust investors would choose a more aggressive risk position when funding ratio is below 1 while above 0.2, due to their concerns about an over-estimated bond premium. This feature is also observed in Figure 3. Third, when funding ratio is close to zero, the robust policy recommends a more moderate risk position than the naive policy for ultra-long-term investors. In fact, the robust policy in this case is very close to a delta hedge. This is because when funding status is extremely low, the likelihood of fully replicating long-term liabilities is close to zero even with an extremely aggressive portfolio. As a result, funding status in this extreme case barely plays a role in the investment decision. Thus the resulting robust-hedging portfolio is very similar to a delta hedge.
Optimal portfolio under different funding ratios (1). The figure plots the optimal portfolio of 20-year bond as a function of investment horizon and current funding ratio with spot rate equal to 2%.

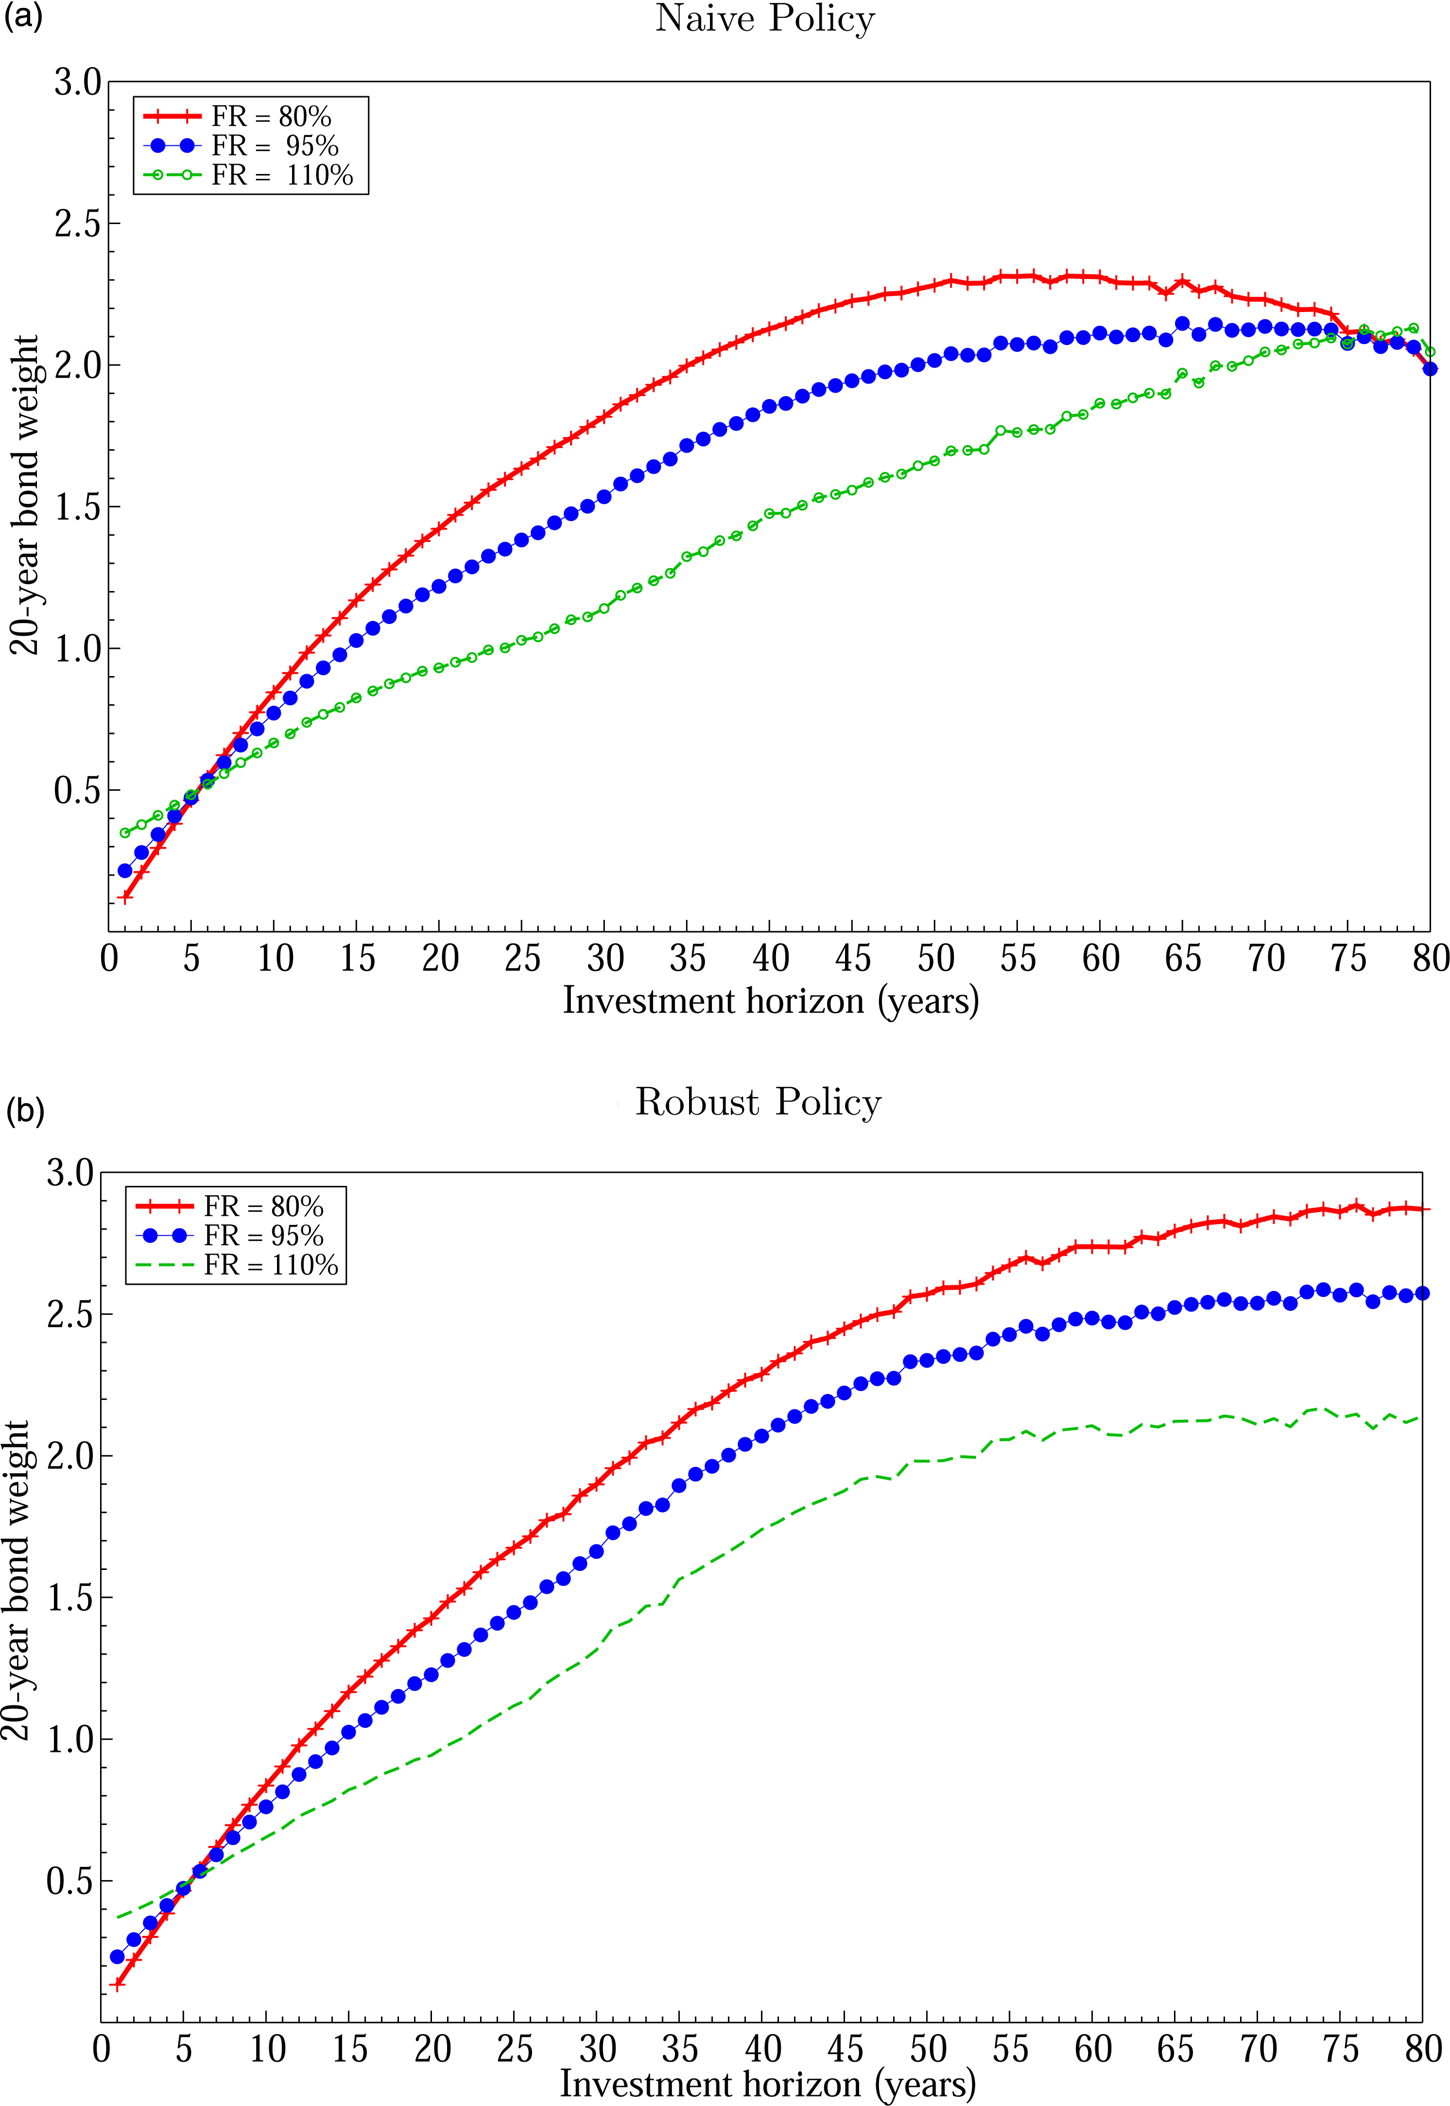
Figure 5 displays both naive (see Figure 5a) and robust (see Figure 5b) hedging policies over the hedging horizon under three different funding-ratio scenarios. In addition to the conclusions drawn from Figures 3 and 4, we highlight some additional features of the two policies. First, a lower funding ratio is associated with a riskier hedging position. This property holds for both policies. For example, a naive investor with a 40-year investment horizon would allocate 210% of the assets to 20-year bonds when the funding ratio is 80% but would reduce to 140% when the funding ratio is 110%. As discussed before, the robust policies take higher risk positions than the naive policies. Second, naive hedging policies start converge to the delta hedge when hedging horizon is approaching 80 years, while robust policies increase their risk positions with hedging horizon at a diminishing rate. This is because when facing an ultra-long-term hedging horizon, naive investors are more confident than robust investors in terms of the point-estimate implied risk-return opportunity set and they find delta hedge with a very small speculation component is enough to cover the ultra-long dated commitment. Robust investors, however, have a much lower reward expectation given the same level of risk positions as naive investors.
Optimal portfolio under different funding ratios (2). The figure summarizes the key insight of Figure 4 under three reasonable funding ratio levels.

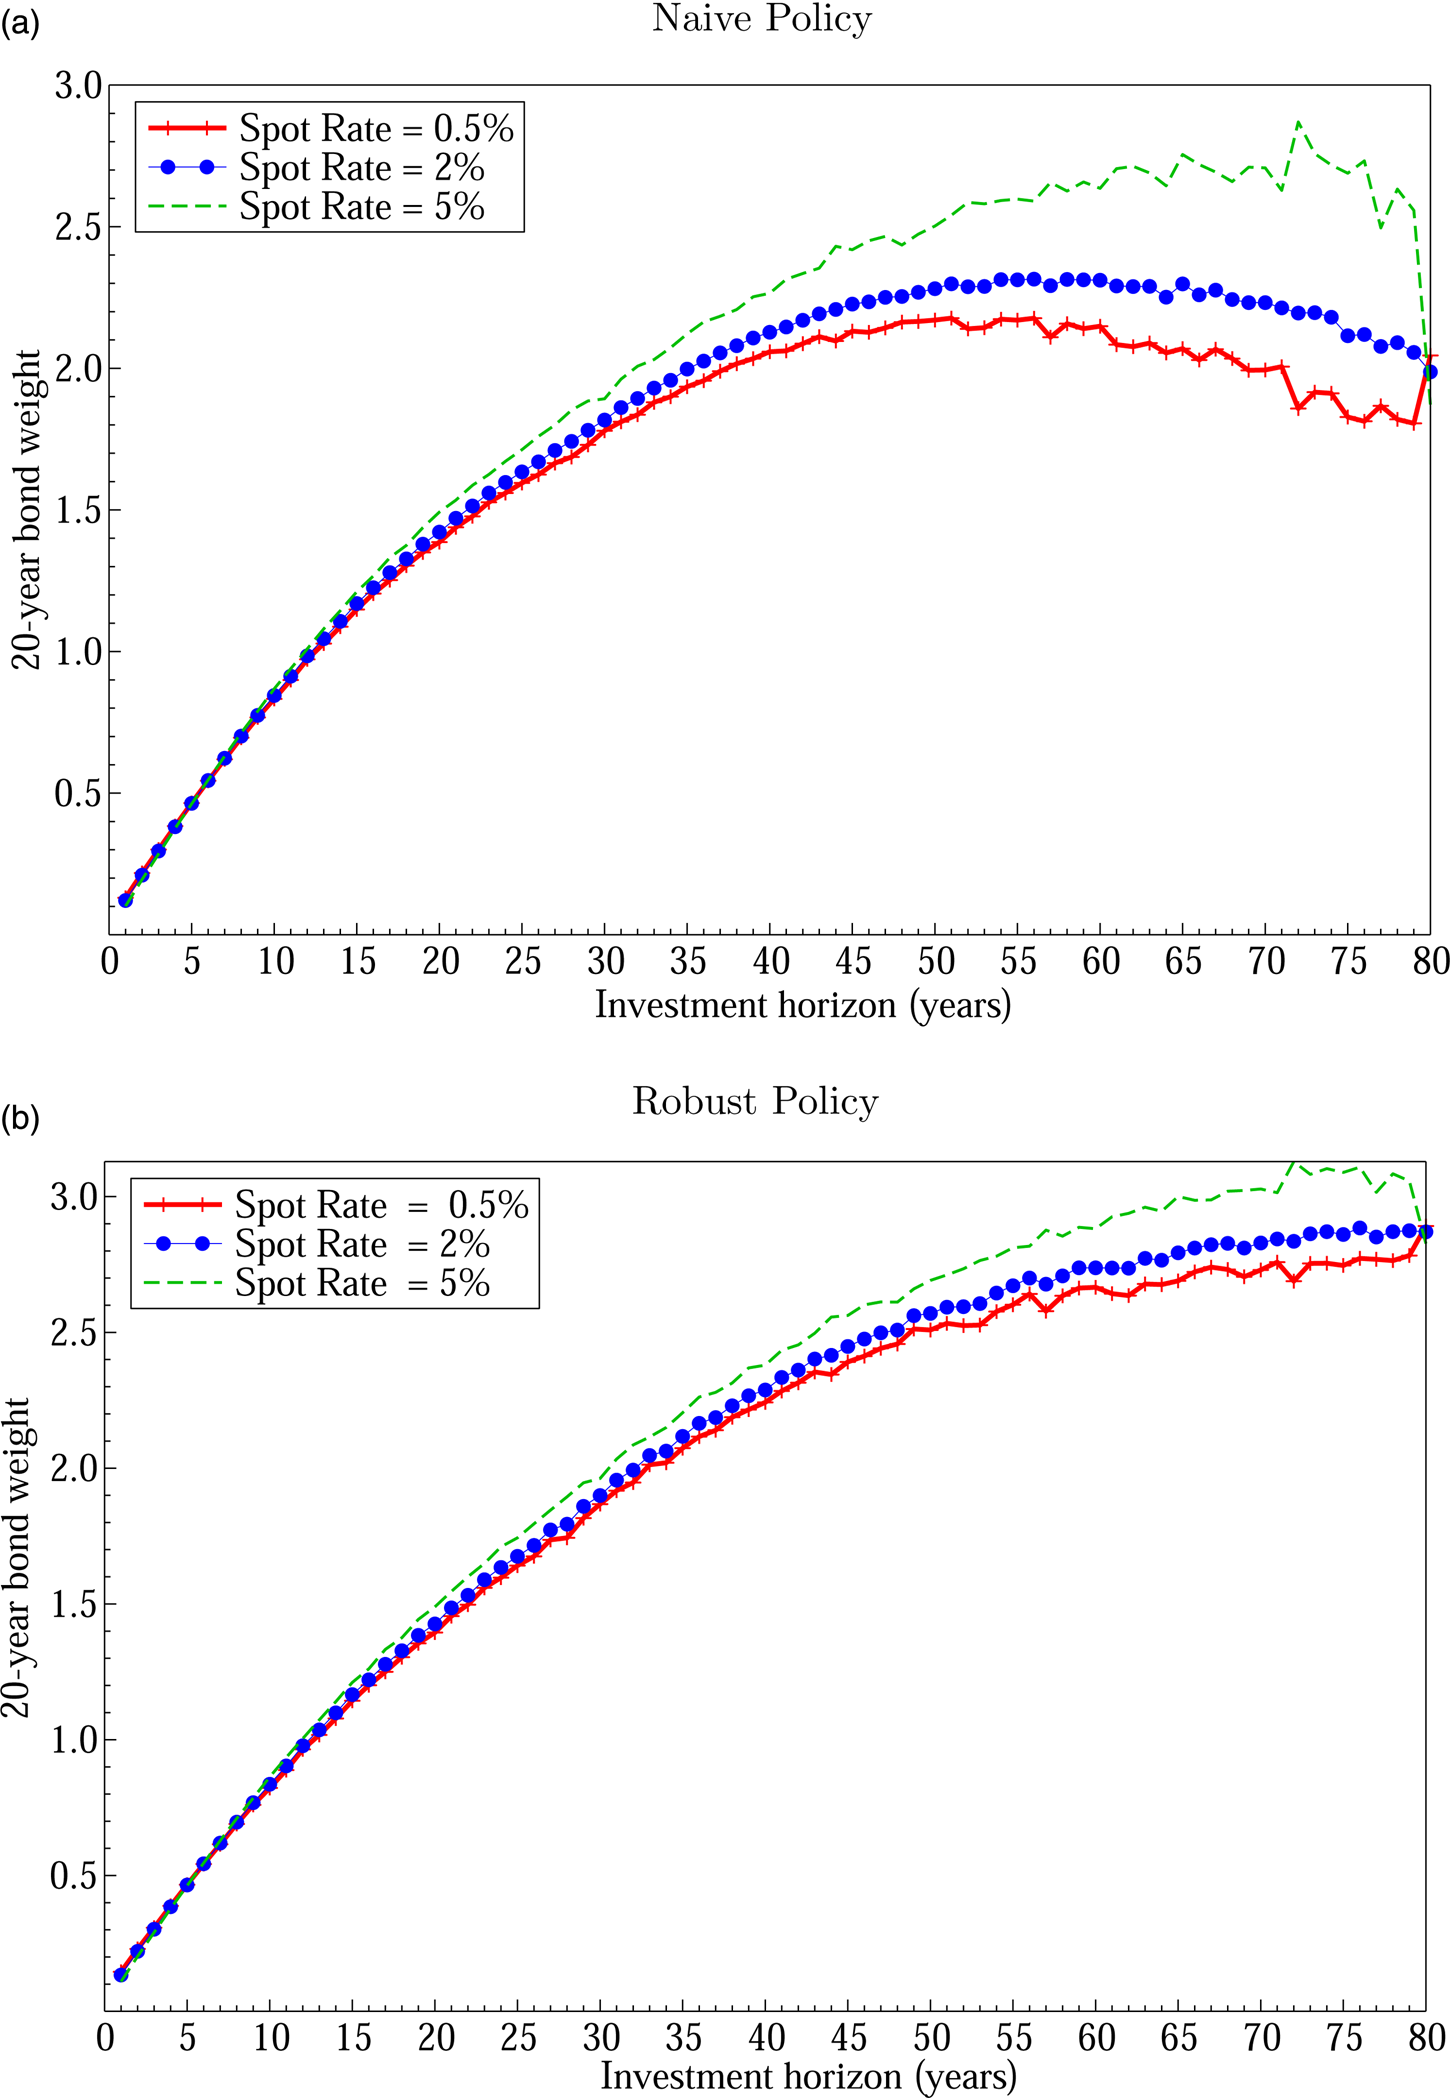
Figure 6 presents the optimal allocation to the 20-year bond under three different spot-rate scenarios when the instantaneous funding ratio is 80%. We start with extracting a common feature that holds for both naive (see Figure 6a) and robust (see Figure 6b) hedging policies. Both policies indicate that a higher spot rate is associated with a higher allocation to the 20-year bonds when hedging horizon is beyond the market last liquid point. This is because the risk-return trade off of the 20-year bond increases in response to the interest rate hikes. For instance, as shown in Figure 1a, r = 0.5% is associated with a naive 20-year bond premium of 3% and r = 2% is associated with a naive bond premium of 7%. In other words, long-term bonds become more attractive when the spot rate is high. As a result, a higher allocation to long-term bond is desired when interest rate is high and vice versa. Next, we discuss the difference between the two hedging policies in response to the changes of interest rates. The robust policy differs from the naive one in the sense that the robust policy is less sensitive to the spot rate. As can see in Figure 1a, the perturbed bond-premium curve is flatter than the naive one indicating that the worst case scenarios that robust investor follow are less sensitive to the movements of spot rates than the reference scenario. Over all, resilience against macro-risk factors is a desired feature of the robust policy.
Robust policy under different spot rates. The figure plots naive (a) and robust (b) optimal bond portfolios as a function of spot rate and hedging horizon when current funding ratio is 80%.

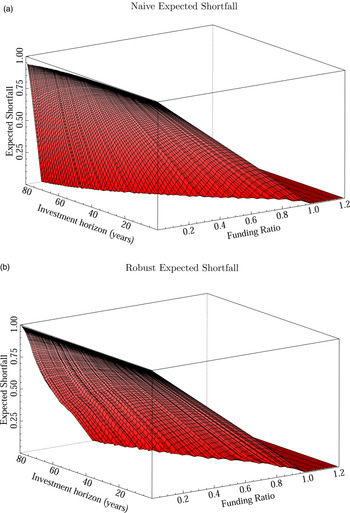
Figure 7 plots the optimal realized expected shortfalls in a three-dimension space as a function of the instantaneous funding ratio and the investment horizon. In general, the robust expected shortfall (see Figure 7b) is larger than the naive one (see Figure 7a) with given investment horizon and when funding ratio is low. When hedging horizon is <20 years, the difference between the two expected shortfalls implied by the two hedging policies are relatively small. As explained in Figure 3, robust and naive investors would choose an equal hedging portfolio when hedging horizon is shorter than the last liquid point. However, robust investors are pessimistic about the expected bond premium, which results in a higher level of expected shortfall by the end of hedging horizon. When investment horizon goes beyond the last liquid point, the difference between the two expected shortfalls implied by the two hedging polices enlarges. This is because robust investors' fear for over-estimated bond premia increases with hedging horizon, as shown in Figure 2.
Optimal expected shortfall (1). The figure plots the expected shortfall as a function of hedging horizon and funding ratio under naive (a) and robust (b) policies when spot rate is 2%.

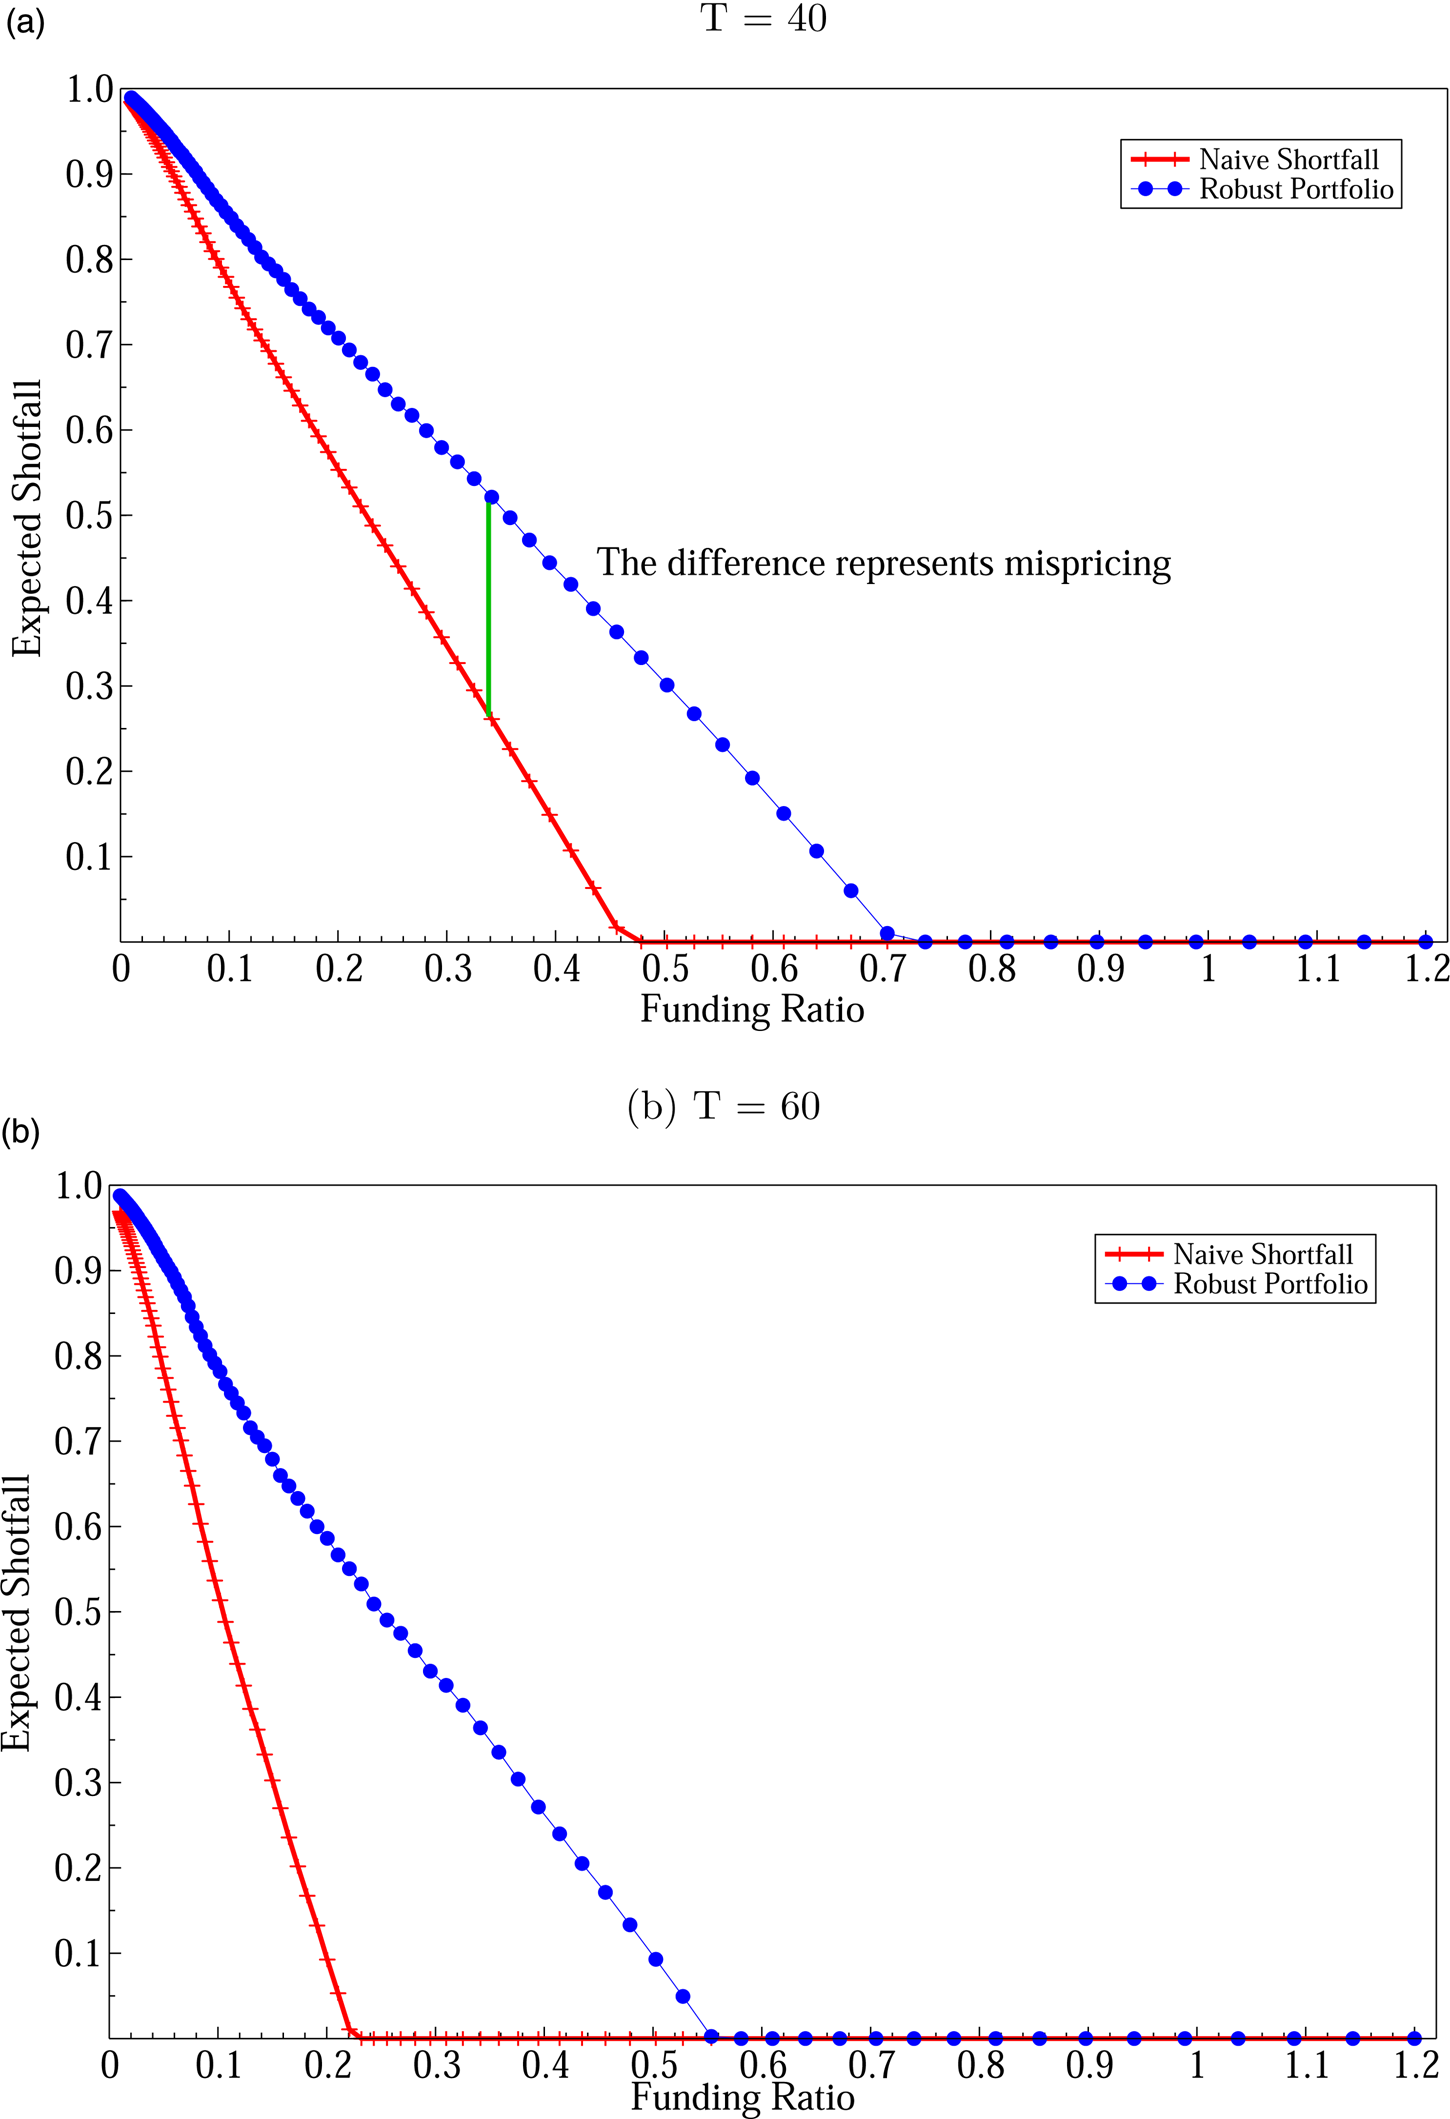
To take a closer look at Figure 7, in Figure 8 we plot the two hedging-policy implied expected shortfalls together, over the instantaneous funding ratio. We present two scenarios: when hedging horizons is 40 years (see Figure 8a); and when T is 60 years (see Figure 8b). We summarize two features of the hedging-policy driven expected-shortfall functions from Figure 8. First, the robust expected shortfall is much higher than the naive one when the instantaneous funding ratio is low. For example, when the instantaneous funding ratio is 0.5, naive investors with a 40-year hedging horizon believe that the point-estimate driven hedging strategy can fully replicate the long-term cash flow. The corresponding expected shortfall at T = 40 is close to zero. However, robust investors are much more pessimistic about the hedging performance, as their expected shortfall is 0.35 unit higher the naive expectation. The difference between the two expected shortfall lines reaches maximum at a certain point and starts to reduce when the funding ratio deviates from that certain point. For example, when T = 60 the largest gap between the two expected-shortfall curves occurs when instantaneous funding ratio is 0.22. The gap reduces to zero either when the current funding ratio approaches to zero or when it is beyond 0.55. In short, the expected shortfall at T implied by different hedging policies can be substantially different, especially for long-term investors. In other words, ignoring parameter uncertainty may result in an underestimated shortfall risk. Second, the maximum gap between the two policy-implied expected shortfalls increase with the investment horizon. The increasing gap is driven by the accumulative fear of the underestimated long-term bond premia.
Optimal expected shortfall (2). The figure plots the robust expected shortfall against the naive one as a function of funding ratio when hedging horizon is 40 years (a) and when the horizon is 60 years (b).

5.2 Robust term structure
An investor is interested in the optimal strategy that guarantees the liability with the lowest required initial wealth X*. Such an optimal strategy is called the super-hedging strategy if the guaranteed commitment can be fully replicated. Once the minimum wealth X* is determined, one can derive implicitly a T-period discount rate, since X* can also be interpreted at the price of a T-period zero-coupon bond. Therefore, the hedging-strategy driven T-period discount rate is given by

In Section 5.1 we have shown replication portfolios with and without the preference for parameter uncertainty. These portfolios are constructed based on a minimum expected-shortfall hedging criteria which aims at replicating non-tradable ultra-long-term liability risk as much as possible when market is incomplete. In our framework, a super-hedging strategy does not exist. There is always a small probability of underfunding, for the interest rate process is Gaussian. Instead, we introduce an approximate risk-free rate obtained via the minimum wealth requirement that targets an expected-shortfall threshold of less than S,

where $X_S^\ast$ is the minimum wealth requirement that guarantees a targeting shortfall level of S. The lower S is, the more initial wealth is required to hedge against the targeting shortfall risk, hence the lower y(T) will be. The lowest level of y(T) is simply the underlying term-structure model that by definition guarantees zero expected shortfall.
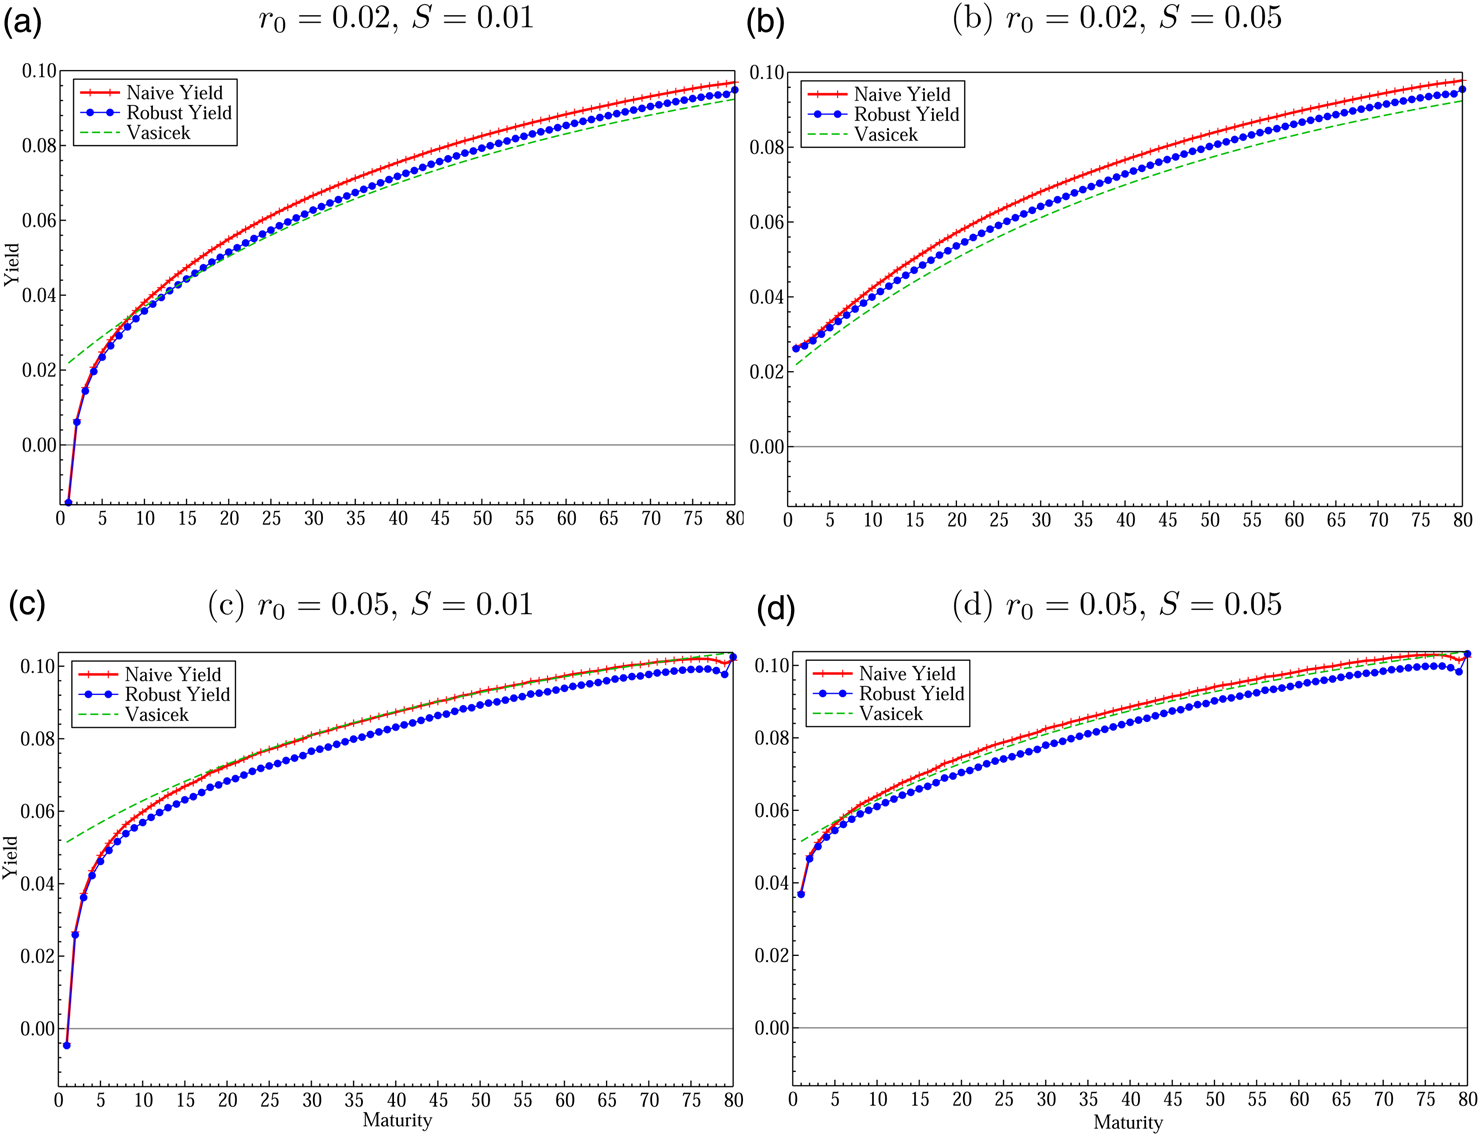
Figure 9 presents the yield curves driven by different hedging policies, different targeting shortfall levels and different spot rates. As a benchmark, we plot the two hedging-policy based yield curves together against the Vasicek yield curve. We highlight two crucial insights from Figure 9. First, the robust yield is always lower than the naive yield regardless of the current spot rate or the shortfall target. Due to the concerns about an under-estimated bond premium, a robust investor requires more initial wealth to meet the shortfall target. Second, both policy-based yield curves are higher than the Vasicek curve when the spot rate is low (Figure 9a and b). This implies the model-based yield curve will present a higher value of liability and hence will require more initial wealth to meet the long-term commitment than the hedging-policy driven curves. The model-based curve implicitly assumes a zero-shortfall requirement, and hence has a lower yield curve compared with the other two curves which allow for positive expected shortfalls. We also find that the Vasicek yield curve overlaps the naive curve when the spot rate is high if S is sufficiently small (Figure 9c).
Robust yield curve. The figure plots policy-based yield curve again the benchmark Vasicek yield curve under different spot rate and shortfall target. The benchmark yield curve by definition has zero expected shortfall.

6. Conclusion
This paper introduces a robust leveraged bond portfolio to replicate the ultra-long-dated pension liabilities. Our approach overcomes some key disadvantages of the traditional inter- and extrapolation approach. First, our method extends the market-consistent valuation enforced by Solvency II toward and beyond the market last liquid point. Second, we assume investors are aware of parameter uncertainty and have a fragile believe of the point estimate. Under our framework, both the optimal hedging-policy implied liability values and the yields are resilient against parameter uncertainty.
We adopt an option-style objective function to find the optional dynamic hedging policy and use the robust control technique to deal with the concerns of parameter uncertainty. The optimal hedging portfolios are obtained numerically using backward robust LSMC methods. The robust policy suggests a more aggressive risk appetite than the naive police due to concerns of an over-estimated bond premium from the point estimate. Preference for parameter uncertainty induces an additional demand for liquid long-term bonds. The leveraged weight on the long-term bond increases with the investment horizon and when the funding ratio is low.
The yield curve derived from the robust-hedging policy is lower than the naive curve, indicating that the preference for prudence results in a higher value of liability or a higher solvency requirement. Although the robust policy requires more initial wealth to guarantee a certain level of shortfall risk, it provides a more successful and resilient hedge, especially in a disordered environment where the bond premium is misspecified. When spot rate is low, both hedging-policy implied yield curves (with or without the preference for robustness) are higher than the model-based yield curve.
There are at least two directions in which future research along these lines would be interesting. First is to expose mean-reversion parameter under the risk-neutral measure, $\kappa ^{\cal Q}$ , to uncertainty. Our current stylized layout limits the max-player's decision interacting min-player's decision. Considering $\kappa ^{\cal Q}$
 uncertainty will drive the perturbation terms to higher moments and will make the two players' decisions interact each other's. Second, our robust model is applicable to any term-structure model, and the Vasicek model used in this paper is simply a start. We can reexamine our hedging problem under various interest-rate models.
Appendix A: Robust LSMC algorithm
In this section, we elaborate the numerical method used in this paper. We show how the regression-based method works in our robust-hedging problem and we also analyze the accuracy of our algorithm. This section proceeds as follows: we first introduce the naive LSMC algorithm without considering model uncertainty. Second, we show how nature's choice can be solved analytically. Third, we explain the robust LSMC algorithm. Last, we analyze the accuracy of our algorithm.
A.1. Grid generation
The hedging period is from 0 to T. We partition [0, T] into m subintervals of length Δt = T/m. Hence the bond portfolio is rebalanced every Δt unit of time. We start by simulating N trajectories of m time periods of spot rate under ${\cal P}$ measure using discrete Euler approximation:

with Z a standard normal random variable. We indicate the spot rate at time t in trajectory i by r i,t, i = 1, …, N, t = 0, Δt, …, T − Δt, T. At step 0, r 0 is also random with mean θ and volatility $\sigma /\sqrt {2\kappa }$ .
Next, we need to generate an M-dimensional grid of funding ratio. Funding ratio at time t is defined as a fraction of instantaneous wealth against the hypothetical bond price maturing at T, P(t, T). The funding ratio grids are indicated by FR j, j = 1, …, M. The reason for choosing funding ratio grid instead of wealth grid will be explained later in the LSMC algorithm.
We also generate a small grid of testing portfolios, denoting w h, h = 1, …, H. We assume the portfolio grid is bounded between 0 and twice of delta hedge Δ = B(T)/B(τ 2), w h ∈ [0, 2Δ].
As a benchmark, we choose Δt = 0.25, $N = 10\comma \;{\kern 1pt} 000$ , M = 40 and H = 5.
A.2. LSMC
The problem is solved by means of simulation based dynamic programing. We outline the general recursion. We first explain the naive case. In addition to the generated grids of the state variables, we also generate N paths of gross bond returns based on point estimates of bond premia $\hat{\lambda }_0$ and $\hat{\lambda }_1$
 :

The gross bond return at time t in trajectory i is denoted by R i,t+Δt.
Time T − Δt. The problem at time step T − Δt can be summarized by

We first generate a time-dynamic wealth grid denoting X j,T−Δ = FRj × P(T − Δt, T), where P(T − Δt, T) is the hypothetical bond price at time T − Δ maturating at T depending on r T−Δt.
The reason we choose a fixed funding ratio grid instead of a fixed wealth grid is because our value function depends on terminal wealth X T, keeping wealth grid fixed cannot guarantee us a reasonable range of terminal wealth, typically for long hedging horizon and when recursion approaches to time step 0.
Next we construct the realized terminal wealth under each simulated path (i, j):

The realized objective function is $V_{ijh\comma T}\lpar {{\cal F}_{T-\Delta t}} \rpar = \lpar {1-X_{T\comma ijh}\lpar {{\cal F}_{T-\Delta t}} \rpar } \rpar ^ +$ . Next, we regress the realized value function with a polynomial expansion of the state variables:

where IFR is an indicator function, with IFRj = (1 − FRj)+.
It is noticed that, along each path, the conditional variables are known hence the conditional expectation of the approximation regression is a quadratic function of the portfolio weight. Therefore, minimizing the conditional expectation boils down to minimizing a quadratic function of portfolio. We rewrite the conditional expectation of the value function as follows:

where

The optimization problem boils down to solving for the root of equations (A.2), $w_{ij\comma T-\Delta t}^\ast{ = }{-}\lpar b_{ij}/2c_{ij}\rpar$ if c ij > 0.
Time t = T − 2Δt, …, 0. We now discuss the general recursion of all any other point in time. Suppose we have optimized the hedging policy as of time t + Δt onward. The realized value function at time t is given by

where X j,t = FRj × P(t, T). Next, we approximate conditional expectations $\lsqb {V_{ijh\comma T}{\rm \mid }{\cal F}_t} \rsqb$ by functions of state variables and the testing portfolio:

Last, we rewrite the conditional expectation of each path as a quadratic function of portfolio w t and solving for the root:

We need to re-calculate the dynamic allocation T/Δt times to retrieve the optimal decision now w 0 that we are interested in. Along this way, we have also obtained all other optimal portfolios for different hedging horizons τ < T.
A.3. Closed-form nature's choice
Next, we consider the robust case when bond premia are misspecified. A straight forward but more complicated method is to repeat the naive algorithm over a set of testing bond premia taking into uncertainty set constraint. Then we obtain a set of naive optimal policies under each path conditional on a testing bond premium. Then we could find the optimal nature's choice under each path either by grid search or using regression based method. However, neither methods are efficient nor accurate. If we use grid search method, we need to generate a fine grid of λ 0 and λ 1. This costs a huge computational memory. Unlike the portfolio weight, the quadratic approximation does not work in the nature's choice (λ 0, λ 1) due to low R 2.
A more efficient and accurate method we proposed is to approximate the expected shortfall by a function of bond return. Remark: this only works because we have simplified the problem so much that only Λ is uncertainty. We find that value function is monotonically decreasing with bond return. The approximation is sufficiently accurate since R 2 is nearly one. Therefore, we transform a maximization problem to a minimizing bond return problem, which can be analytically solved by linear programing.
To test the validity of the new methods, we first generate L pairs of testing MPR denoting (λ 0,l, λ 1,l), with l = 1, …, L and $\lpar {\lambda_{0\comma l}\comma \;\lambda_{1\comma l}} \rpar \in {\bf S}$ . Under each pair of testing MPR, we simulate N paths of gross bond returns over m periods. The gross return at time t in path i under testing MPR (λ 0,l, λ 1,l) is denoted by R il,t+Δt.
At step T − Δt, we construct realized value function V ijl,T based on mul-specification of bond returns R il,T using a random fixed portfolio weight, then we approximate the conditional value function as a function of R il,T and fund ratio:

The goodness of fit is larger than 0.99 regardless of the portfolio weight we choose. We find that the conditional expectation of value function is a strict downward sloping convex function of R il,t. This property holds for the entire hedging horizon if we recurse the algorithm backward until step 0.
Therefore, the global maximization problem boils down to minimizing bond return which is equivalent to minimizing bond premia since nature can only control over the drift term of bond diffusion process. Furthermore, the ellipsoid uncertainty set ${\bf S}$ is convex, hence the minimum bond premium should locates on the ellipsoid.
The resulting nature's optimal decision depends only on the instantaneous spot rate r t.
A.4. Robust LSMC
We can follow the naive LSMC algorithm to calculate the robust optimal portfolio expect that we first need to analytically solve for nature's choice at each backward step in time. Hence at time t, realized value function contains both optimal portfolios as well as nature's choice of bond premia from steps onward:

where $R_{i\comma t + \Delta }^\ast$ indicates the optimal bond return at time t on path i with optimal MPR $\lambda _{0\comma t}^\ast{ + } \lambda _{1\comma t}^\ast r_{i\comma t}$
 .
A.5. Goodness of fit
We investigate the accuracy of our algorithm by means of R 2. The R 2s of parameterization regression at step T − Δt are higher than 0.995 for both naive and robust case. The goodness of fit by construction has to decay backward of time, because we are accumulating cross sectional information over each time period onward. The quality of the global quadratic approximation depends on R 2 at first approximation step T − Δt and the speed of decaying. The longer the hedging horizon is, the lower R 2 will be at time 0. i.e., If T ≤ 20 years, R 2 at time 0 is higher than 95%. If we set investment horizon extremely long, T = 80 years, R 2 drops to 0.83 at time step 0. This is still reasonably high, since the last step cross-sectional regression contains 320 time steps of cross-section information. Grid sizes or rebalancing frequency do not influence the goodness of fit.