


Introduction
Global warming caused by growing atmospheric concentration of carbon dioxide and other greenhouse gases is expected to alter the radiation balance of the atmosphere, causing increases in temperature and changes in precipitation patterns and other climatic parameters. One of the most significant likely potential consequences of global warming is the alteration of regional hydrological cycles and subsequent changes in river-flow and water-quality regimes (Reference XuXu, 2000). Land snow cover, an important component of the cryosphere, is an active and multivariant component of the climate system. Snow is a sensitive indicator not only of climate change (Reference Foster, Owe and RangoFoster and others, 1983; Reference NamiasNamias, 1985; Reference GleickGleick, 1987), but also of responses to it. The majority of the climatic community are convinced of the occurrence of a pronounced reduction in seasonal snow cover in response to CO2-induced global warming (Reference Robinson and DeweyRobinson and Dewey, 1990; Reference Groisman, Karl and KnightGroisman and others, 1994; Reference Watson, Zinyowera, Moss and DokkenWatson and others, 1996; Reference Aizen, Aizen, Melack and DozierAizen and others, 1997; Reference Frei and RobinsonFrei and Robinson, 1999; Reference BrownBrown, 2000). However, important regional exceptions have been reported (Reference Ke and LiKe and Reference LiLi, 1998; Reference LiLi, 1998; Reference Vaughan, Bamber, Giovinetto, Russell and CooperVaughan and others, 1999; Reference Moore, Holdsworth and AlversonMoore and others, 2002).
The Tarim river basin, the largest inland basin in China, with snowmelt as the main source of replenishment, is one of the catchments that are sensitive to climate change. Climate change may affect snow cover and subsequently alter the river runoff in spring and summer, which will greatly impact socio-economic development, disturb fragile ecosystems and may cause frequent drought/flood disasters. Therefore it is important for local sustainable development to investigate snow-cover change. For the Tarim river basin, whose eco-environmental problems are well known in China and internationally, insufficient attention has been paid to ice–snow hydrology. Studies of its snow cover and its response to climate change have not been carried out. In the present study, based on three datasets, i.e. time series on temperature, precipitation and snow-cover area (SCA) for the basin, we attempt to elucidate the response of snow cover to climate change in the past 20 years, laying the foundation for further studies on water resources and offering a scientific basis for optimal water-resources management and sustainability of local ecological systems.
Study Area
The Tarim river basin, with an area of 1.02×10⁶ km2, covers the entire southern Xinjiang Province in China (Fig. 1). The main stream of the Tarim river basin, 1321 km in length, with a catchment area of 1.76×10⁴km2 with a population of 120 100, is located in the extreme arid region with an annual rainfall of <50mm and a potential evaporation of >2000mma–1. Three river systems, i.e. the Hotan, Yarkant and Aksu rivers, are hydraulically connected to the main stream in its upper reaches. Ice–snow thawing runoff, accounting for 38.5% of the total runoff (Reference Xu, Takeuchi and IshidairaYang, 1991), is the only substantial source of water and is vital for local agricultural development.
Sketch map showing the river systems and representative hydrological and meteorological stations in the Tarim river basin.

The climate of the Tarim river basin is characterized by extreme drought, rare precipitation and strong evaporation. In the period 1961–90, the mean annual temperature was 10.6–11.5˚C. The highest and lowest temperatures were 43.6˚C and –27.5˚C in July and January, respectively. The mean annual precipitation was 116.8 mm, with 200–500mm in the mountainous area, 50–80mm in the basin and only 10 mm in the central part of the basin (Reference Hu, Wang, Guo and HuHu and others, 2005).
Datasets
NOAA monthly snow-cover area
NOAA (US National Oceanic and Atmospheric Administration)/NASA Pathfinder Advanced Very High Resolution Radiometer (AVHRR) Land data together with the GTOPO30 digital elevation model have been used to determine the SCA (%) in the Tarim river basin for each month from July 1981 to September 2001. The Pathfinder AVHRR Land datasets are gridded (0.1˚ or 2–8km2) global land surface data derived from AVHRRs on the NOAA/Television Infrared Observation Satellite (TIROS) operational meteorological satellites. The SCA (%) is obtained from visible (channel 1) and near-infrared (channel 4) images based on the method of Reference Ishidaira, Takeuchi, Yamamoto and IshiharaIshidaira and others (2003). It is divided into three main elevation zones, <2500ma.s.l., 2500–5000ma.s.l and >5000ma.s.l., by the snowline distribution in southern Xinjiang. According to the results of a previous study (Reference Guo and ZhaiGuo and others, 2004), the correlation between NOAA and the routine observation for snow-cover days in spring, fall and winter is marked in Xinjiang, especially in the three mountain chains where the source flows originate, so it is considered reasonable and reliable to employ the data of NOAA/AVHRR to analyze the change of snow cover.
Climate data
Two datasets, monthly temperature and precipitation for 1958–2002 from 19 observation stations in the Tarim river basin, were used to analyze the relationship between SCA and climate change. Missing data were interpolated using the weighted average value with distance as inverse ratio from adjacent observation stations within 1˚ latitude (Reference Niu, Chen and WangNiu and others, 2002).
Methods
Mann–Kendall test for monotonic trend
In the Mann–Kendall test (Reference Xu, Takeuchi and IshidairaXu and others, 2003), the null hypothesis H0 states that the data (X 1 , X 2 ,. . ., Xn ) are a sample of n independent and identically distributed random variables. The alternative hypothesis H1 of a two-sided test is that the distribution of Xk and Xj is not identical for all k, j. The test statistic is given as follows:
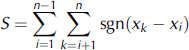
in which Xk and Xj are the sequential data values, n is the length of the dataset, and
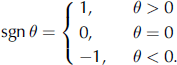
For sample sizes larger than ten, the statistic S is nearly normally distributed, i.e. the statistic
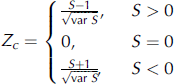
is a standard normal variable. In the equation, the mean value and variance of the statistic S are


where t is the extent of any given tie, and ∑ denotes the summation over all ties.
Gray association for correlation analysis
Another method used in this paper is the gray association analysis (Reference Liu, Han and DangLiu and others, 1999). It estimates the degree of correlation between related variables by constructing a statistic, association degree, which is determined by the similarity of the sequence curves. In this paper, it is employed to judge the possible relationship between the SCA and the climatic variables.
Supposing a sequence Xi = (xi (1), xi (2), . . . , xi (n)), defining a polyline ( xi (1) – xi (1), (i 2) – xi (1), . . . , xi (n) – xi (1)) as Xi – xi (1), then

If the length of X 0 and Xi are the same, and S 0 and Si are defined as in Equation (7), then the ε 0i statistic, namely absolute association degree, is defined as follows:

If the initial values of X 0 and Xi are not equal to zero, call

and

the initial-value image,

then

Thus, the absolute association degree of

and

is the relative association degree, taken as

Finally,

is defined as the integrated association degree, which is used in this paper.
Characteristics of Spatial Pattern of SCA
SCA in different regions
Being surrounded by the Tien Shan, Pamirs and Kunlun Shan to the north, west and south, respectively, the snow-cover distributions of different regions vary according to the different moisture-source conditions. Figure 2 shows the spatial pattern of average SCA during the cold season (November– April) between 1982 and 2001 in the Tarim river basin. It is characterized by uneven geographical distribution and surprisingly pronounced altitudinal variation. The snow cover varies spatially between large mountains and basin. The largest SCA occurs in the Tien Shan, and the second largest in the Pamirs and Kunlun Shan, whereas snow cover in the piedmont oasis is relatively rare.
Spatial distribution of mean November–March SCA in the Tarim river basin: (a) during 1996/97, the year with minimum November– April SCA (17.7%); (b) during 1993/94, the year with maximum November–April SCA (42.4%); and (c) averaged from 1981 to 2000 (27.1%).
To further detect the SCA distribution in the whole area, we partitioned the entire basin into three regions according to the distributional and topographic features of the source streams: (1) the northern region, between the Tien Shan and the Taklimakan Desert, ranging over the Aksu river including ten observation stations; (2) the western region, between the Pamirs and Taklimakan Desert, ranging over the Yarkant river including six observation stations; and (3) the southern part, between the Kunlun Shan and the Taklimakan Desert, ranging over the Hotan river including three observation stations.
Figure 3 shows that the northern, western and southern regions account for 39.9%, 32.4% and 27.7% respectively of the total SCA. This quantitatively explains the spatial pattern of snow distribution in the Tarim river basin and also shows that it is the temperature and moisture differentiation that cause the snow to exhibit horizontal zonation.
Percentage of SCA in the different regions of the Tarim river basin.
SCA at different altitudes
Snow cover in the mountainous region varies with elevation. In accordance with the snowline distribution in the study area, three elevation zones were grouped: <2500ma.s.l., 2500–5000ma.s.l. and >5000ma.s.l. The interannual distribution of SCA in each zone is given in Figure 4. For the zone below 2500 ma.s.l., the highest SCA occurs in January. In the 6 months other than the cold season (i.e. in May–October), SCA approaches zero, so snow in this elevation zone exhibits a distinctly seasonal character. In the 2500–5000m elevation zone, there is somewhat more snow cover, with the highest SCA appearing in January and February. In the zone above 5000 m, the SCA increases markedly, the highest SCA occurs from January to March, and firn exists all year round. The spatial pattern of SCA distribution by altitude shows that height differentiation causes the large discrepancies between the SCA of high mountains and that of plains.
Interannual SCA distributions in the Tarim river basin in different elevation zones: (a) the entire basin; (b) <2500ma.s.l.; (c) 2500–5000ma.s.l.; and (d) >5000ma.s.l.
Characteristics of Temporal Variations of SCA
Annual-cycle change of SCA
The regularity of the annual snow-cover cycle helps to determine agricultural practices in the basin. Large changes in timing (e.g. late or early spring snow-cover dissipation and an ill-timed snow peak) would have a potential impact on socio-economic development. The normal annual cycle of SCA (Fig. 5) shows that snow begins to accumulate in November and reaches a peak in late December or early January, followed by a slow decline until mid-March or early April. The winter (December–February), spring (March–May) and fall (September–November) seasons account for 58.8%, 24.7% and 16.5% of the annual snow storage, respectively.
Annual cycles of SCA in the Tarim river basin based on data during the period 1982–2001: (a) heavy snow year, (b) light snow year and (c) normal snow year.
To detect the annual-cycle change of SCA, a division is made between the 1980s and the 1990s. Some differences between the two decades are observed (Fig. 6). In the 1990s, SCA increased, especially in the winter season, and the rates of snowfall and snowmelt became much higher, so that snow both arrived and disappeared rapidly.
Monthly SCA variations in the Tarim river basin in the 1980s (empty circles) and 1990s (filled circles).
Interannual variability of SCA
The cold-season SCA curve for the entire basin for the period 1982–2001 is given inFigure 7. A slowly decreasing trend is found, with a minimum of 17.44% and a maximum of 42.39% in 1997 and 1994, respectively, implying that the snow has been affected by climate change and was slightly decreasing, although the change was not significant.
Interannual variation of SCA of the entire basin during the period 1982–2001.
Additionally, an increased fluctuation of the annual SCA is found. During the period 1982–88 the standard deviation (SD) and coefficient of variation (CV) of the SCA were only 4.09% and 0.146, respectively, while during the period 1989–2001 they increased to 7.24% and 0.266, respectively. This implies that the amplitude of the SCA was increasing and the snow cover was becoming unstable. Moreover, the pronounced change in SCA started in the mid-1980s when both the temperature and precipitation started to change greatly. Thus, snow can provide a quick and accurate indication of climate change, though the feedbacks differ in the different regions. In the Tarim river basin, the slightly decreasing trend of SCA in the past 20 years was also a strong signal of climate pattern change (Reference Hu, Jiang, Wang and FanHu and others, 2002).
The linear trend of the SCA below 2500 m in each of the regions (Fig. 8) showed an increase, especially in the north, less so in the west and least in the south. The variation coefficients were in the inverse order, i.e. north < west < south. This reflects the fact that snow increased most stably in the north, relatively stably in the west and most unstably in the south of the region.
Interannual and average variations of SCA in different regions of the basin during the period 1982–2001.
The variation trends of maximum, minimum and average SCA in the different altitude zones (Fig. 9) were identical in each zone. The SCA of the zone below 2500ma.s.l. increased, and both the maximum and minimum reached peak values in 2001, indicating that the snow in this zone maintained a stably increasing trend. In the zones between 2500 and 5000m and above 5000 m, the SCA tended to decrease.
Interannual variations of the minimum (empty circles), maximum (filled circles) and mean SCA (triangles) at different altitudes: (a) 2500 m; (b) 2500–5000 m; and (c) >5000 m.
SCA Response to Climate Change
Association between interannual variability of SCA, temperature and precipitation in the cold season
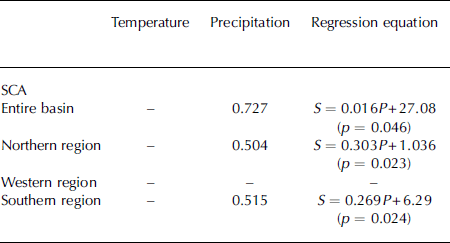
The formation of snow cover is conditional on snowfall and low temperature. To understand the response of snow cover to climate change, it is necessary to understand the linkage of variation between SCA, snow-season temperature and precipitation. Figure 10 shows the interannual variability of SCA, temperature and precipitation in the cold season for different regions of the Tarim river basin. It can be seen that the temperature of the basin and of its different regions has a relatively significant increasing trend, the precipitation does not show any particular trend, while the SCA exhibits a slowly decreasing trend. To diagnose the climate influences on the SCA, we conducted a correlation analysis between them. It was found that SCA is not correlated to temperature but has a strong relationship with precipitation (Table 1).
Results of correlation analysis between SCA, temperature and precipitation in the cold season, and the corresponding regression equations
Variability of SCA (filled circles), precipitation (empty circles) and temperature (triangles) in the cold season in the Tarim river basin for the period 1982–2001: (a) the entire basin; (b) the northern region; (c) the western region; and (d) the southern region. The dashed line shows the linear trend for SCA.
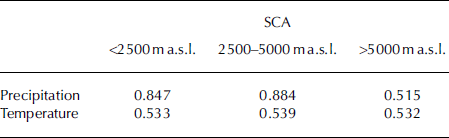
Since snow responds differently to climate change in horizontal regions, we assume that it also has a unique relationship with climatic variables in the vertical direction. In order to find the regularity, a gray correlation analysis was applied, and the association degrees are shown in Table 2. Precipitation was the main factor causing SCA to change in the zone below 2500 m. For the zone between 2500 and 5000 m, the association degrees between SCA and precipitation or temperature were the largest for any of the three regions, implying that this was the most fragile zone in terms of its sensitivity to both temperature and precipitation change, because abundant seasonal snow is found here. For the zone above 5000 m, the association degree indicates less sensitivity to climate change, due to the presence of a great deal of modern glacier ice and firn. However, the decreased amount of snow in this zone reveals that it has been affected by climate change, which is consistent with the previous study by Reference LiuLiu and others (2006). In summary, in each altitude zone the SCA has been jointly affected by precipitation and temperature, but the types of change vary. The SCA at lower altitude was prone to be influenced by precipitation, while that at higher altitude was responsive to temperature change.
Gray correlations between SCA at different altitudes and precipitation and temperature
Testing for trends in time series of SCA, temperature and precipitation in the snow season
Searching for long-term trends in snow-cover variation forced by climate change may provide a starting point for understanding the future behavior of SCA. Results of Mann– Kendall tests for time series of SCA, snow-season temperature and precipitation are listed in Table 3. They do not show a general and uniform trend of SCA over the Tarim river basin, which is in accordance with the analysis above, indicating that some discrepancies exist among the different regions and altitude zones affected by climate change. Over the basin as a whole, SCA exhibits a negative trend. Although the rate of decrease is small, it is statistically different from zero. The long-term trend of the SCA is in good agreement with the snowfall trend, but is contrary to regional warming. It is to be expected that the evident warming in the basin is accompanied by a decrease in snow cover. The present study suggests that global warming has affected the SCA in the Tarim river basin, though it may have different impacts on snow cover worldwide.
Mann–Kendall long-term trend tests for snow cover, snow season temperature and precipitation in the snow season over the Tarim river basin. β is the slope of the trend, H 0 is the null hypothesis that there is no trend in the time series, A means that H 0 is accepted and R means that H 0 is rejected

Conclusions
-
1. From high mountains to basin, SCA gradually decreases with changing altitude and thermal conditions. For the three elevation zones, below 2500 m, between 2500 and 5000m and above 5000 m, the SCA peak appears in January, January–February and January–March, respectively. The northern region of the basin, adjacent to the Tien Shan, holds the most snow storage, 39.9% of the total, while the western and southern regions hold 32.4% and 27.7%, respectively.
-
2. The SCA of the entire basin experienced a small decrease as a whole, contrary to the study result by Reference Cui, Wei and LiCui and others (2005). In the vertical direction, the SCA change differed among altitude zones: the zone below 2500m had a clear increasing trend, while the zone between 2500 and 5000 m and the zone above 5000 m had a slowly decreasing trend. Climate change has had an impact on the snow cover in the basin.
-
3. Responses of the SCA to temperature and precipitation show that in the cold winter it is strongly correlated with contemporary precipitation but not with contemporary temperature. In this area, the SCA decreased slightly, though indistinctly, denying the existence of an increasing trend statistically. The clear increase in winter temperature has not changed the negative temperature condition on which snow depends. Furthermore, precipitation was not closely correlated with temperature in this area, so winter precipitation was seldom affected by local temperature (Reference LiLi, 2001). Consequently, snow was more sensitive to precipitation than to temperature change.
-
4. The correlation analysis between SCA and precipitation and temperature at different altitudes showed that at lower altitude SCA was prone to be influenced by precipitation, while at higher altitude it was responsive to temperature change.
-
5. Snow in the cold season decreased with the enhanced temperature in winter, and the rates of both snow accumulation and ablation were faster in the 1990s than in the 1980s, which is likely to result in earlier snowmelting peaks, a shorter melting period and increasing snowmelt-generated runoff, thus affecting local economic activities, especially the water-use season for agriculture.
Acknowledgements
We acknowledge the financial support of the following grants: the Key Project of Knowledge Innovation of the Chinese Academy of Sciences (KZCX2-YW-127, KZCX2-XB2-03), National Natural Science Foundation of China (grant Nos. 90502004 and 40671014) and National Scientific and Technological Support Project (2006BAC01A03).



