Clostridioides difficile is the most common cause of healthcare-associated infection and is increasingly recognized as an important pathogen in the community. Reference Magill, Edwards and Bamberg1 Using laboratory data from 10 states participating in the Emerging Infections Program (EIP), the Centers for Disease Control and Prevention (CDC) estimates that there were >462,000 cases of C. difficile infection (CDI) in 2017. Reference Guh, Mu and Winston2 CDI is associated with increased risk for hospitalization, skilled nursing care, long-term care facility transfer, healthcare costs, and death. Reference Olsen, Stwalley, Demont and Dubberke3–Reference Kwon, Olsen and Dubberke6 Much remains unknown regarding risk for CDI in younger adults because most studies focus on infection in the elderly. In addition, few data are available regarding the risk of CDI in adults insured by the Medicaid program, who have higher comorbidity burden compared to adults in general. Reference Chapel, Ritchey, Zhang and Wang7,Reference Boersma and Ward8 A better understanding of CDI burden in younger adults and in those insured by Medicaid is needed to develop newer prevention strategies that can be applied not only to the elderly but also to younger and medically vulnerable adults. Reference Guh, Adkins and Li9,Reference Czepiel, Drozdz and Pituch10
The IBM® MarketScan® commercial database and the multistate Medicaid database include inpatient and outpatient medical claims that can be used to study persons aged <65 years. The Chronic Condition Warehouse database contains medical claims for persons enrolled in fee-for-service Medicare plans. We used these data to determine CDI incidence based on type of health insurance in US adults from 2011 to 2017.
Methods
We conducted a retrospective cohort study using the 2010–2017 Medicare Chronic Condition Warehouse 5% random sample and the IBM MarketScan commercial and multistate Medicaid databases. Eligibility criteria for the MarketScan populations included those aged 25–64 years and for the Medicare population those aged ≥65 and older with Parts A and B fee-for-service enrollment and no health maintenance organization enrollment. Persons with continuous enrollment in Medicare but no claims during the study period were excluded to ensure that persons were alive and using their health benefits.
Patients coded for CDI from 2011 to 2017 were identified using International Classification of Disease, Ninth Revision, Clinical Modification (ICD-9-CM) diagnosis code 008.45 and ICD-10-CM diagnosis codes A04.71 and A04.72 in the inpatient, outpatient services, or facility header files (MarketScan), and the inpatient, outpatient, carrier (ie, physician) or skilled nursing facility files (Medicare). The date of CDI onset was defined as the first date with a coded diagnosis of CDI, unless coding for diarrhea or claims for bacterial stool cultures or C. difficile testing were available to define earlier onset. Reference Dubberke, Olsen and Stwalley11 To avoid misclassification of recurrent CDI as an incident case, at least 84 consecutive days without coding for CDI was required to be eligible for another incident CDI episode.
The MarketScan and Medicare populations were divided into groups based on enrollment in Medicaid using dual status indicators in the Medicare data. CDI episodes were categorized as healthcare-associated CDI (HCA-CDI, including hospital-onset, other facility onset, healthcare facility associated, and indeterminate classification) or community-associated CDI (CA-CDI) using standard surveillance definitions, Reference Cohen, Gerding and Johnson12 as described previously. Reference Olsen, Young-Xu and Stwalley13 Long-term care facility stay was identified in the Medicare data using the Centers for Medicare & Medicaid Services Minimum Data Set version 3.0 assessment of nursing home patients. For the MarketScan data, we used a validated algorithm to identify residents of long-term care facilities. Reference Yun, Kilgore and Curtis14 We categorized CDI as hospitalized if CDI was coded during a hospitalization, or nonhospitalized if CDI was diagnosed and treated solely outside a hospitalization.
To determine subgroups at higher risk of CDI in the MarketScan population, we calculated 1-year CDI incidence rates from 2012 to 2017 based on coding for chronic medical, immunocompromising, or neither chronic medical nor immunocompromising conditions in the first year of insurance enrollment beginning in 2011. Reference Elixhauser, Steiner, Harris and Coffey15,Reference Klabunde, Potosky, Legler and Warren16 Chronic medical and immunosuppressive conditions included those identified as indications for pneumococcal vaccination in nonelderly adults. 17 In calculations of CDI incidence, individuals coded for both chronic medical and immunocompromising conditions were counted only in the immunocompromising category.
Statistical analysis
CDI incidence rates were calculated using all person years (PY) of observation from 2011 to 2017 and individually for each year by insurer and by age group. Comparisons of incidence rates by age group and year were performed using PROC Genmod in SAS software (SAS Institute, Cary, NC) with Poisson link and offset using log(PY). Reference Chu18 Tests for linear trend were performed using PROC GLM. Comparisons of incidence rates between commercially insured and Medicaid-insured individuals were performed using MedCalc version 20.018 software (MedCalc Software, Ostend, Belgium).
The prevalence of chronic medical and immunosuppressive conditions in the MarketScan Medicaid population compared to the commercially insured population was determined using 2 one-sided t tests (TOST) in SAS software using PROC TTEST. The null hypothesis for the TOST test is that prevalence values are different; thus, a significant result indicates equivalence. We used equivalence ranges of ±2.5% and ±5.0% for conditions with prevalence <10% and >10%, respectively. Reference Tatem, Romo and McVeigh19
Results
From 2011 to 2017, 78,166 CDI episodes were identified in 71,668 elderly persons in the Medicare data, for an overall incidence of 798 per 100,000 PY. Of these, 52,242 episodes occurred in persons insured by Medicare only and 25,924 in persons dually insured by Medicare plus Medicaid. Approximately 27% of the younger Medicaid population were Black. In the elderly population, 14% of persons insured by Medicare plus Medicaid were Black compared to 4.5% of the Medicare-only population (Table 1). The overall CDI incidence from 2011 to 2017 was 618 per 100,000 PY in persons insured by Medicare alone, and the CDI incidence was 3.1-fold higher (1,935 per 100,000 PY) in persons dually insured by Medicare plus Medicaid (P < .001). In the same period, 102,240 CDI episodes were identified in 90,587 persons aged 25–64 years in the MarketScan commercial database, and 28,024 episodes in 24,047 persons were identified in the Medicaid database. The overall incidence from 2011 to 2017 in younger adults was 73 per 100,000 PY in the commercially insured population and was 2.7-fold higher (195 per 100,000 PY) in those insured by Medicaid (P <.001). CDI incidence by year and Medicaid status for the 2 populations are shown in Supplementary Table 1 (online).
Characteristics of Patients with CDI, 2011–2017, by Medicaid Status

Note. CDI, Clostridioides difficile infection; N/A, not available.
a Healthcare associated CDI using the strict definition of HCA-CDI (healthcare-facility-onset CDI) or community-onset CDI (CA-CDI) with patient discharged from a healthcare facility in the prior 4 weeks.
b Indeterminate CDI was defined as community-onset CDI and patient was discharged from a healthcare facility within the prior 4–12 weeks.
Incidence of healthcare- and community-associated CDI
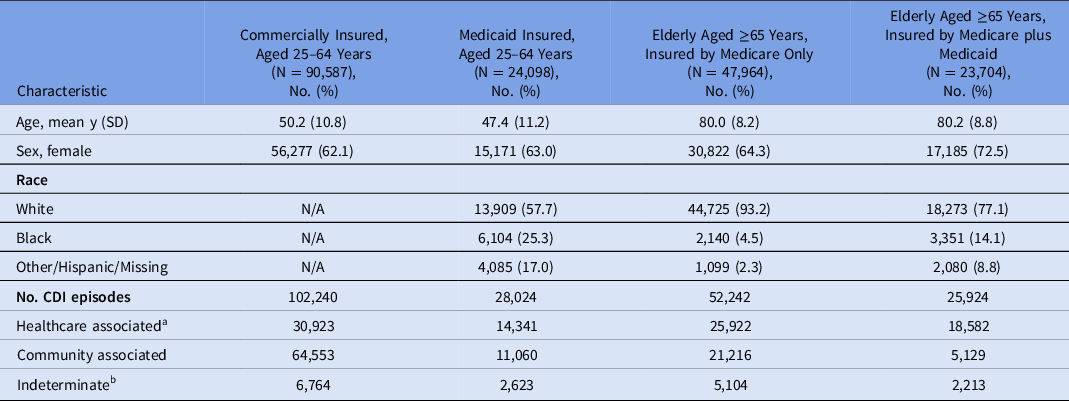
The HCA-CDI rate declined significantly from 2011 to 2017 in the MarketScan Medicaid population (124.0 to 95.2 per 100,000 PY; P = .028), but it remained stable in the commercially insured population (25.9 to 24.8 per 100,000 PY; P = .85) (Fig. 1A and Supplementary Table 2 online). The percentage of CDI cases categorized as HCA decreased from 67.6% to 56.8% in those insured by Medicaid and from 42.5% to 31.6% in the commercially insured population (Supplementary Fig. 1 online). In the Medicare population, HCA-CDI rates declined significantly from 2011 to 2017 in both the Medicare-only population (403 to 318 per 100,000 PY; P < .001) and the Medicare plus Medicaid population (1,770 to 1,163 per 100,000 PY; P = .002) (Fig. 1B and Supplementary Table 2 online). CA-CDI rates increased slightly from 2011 to 2017 in the MarketScan Medicaid population (59.4 to 72.5 per 100,000 PY; P = .14) but more substantially in the commercially insured population (35.0 to 53.7 per 100,000 PY; P = .003) (Fig. 1C and Supplementary Table 2 online). CA-CDI rates increased significantly in the Medicare-only population (197 to 297 per 100,000 PY; P < .001) but did not change in the Medicare plus Medicaid population from 2011 to 2017 (347 to 358 per 100,000 PY; P = .62) (Fig. 1D and Supplementary Table 2 online).
Healthcare-associated and community-associated CDI rates per 100,000 person years of observation, 2011–2017. (A) MarketScan aged 25–64 years, healthcare-associated CDI. (B) Medicare aged ≥65 years, healthcare-associated CDI. (C) MarketScan aged 25–64 years, community-associated CDI. (D) Medicare aged ≥65 years, community-associated CDI.

Incidence of healthcare- and community-associated CDI by age group
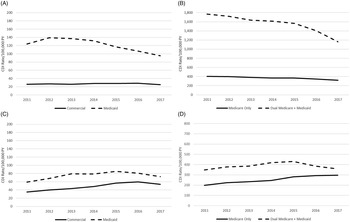
Incidence rates of HCA-CDI from 2011 and 2017 by age group are shown in Fig. 2 and Supplementary Table 3 (online). The incidence of HCA-CDI increased significantly with age in younger and elderly persons insured by Medicaid. The HCA-CDI incidence rates were lowest in commercially insured younger adults in all years. The reduction in HCA incidence in those insured by Medicaid from 2011 to 2017 was most pronounced in the older age groups in both the younger adult population (aged 50–64 years) and the elderly population (aged ≥75 years).
Healthcare-associated CDI rates, 2011–2017, by age group and insurer. (A) MarketScan aged 25–64 years. (B) Medicare aged ≥65 years.

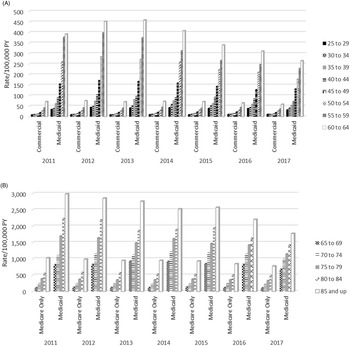
Rates of CA-CDI increased with age in younger commercially insured and Medicaid-insured adults and in elderly persons insured by Medicare only (Fig. 3 and Supplementary Table 4 online). Although CA-CDI rates increased with age in older Medicare-plus-Medicaid dually insured adults, the trend of increasing rates with age was not significant from 2014 to 2016.
Community-associated CDI rates, 2011–2017, by age group and insurer. (A) MarketScan aged 25–64 years. (B) Medicare aged ≥65 years.

Incidence of CDI treated during a hospitalization
Rates of CDI treated in the hospital in the younger Medicaid-insured MarketScan population decreased from 151.9 in 2011 to 116.8 per 100,000 PY in 2017 (P = .022). In contrast, rates of CDI treated in the hospital in the commercially insured population were stable from 2011 to 2017 (35.8 to 36.6 per 100,000 PY, respectively; P = 0.28). In the Medicare plus Medicaid population, rates of CDI treated in the hospital decreased significantly from 2011 to 2017 (1,201 to 778 per 100,000; P = .004), and rates of CDI treated in the hospital in the Medicare-only population decreased from 363 to 299 per 100,000 PY during this period (P = .007) (Supplementary Fig. 2 online and Supplementary Table 5 online).
Incidence of CDI in younger adults with and without chronic medical and immunosuppressive conditions
To further investigate disease burden in the younger MarketScan population by payer we determined the CDI incidence in persons with codes for chronic medical and immunocompromised conditions and the prevalence of those conditions. For comparison, we determined CDI incidence in persons with neither chronic medical nor immunocompromised conditions.
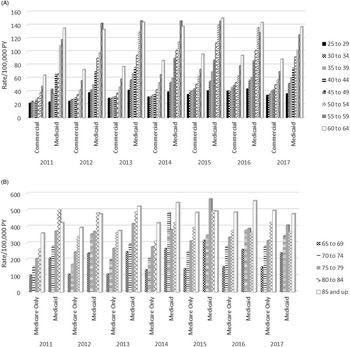
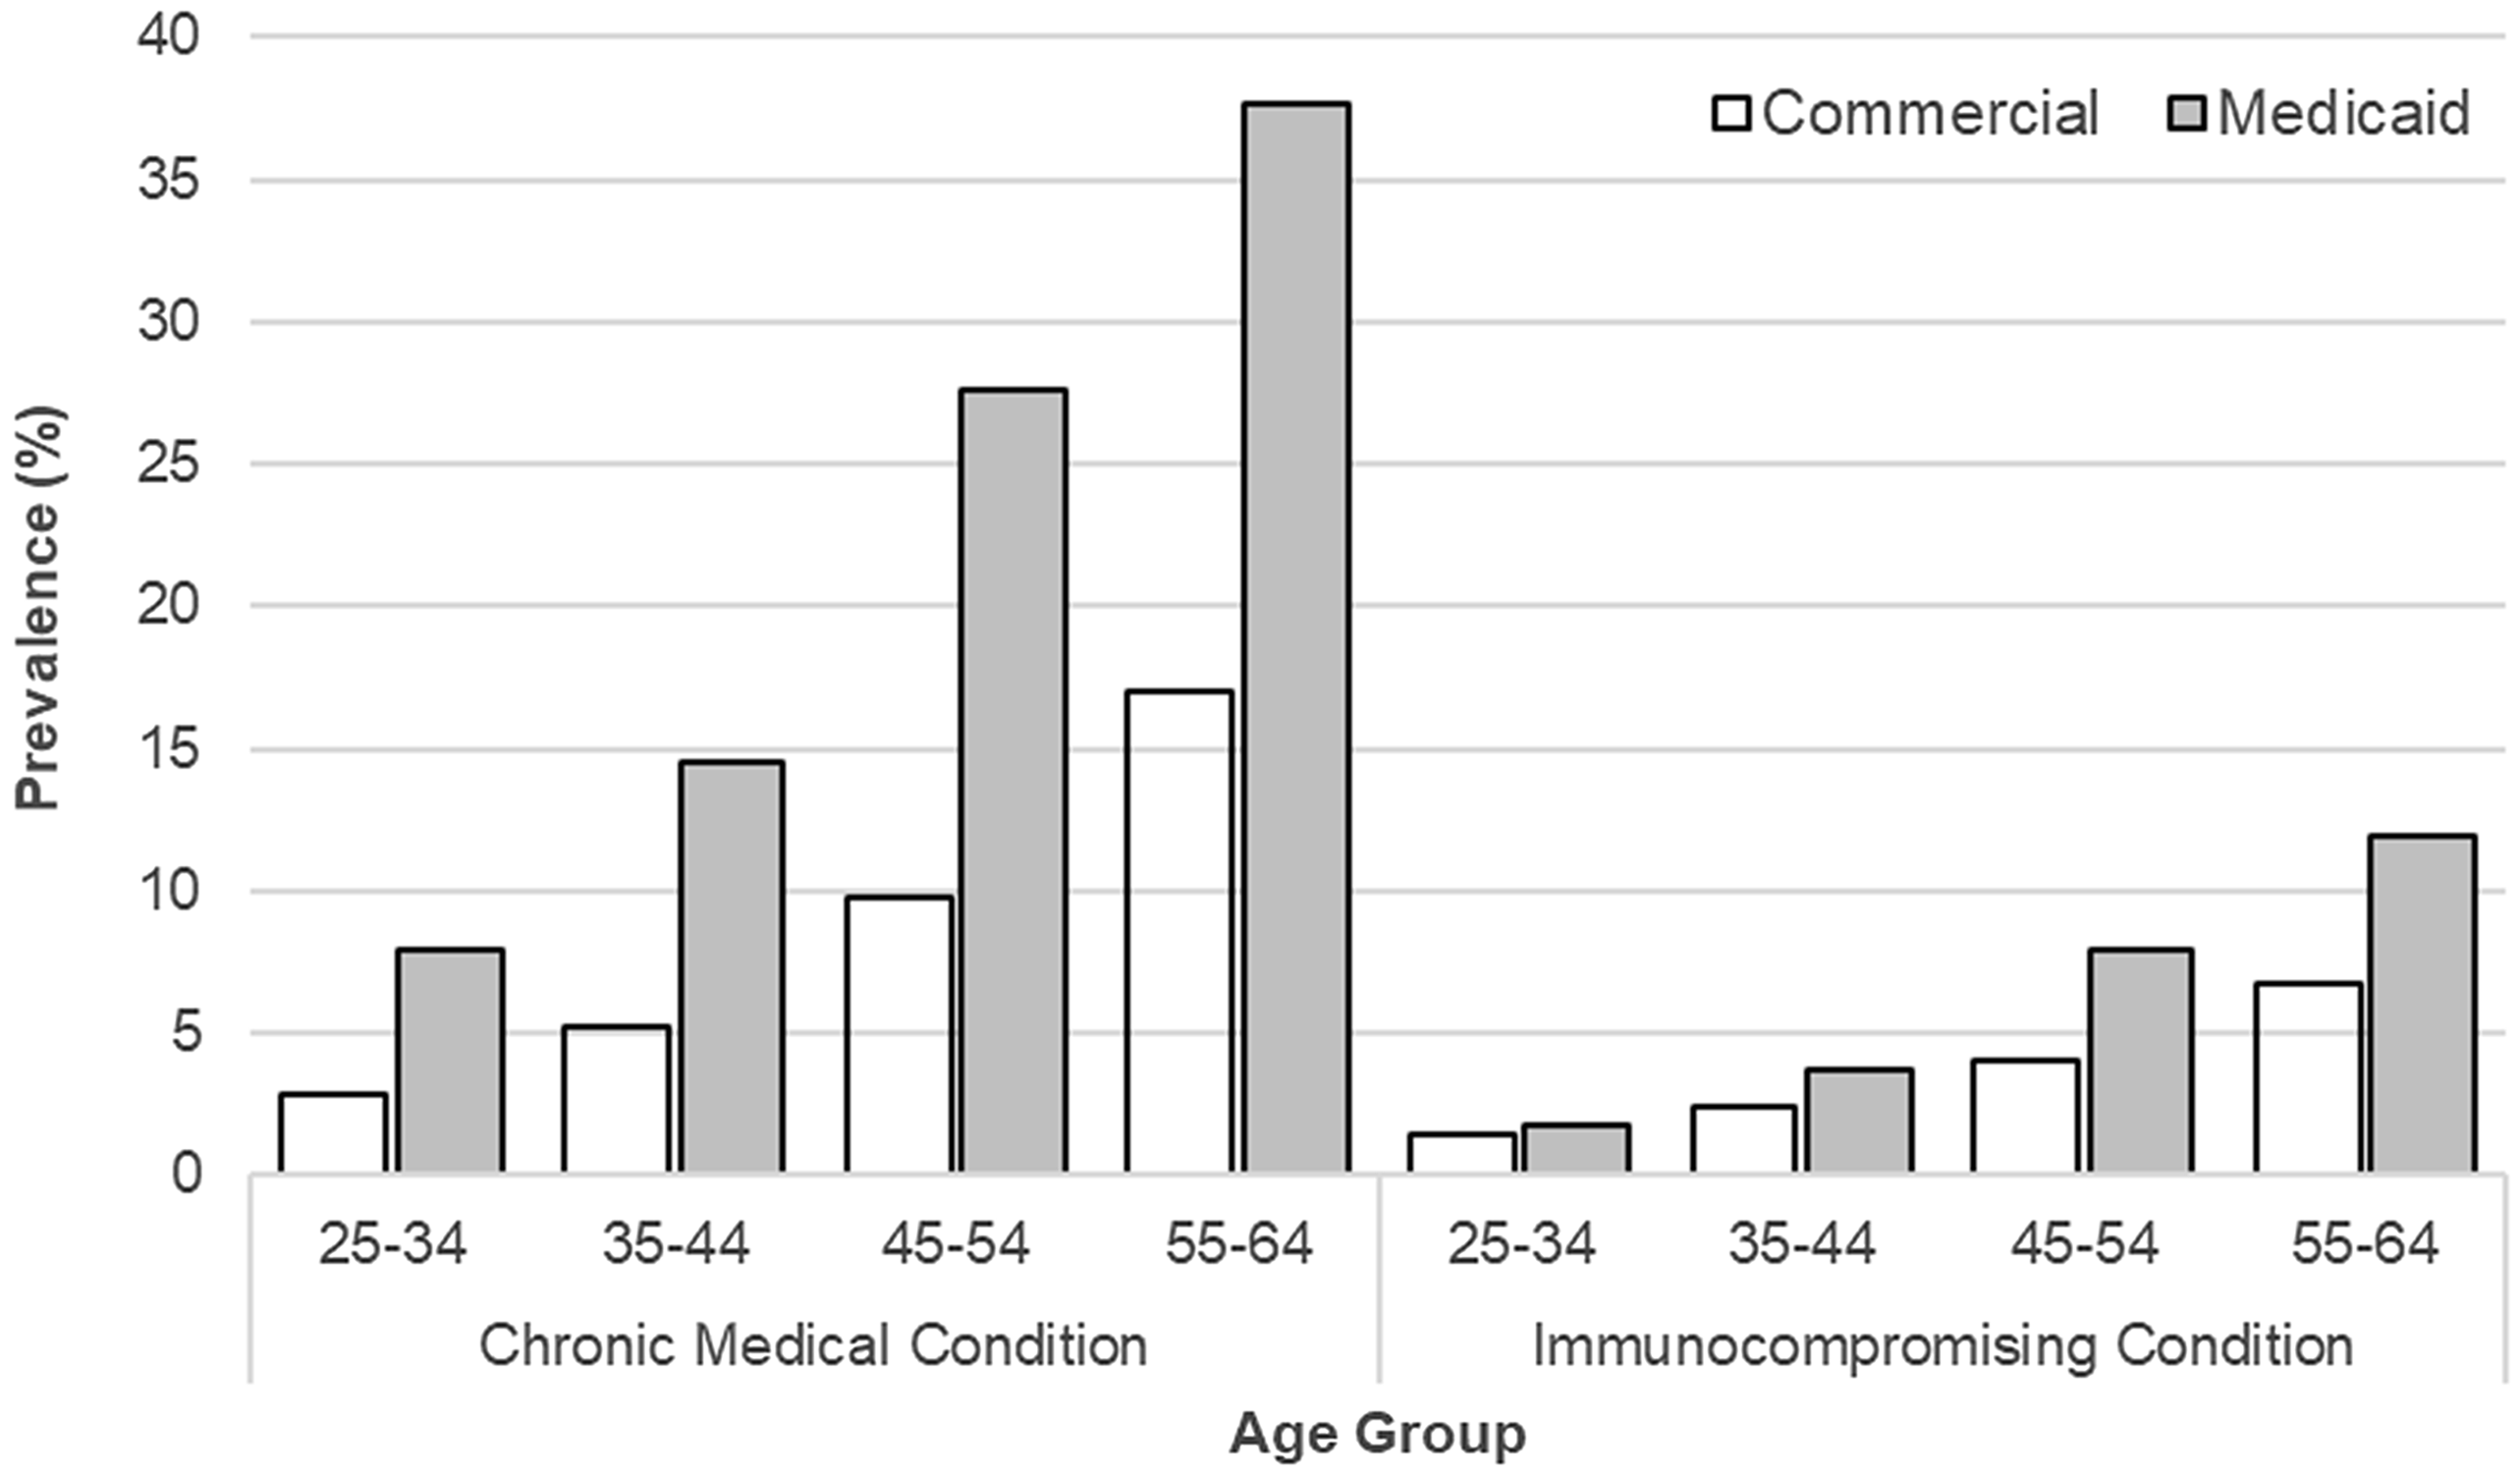
The prevalence of chronic medical conditions was 17.2% in persons aged 25–64 insured by Medicaid compared to 8.6% in the commercially insured population (nonequivalent, 5% threshold). The prevalence of immunocompromising conditions was slightly higher but equivalent in persons insured by Medicaid compared to those who were commercially insured (4.7% and 3.6%, respectively). The prevalence of chronic medical conditions increased progressively with age and were 2.2- to 2.8-fold higher in the Medicaid population compared to the commercially insured population (Fig. 4). The prevalence of immunocompromising conditions was similar in those aged 25–34 years, but this prevalence increased with age more in the MarketScan Medicaid than in commercially insured persons. The Medicaid-to-private prevalence ratios were 1.9 and 1.8 in the 2 older age groups (Fig. 4).
Prevalence of chronic medical and immunocompromising conditions with age, Marketscan aged 25–64 years.

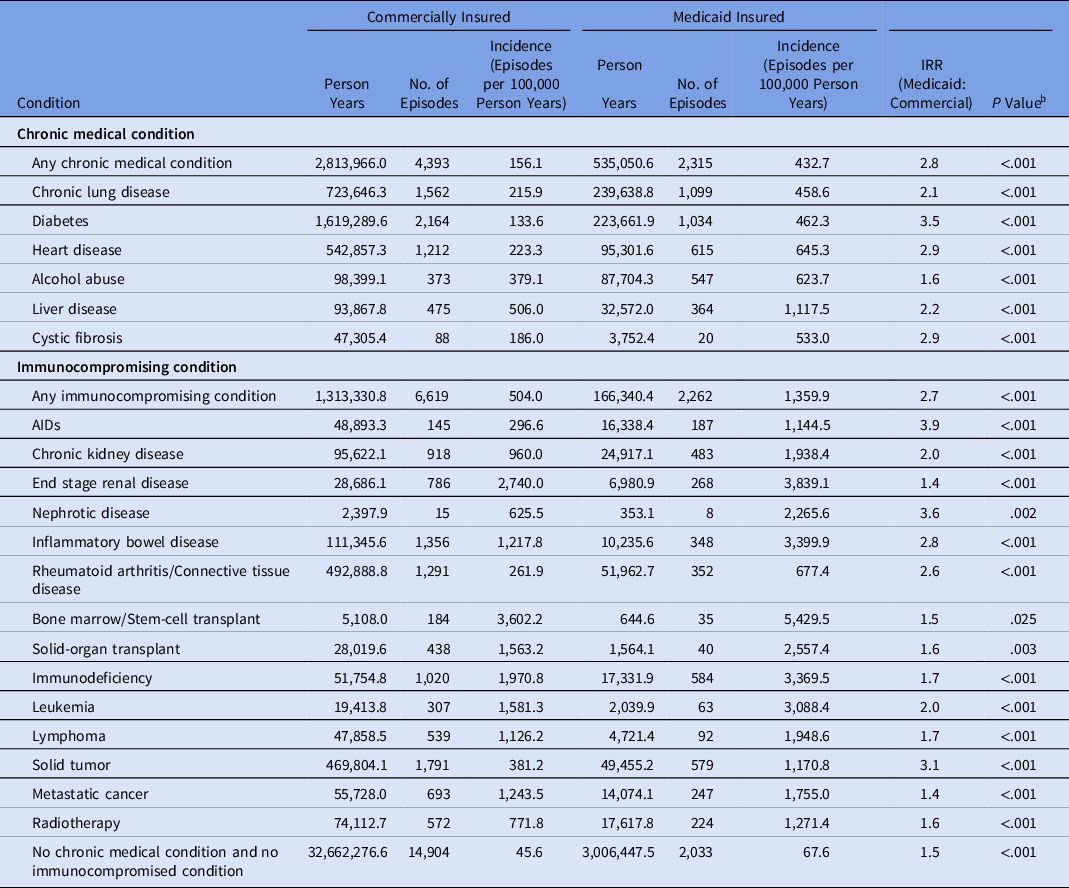
The CDI incidence in those with chronic medical conditions was 2.8-fold higher in persons insured by Medicaid compared to those who were commercially insured (432.7 vs 156.1 PY; P < .001) (Table 2). Similarly, the incidence of CDI was 2.7-fold higher in persons insured by Medicaid with an immunocompromising condition(s) compared to commercially insured persons (1,359.9 vs 504 PY; P < .001) (Table 2). The incidence of CDI was much lower in persons with neither a chronic medical nor immunocompromised condition in both the Medicaid-insured and commercially insured populations (67.6 and 45.6 per 100,000 PY, respectively). CDI incidence rates for all individual conditions were significantly higher in persons with Medicaid compared to commercial insurance (Table 2).
One-Year Incidence of CDI Per 100,000 Person Years from 2012 to 2017 in Persons Aged 25-64 Years with Commercial or Medicaid Health Insurance By Coding for Immunocompetent and Immunocompromising Conditions During their First Year of Enrollment a

Note. CDI, Clostridioides difficile infection; IRR, incidence rate ratio; AIDS, acquired immune-deficiency syndrome.
a The first year of enrollment in the commercial or Medicaid database, 2011–2017.
b All comparisons of incidence rates between commercially insured and Medicaid-insured persons were significant with P < .001, except cystic fibrosis (P = .025) and nephrotic syndrome (P = .002).
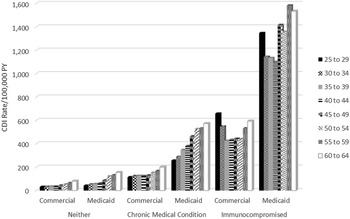
CDI incidence in persons with chronic medical conditions increased significantly with age (P = .002 in commercially insured and P < .001 in the Medicaid insured), although CDI incidence in all ages was higher in the Medicaid-insured population than in the commercially insured population, ranging from 2.3- to 3.6-fold (Fig. 5). In contrast, CDI incidence in those with immunocompromised conditions increased slightly with age in the Medicaid population (P = .05) but was stable with increasing age in the commercially insured (P = .70). As with chronic medical conditions, the incidence of CDI was much higher in the Medicaid population compared to commercially insured persons with immunocompromised conditions in all age groups, ranging from 2.0- to 3.2-fold. Although CDI incidence increased with age in both commercially insured persons and Medicaid-insured persons with neither chronic medical nor immunocompromising conditions (both P < .001), the incidence rate ratio (IRR) in those aged 60–64 years versus 25–29 years was greater in those insured by Medicaid (IRR, 3.7) than in the commercially insured population (IRR, 2.5) (Fig. 5).
One-year incidence of CDI per 100,000 person years from 2012 to 2017 based on prevalence of chronic medical conditions, immunocompromised conditions, and neither conditions in the MarketScan commercial and Medicaid populations by age group.

Discussion
In this study, the overall burden of CDI from 2011 to 2017 was 3-fold higher in lower-income US elderly persons dually insured by Medicare plus Medicaid compared to elderly persons insured by Medicare only. The CDI burden was 2.7-fold higher in the younger population of Medicaid recipients compared to those privately insured. The yearly incidence of CDI declined substantially in elderly persons insured by Medicare plus Medicaid, with a smaller decline in younger persons insured by Medicaid, due to decreases in HCA-CDI. Similarly, rates of CDI resulting in a hospitalization declined by ∼33% from 2011 to 2017 in both younger and elderly persons insured by Medicaid, with a smaller decrease in older persons insured by Medicare only. In younger commercially insured persons and in elderly persons with Medicare insurance only, CA-CDI rates increased ∼50% from 2011 to 2017. CA-CDI incidence also increased ∼20% in younger adults with Medicaid insurance but remained relatively stable in the elderly insured by Medicare plus Medicaid.
A higher risk of CDI in elderly persons dually insured with Medicaid, an indicator of low socioeconomic status, has been reported previously. Reference Olsen, Stwalley, Demont and Dubberke3 Using New Mexico EIP data, Hudspeth et al Reference Hudspeth, Qeadan and Phipps20 found higher incidence of community-acquired CDI in census tracts with a higher proportion of uninsured persons and in Black and American Indian/Native Alaskan men and women. Using 2014–2015 EIP data, Skrobarcek et al Reference Skrobarcek, Mu and Ahern21 found higher CA-CDI rates in lower-income US Census tracts and in tracts with a higher percentage of publicly insured persons. Our work expands on these findings by demonstrating higher risk of CDI in both younger and elderly persons insured by Medicaid, including higher risk of HCA-CDI across the age span in persons insured by Medicaid.
To investigate the higher CDI burden in younger adults insured by Medicaid, we determined the prevalence of chronic medical and immunocompromising conditions. The prevalence of chronic medical conditions was almost three-fold higher in adults aged 25–54 years insured by Medicaid than in those who were commercially insured, and the prevalence of immunocompromising conditions was almost 2-fold higher in Medicaid-insured adults aged 45–64 years compared to those who were commercially insured. This finding is consistent with prior reports that >50% of nonelderly adults insured by Medicaid have at least 1 chronic condition, which is higher than the overall burden of chronic conditions in all adults (including the elderly). Reference Chapel, Ritchey, Zhang and Wang7,Reference Boersma and Ward8 In our analyses of CDI burden, the incidence of CDI was almost 3-fold higher in Medicaid-insured younger adults with a chronic medical condition(s) or with an immunocompromising condition compared to commercially insured adults. Medicaid-insured and commercially insured younger adults without a chronic medical or immunocompromising condition had much lower incidence of CDI. The incidence of CDI increased substantially with age in persons with chronic medical conditions, especially in the Medicaid population. The finding of increased burden of CDI in persons with immunocompromising conditions is not surprising; persons with diseases such as leukemia or lymphoma, end-stage renal disease, and others are at high risk of CDI. Reference van Werkhoven, van der Tempel and Jajou22,Reference Ramesh and Yee23 We speculate that the increased burden of CDI in persons with chronic medical conditions, particularly those insured by Medicaid, is likely due to high exposure to antibiotics. Antibiotic utilization is higher in persons with some chronic medical conditions (eg, diabetes, chronic kidney disease, chronic lung disease, including asthma) than in persons without those conditions, Reference Ramesh and Yee23–Reference Chang, Fan and Kuo26 even in the absence of documented infection. Reference Fleming-Dutra, Hersh and Shapiro27 The increased antibiotic exposure could explain the increased CDI incidence in these persons, particularly in comparison to those without a chronic medical or immunocompromising condition.
During the same period as our study, CDC EIP surveillance reported a decrease in HCA CDI from 93 to 67 per 100,000 persons and a corresponding increase in CA-CDI from 48 to 63 per 100,000 persons. Reference Guh, Mu and Winston2 A similar increase in CA-CDI occurred in Quebec from 2008 to 2015. Reference Zanichelli, Garenc and Villeneuve28 Consistent with the reported increase in CA-CDI, the proportion of CA-CDI in patients admitted to a Southeastern network hospital increased from 49% in 2013 to 61% in 2017. Reference Turner, Grambow and Woods29 The percentage of CDI categorized as CA-CDI also increased in Veterans’ Administration patients aged 18–64 years, ranging from 41% in 2011 to 56% in 2016, with higher CA-CDI proportions in younger compared to older veterans. Reference Russo, Kuntz and Yu30
We found that the decrease in overall CDI incidence during this period in persons insured by Medicaid was due to decrease in HCA-CDI. In the Medicare-only population, the decline in HCA rates from 2011 to 2017 was offset by the increase in CA-CDI incidence, such that the overall CDI incidence increased slightly. Among persons insured by Medicaid, the decreases in HCA-CDI incidence were most pronounced in the oldest age groups (50–64 years in the younger population and ≥75 years in the elderly). Similarly, the incidence of CDI treated during a hospitalization decreased significantly in persons insured by Medicaid from 2011 to 2017 in both the younger population and the elderly population insured by Medicaid plus Medicare, but it changed only slightly for commercially insured and individuals insured by Medicare only.
The observed decrease in HCA-CDI rates may be due in part to the implementation of antibiotic stewardship programs in US hospitals. By 2017, 76% of acute-care hospitals reported meeting the CDC Core Stewardship Elements, compared to 41% in 2014. Reference Pollack, van Santen, Weiner, Dudeck, Edwards and Srinivasan31,Reference Neuhauser32 Several investigators have reported an association of antibiotic stewardship programs with decreased hospital-onset CDI, Reference Morgan, Belal, Lisa, Ford, LeMaitre and Psevdos33–Reference Tamma, Miller and Dullabh35 which may explain the decrease we and others have noted in HCA-CDI in recent years. In contrast, antibiotic stewardship programs have gained much less traction in the outpatient setting, Reference Eudy, Pallotta and Neuner36,37 despite the facts that most antibiotics are prescribed in ambulatory settings and an estimated 30%–50% of these antibiotic prescriptions are considered inappropriate. Reference Fleming-Dutra, Hersh and Shapiro27,Reference Sanchez, Fleming-Dutra, Roberts and Hicks38 We speculate that the increased CA-CDI rates, particularly in younger commercially insured and older persons with only Medicare coverage, may be due to continued overutilization of antibiotics in the community, in addition to increasing use of nucleic acid amplification tests (NAATs), associated with increased CDI test positivity when used as a single test. Reference Polage, Gyorke and Kennedy39 Although NAATs have been increasingly used for CDI testing in hospitals, the widespread implementation of antibiotic stewardship and also diagnostic stewardship programs may have indirectly resulted in less testing for CDI in hospitalized patients, Reference Kang, Abeles and El-Kareh40,Reference Cook, Nichols, Coogan, Opera and DeHart41 contributing to the decrease in HCA-CDI rates observed in our study and by others.
This study had several limitations. We identified CDI using ICD-9/-10 diagnosis codes, which may have resulted in inaccuracy, lack of information on antibiotic utilization in hospitals, and incomplete availability of outpatient prescriptions. The similarity of our overall calculated CDI incidence rates to those reported by the EIP system suggests that inaccuracy in CDI identification based on diagnosis codes was likely minimal. Our analyses of CDI incidence in the elderly were restricted to the fee-for-service population and, thus, may not be generalizable to the elderly insured by Medicare Advantage plans.
The finding of higher risk in Medicaid-insured younger adults with underlying chronic medical conditions and in both commercially and Medicaid-insured younger adults with immunocompromising conditions is particularly important. Heightened awareness of CDI risk and increased emphasis on appropriate utilization of antibiotics are needed in these medically vulnerable persons. Additional broad-based strategies to prevent CDI, including vaccination, are urgently needed to prevent morbidity and mortality, particularly in lower income persons.
Supplementary material
To view supplementary material for this article, please visit https://doi.org/10.1017/ice.2022.208
Acknowledgments
Financial support
This work was supported by Pfizer. The sponsor participated in study design, interpretation of the data and final review of the manuscript. Access to data and additional services were provided by the Washington University Center for Administrative Data Research, supported in part by the National Center for Advancing Translational Sciences of the National Institutes for Health (grant no. UL1 TR002345).
Conflicts of interest
M.A. Olsen reports receipt of grant funding from Pfizer in the past 36 months and personal fees from Pfizer for consulting work. D. Stwalley reports stock ownership in Abbvie and Bristol-Myers Squibb. E.R. Dubberke reports receipt of grant funding from Pfizer, Synthetic Biologics, and Ferring in the past 36 months and personal fees from Ferring, Rebiotix, Summit, Merck, Pfizer, and Seres. H. Yu is an employee of Pfizer. All other authors report no conflicts of interest related to this article.