Phases in transition-metal dichalcogenides
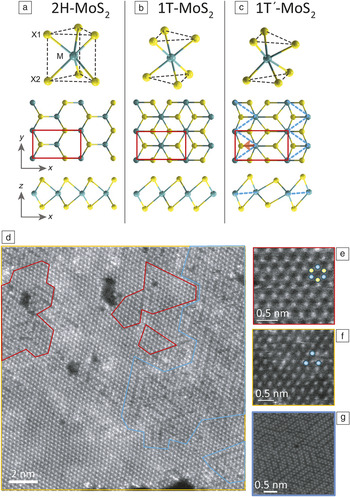
The three phases of semiconducting transition-metal dichalcogenides (TMDs) are shown in Figure 1.Reference Py and Haering1–Reference Qian, Liu, Fu and Li6 The thermodynamically stable 2H phase in TMDs is semiconducting and is the trigonal prismatic structure shown in Figure 1a. It is referred to as the 2H phase because the unit cell extends into two basal planes. This convention is also used for monolayered TMDs. The octahedral metal-ion coordinated 1T phase is metallic and is not found in naturally formed minerals because it is recognized as being unstable (Figure 1b). The 1T′ phase is a distorted version of the 1T phase (Figure 1c). An additional 3R phase is found only in bulk compounds and relaxes to the 2H phase upon mild heating.Reference Schönfeld, Huang and Moss7
(a–c) Atomic model images of the different MX2 transition-metal dichalcogenide phases (M = transition metal; X = chalcogen): 2H, 1T, and 1T′. Data reprinted with permission from Reference 6. © 2014 Cornell University Library arXiv. Red arrow and red rectangles indicate the displacement of the metal atoms and the unit cells, respectively. (d–g) Scanning transmission electron microscopy image of single-layer MoS2 showing the richness of phases in chemically exfoliated nanosheets. 2H (red outline) and 1T phases (yellow outline) along with the strained 1T phase (blue outline) are shown. Mo and S atoms are displayed in blue and yellow, respectively. The corresponding atomic resolution images for (e) 2H and (f) 1T, and (g) distorted 1T, 1T′ phases are shown. Data reprinted with permission from Reference 4. © 2012 American Chemical Society.

Theoretical calculations have indicated that the 1T phase is inherently unstable and cannot be realized, whereas the 1T′ and 2H phases are stable.Reference Calandra8,Reference Kan, Wang, Li, Zhang, Li, Kawazoe, Sun and Jena9 Experimentally, however, it has been found that the 1T′ phase is the least stable and relaxes to the 1T phase that, in turn, relaxes to the most stable 2H configuration (see atomic resolution transmission electron microscopy images in Figure 1e–g).Reference Eda, Fujita, Yamaguchi, Voiry, Chen and Chhowalla4 The 1T phase was realized several decades ago in alkali-metal (Li and K) intercalated TMDs.Reference Py and Haering1,Reference Joensen, Frindt and Morrison2,Reference Tsai, Heising, Schindler, Kannewurf and Kanatzidis10,Reference Yang and Frindt11 Intercalation of TMDs leads to large expansion of the interlayer spacing such that solvation and reduction of intercalants lead to exfoliation into individual layers.Reference Joensen, Frindt and Morrison2,Reference Heising and Kanatzidis3,Reference Tsai, Heising, Schindler, Kannewurf and Kanatzidis10,Reference Heising and Kanatzidis12–Reference Sandoval, Yang, Frindt and Irwin14 These monolayered nanosheets are composed of a large fraction of the 1T phase.Reference Eda, Yamaguchi, Voiry, Fujita, Chen and Chhowalla5,Reference Voiry, Yamaguchi, Li, Silva, Alves, Fujita, Chen, Asefa, Shenoy and Eda15
The conversion of the 2H phase to the 1T phase during intercalation is attributed to charge transfer from the alkali atoms to the nanosheets. This additional charge results in density of states at the Fermi level, rendering the material metallic. More specifically, crystal mean field theory shows that the 2H phase of TMDs such as MoS2 is semiconducting because of symmetry-induced splitting of the Mo 4d orbitals into three groups: the completely occupied Mo 4d zReference Joensen, Frindt and Morrison2 orbital; Mo 4d xy and Mo 4d xReference Joensen, Frindt and Morrison2–y2; and Mo 4d xz and Mo 4d yz that are unoccupied. The S 3p states do not influence the electronic structure of the material, as they are located approximately 3 eV away from the Fermi level. In the case of the 1T phase, the Mo 4d orbitals split into two groups: three degenerate Mo 4d xy,yz,xz orbitals occupied by two electrons; and the unoccupied Mo 4d zReference Joensen, Frindt and Morrison2 and Mo 4d xReference Joensen, Frindt and Morrison2–y2. The incomplete occupation of the Mo 4d xy,yz,xz orbitals renders the 1T phase metallic but also makes it unstable. Completing the occupation of the Mo 4d xy,yz,xz orbitals via additional electrons from dopants stabilizes the 1T phase but destabilizes the 2H phase, thus allowing phase conversion to occur.Reference Kan, Wang, Li, Zhang, Li, Kawazoe, Sun and Jena9,Reference Enyashin and Seifert16,Reference Cheng, Nie, Zhang, Gan, Shahbazian-Yassar and Schwingenschlogl17
In addition to alkali doping via intercalation, substitutional doping with elements with a higher number of valence electrons (e.g., Re, Mn) than transition-metal ions in TMDs can also lead to formation of the 1T phase.Reference Enyashin, Yadgarov, Houben, Popov, Weidenbach, Tenne, Bar-Sadan and Seifert18 Phase transformations have been induced and monitored in real time using transmission electron microscopy.Reference Lin, Dumcenco, Huang and Suenaga19,Reference Wang, Xu, Wang and Bai20 Suenega et al.Reference Lin, Dumcenco, Huang and Suenaga19 showed that under appropriate irradiation conditions, it was possible to reversibly induce the 2H, 1T, and 1T′ phases in MoS2 in a transmission electron microscope. Hot electron injection into MoS2 nanosheets using plasmon resonance from gold nanoparticles has also claimed to induce reversible phase transformations.Reference Kang, Najmaei, Liu, Bao, Wang, Zhu, Halas, Nordlander, Ajayan and Lou21 Reed et al. have theoretically demonstrated that strain and strain engineering are important variables in phase transformations of TMDs.Reference Duerloo, Li and Reed22
Although additional electrons from dopants are required for transformation from the 2H to the 1T phase, the presence of such impurities is undesirable.Reference Lin, Dumcenco, Huang and Suenaga19 The removal of dopants should destabilize the 1T phase. In lithium intercalated TMDs (e.g., LixMoS2), butyl lithium is used. The organic butyl and Li ions can be removed from the MoS2 nanosheets by carefully washing with hexane and water.Reference Voiry, Yamaguchi, Li, Silva, Alves, Fujita, Chen, Asefa, Shenoy and Eda15,Reference Kappera, Voiry, Yalcin, Branch, Gupta, Mohite and Chhowalla23 Surprisingly, the 1T phase remains after removal of the organic and alkali impurities.Reference Eda, Fujita, Yamaguchi, Voiry, Chen and Chhowalla4 “Dry” films of the chemically pure 1T phase TMDs in both multi- and monolayered forms have been demonstrated.Reference Eda, Yamaguchi, Voiry, Fujita, Chen and Chhowalla5 The stability of these films is attributed to the presence of protons or other immobile, positively charged ions on the surface of the nanosheets that counter the additional electronic charge donated by the dopants. The presence of adsorbed, positively charged counter ions on nanosheets is supported by the fact that the 1T phase relaxes to the 2H phase upon annealing to ∼300°C in a controlled environment.Reference Eda, Yamaguchi, Voiry, Fujita, Chen and Chhowalla5,Reference Voiry, Yamaguchi, Li, Silva, Alves, Fujita, Chen, Asefa, Shenoy and Eda15
The ability to controllably induce different phases of the TMDs has led to both fundamentalReference Eda, Fujita, Yamaguchi, Voiry, Chen and Chhowalla4,Reference Qian, Liu, Fu and Li6 and technologically relevantReference Voiry, Yamaguchi, Li, Silva, Alves, Fujita, Chen, Asefa, Shenoy and Eda15,Reference Kappera, Voiry, Yalcin, Branch, Gupta, Mohite and Chhowalla23–Reference Voiry, Salehi, Silva, Fujita, Chen, Asefa, Shenoy, Eda and Chhowalla25 research aimed at exploiting the unique properties of the phases. Recently, it was discovered that the 1T′ phase has unique topological properties that make it applicable for studying novel condensed matter phenomena such as superconductivity.Reference Iwasa, Ye and Zhang26,Reference Yuan, Mak and Law27 The metallic 1T phase is interesting, because it provides high conductivity for charge transfer in electrochemical processes such as catalysis and energy storage.Reference Voiry, Yamaguchi, Li, Silva, Alves, Fujita, Chen, Asefa, Shenoy and Eda15,Reference Voiry, Salehi, Silva, Fujita, Chen, Asefa, Shenoy, Eda and Chhowalla25,Reference Lukowski, Daniel, Meng, Forticaux, Li and Jin28–Reference Wang, Lu, Xu, Kong, Cha, Zheng, Hsu, Yan, Bradshaw, Prinz and Cui31 The ability to locally engineer the various different phases also allows for patterning heterostructures for electronics. We review some recent work on using TMDs as electrodes in electronics, for electrochemical charge storage, and catalysis. We highlight recent advances and demonstrate how phase engineering can be utilized for improving the performance of devices incorporating 2D TMDs.
Two-dimensional TMDs for energy storage
Layered TMD materials were first investigated for energy storage applications in the 1970sReference Whittingham and Gamble32,Reference Dines33 but were abandoned due to their poor stability. More recently, electrodes made from restacked TMD nanosheets have gained interest.Reference Liang, Feng, Yang, Ma, Liang and Chen34–Reference Hwang, Kim and Cho38 The restacked nanosheets consist of exfoliated nanosheets assembled in the form of thin films. Such films expand and contract and allow ions to diffuse in and out of the layered structure. Drexel University scientists recently discovered an entirely new family of 2D materials—early transition-metal carbides and carbonitrides called MXenes.Reference Lukatskaya, Mashtalir, Ren, Dall’Agnese, Rozier, Taberna, Naguib, Simon, Barsoum and Gogotsi39–Reference Naguib, Mochalin, Barsoum and Gogotsi43 These materials are chemically exfoliated from the MAX phases, which are a large family (in excess of 60 members) of hexagonal layered ternary transition-metal carbides and/or nitrides with composition of Mn+1AXn, where M stands for an early transition metal (such as Ti, V, Cr, Nb), A stands for a group A element (such as Al, Si, Sn, In), X stands for carbon and/or nitrogen, and n = 1, 2, or 3. Selective etching of the A-group element from a MAX phase results in the formation of 2D Mn+1Xn layers, labeled “MXene.” Very large volumetric capacitance values in excess of 900 F∙cm–3 have been achieved in MXenes,Reference Lukatskaya, Mashtalir, Ren, Dall’Agnese, Rozier, Taberna, Naguib, Simon, Barsoum and Gogotsi39,Reference Ghidiu, Lukatskaya, Zhao, Gogotsi and Barsoum44 partially because they are highly conducting and hydrophilic.
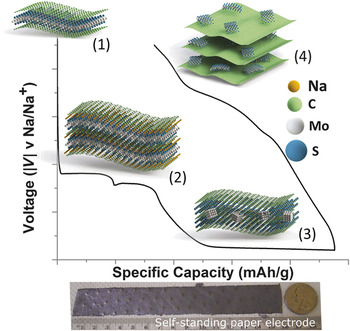
In the case of 2D TMDs, the electrical conductivity of the 2H phase is too low for good electrodes.Reference Cao, Yang, Gao, Liu, Gong, Ma, Shi, Lei, Zhang and Zhang45,Reference Soon and Loh46 Strategies for overcoming the electrical conductivity issue in TMDs for electrochemical charge storage include forming composites with conducting reduced graphene oxide (rGO).Reference da Silveira Firmiano, Rabelo, Dalmaschio, Pinheiro, Pereira, Schreiner and Leite47,Reference Ratha and Rout48 Layer-by-layer stacked heterostructures of rGO and 2D TMDs are being increasingly exploited for energy applications in batteries and supercapacitors (Figure 2).Reference Chang and Chen37,Reference Hwang, Kim and Cho38,Reference Wang, Chen, Chen, Chang, Ma, Huang, Chen and Lee49–Reference David, Bhandavat and Singh51
Acid-exfoliated few-layer molybdenum disulfide (MoS2) and reduced graphene oxide (rGO) flakes for use as a self-standing flexible electrode in sodium-ion batteries. (1) rGO/MoS2 composite electrodes are (2) first intercalated with Na. (3) At higher intercalation (sodiation), MoS2 nanosheets break down to Mo and Na2S. (4) During desodiation, MoS2 nanosheets reassemble. Data reprinted with permission from Reference 51. © 2014 American Chemical Society.

On their own, most 2D TMDs have the ability to store Li+ at higher capacities than graphene-based anodes; however, they are chemically unstable when charged electrically and exhibit poor rate performance (i.e., poor capacitance at high charge/discharge rates) and cycle performance (i.e., poor stability of the electrodes).Reference Peng, Peng, Wu and Xie52 Besides intercalation, there are potential conversion and oxidation reactions, which must be controlled to allow stable and high rate cycling. When cast in the form of a composite with rGO, synergetic interactions with rGO have been shown to mitigate the inherent instability. Besides acting as a conductive additive, rGO sheets play the role of a scaffolding material preventing direct stacking of the 2D TMDs, thus allowing for an expanded interlayer distance that buffers against volume swings during charge and discharge.Reference Luo, Fang, Wang, Zhou, Song and Zhi53
The emerging large-scale battery market demands low-cost and high-power or high-energy density materials. The niche market for 2D TMDs as energy storage materials may be in alternative anode materials in systems such as the sodium-ion battery, which is attractive because of its low cost and natural abundance. Most negative electrodes in sodium-ion batteries use materials that undergo an alloying reaction with sodium. The advantage of the vertically stacked 2D TMD structures is that its weak interlayer bonding buffers against volume swings during charge and discharge cycles.
Molybdenum disulfide can be a good storage medium for sodium ions, based on a combination of intercalation and a conversion-type reaction.Reference Bang, Nam, Kim, Shin, Choi and Choi36,Reference David, Bhandavat and Singh51,Reference Wang, Shen, Wang, Yu and Chen54 Theoretical calculations reveal moderately strong binding between Na and MoS2 that is thermodynamically favorable against cluster formation and phase separation of Na. Thanks to the lower binding energy between Na and MoS2, Na atoms prefer to intercalate in the gap between the MoS2 layers rather than aggregating in the form of clusters. Intercalation of Na in MoS2 gives rise to a maximum theoretical capacity of 146 mAh∙g−1 and a low average electrode potential in the range of 0.75–1.25 V.Reference Mortazavi, Wang, Deng, Shenoy and Medhekar55 If the storage mechanism is based only on intercalation/deintercalation, the obtainable capacity is not impressive. Electrochemical studies reveal, however, that when further discharged to lower voltage (0.01 V), a high capacity reversible conversion reaction can be accessed.
Wang et al. tested an exfoliated MoS2–C composite prepared via chemical exfoliation and hydrothermal reaction (hydrothermal reaction is a synthesis method to produce nanomaterials and crystals from an aqueous solution using high pressure and high temperature); a high capacity of 400 mA h∙g−1 at 0.25 C (100 mA g−1) was maintained over prolonged cycling life.Reference Wang, Seng, Chou, Wang, Guo, Wexler, Liu and Dou56 Outstanding rate capability was also achieved with a capacity of 290 mAh∙g−1 at 5 C. The discharge/charge profile of the composite shows voltage hysteresis and slope characteristics that are typical of a conversion reaction. Three plateaus are observed in the galvanostatic discharge, at 0.9 V, 0.73 V, and 0.1 V. The first strongly pronounced plateau at 0.9 V is indicative of the formation of NaxMoS2; the plateau at 0.73 V is related to further Na ion reaction with MoS2; and the long 0.1 V plateau should be related to the reduction of Mo4+ to Mo metal, accompanied by the formation of Na2S nanoparticles.
The advantage of 2D TMDCs is their ability to be stacked readily to form a paper-like membrane, thus enabling application in flexible batteries. A large-area composite paper (see Figure 2) comprising acid-treated layered MoS2 and chemically modified graphene in an interleaved structure offers a stable charge capacity of 230 mAh∙g–1 and allows room temperature operation, as opposed to most sodium battery materials that can only operate at temperature T > 300°C.Reference Ellis and Nazar57 The interleaved and porous structure of the paper electrode offers smooth channels for sodium to diffuse in and out as the cell is charged and discharged quickly.Reference David, Bhandavat and Singh51
Flexible supercapacitors are very promising emerging energy storage devices and of great interest, owing to their high-power density with improved mechanical behavior and making them suitable as power backups for future stretchable electronics. Recently, there has been substantial interest in improving the conductivity of 2D TMDs by introducing the 1T phase. Although much of this work is preliminary, 1T phase electrodes made from restacked MoS2 nanosheets have conductivity values comparable to those for rGO electrodes.Reference Acerce, Voiry and Chhowalla58 Recent results with VS2 nanosheets, with its permeable scaffolds, metallic properties, and high oxidation state suggest that metallic 2D TMDs are particularly amenable to form supercapacitors with in-plane configurations.Reference Feng, Sun, Wu, Peng, Lin, Hu, Yang and Xie59 A specific capacitance of 4760 μF/cm2 was realized here in an in-plane configuration and a film thickness of 150 nm, of which no obvious degradation was observed even after 1000 charge/discharge cycles. More recent results have shown that the metallic 1T phase electrodes of MoS2 possess volumetric capacitance values in excess of 600 F-cm–3 along with energy and power densities comparable to the best performances of rGO electrodes.Reference Acerce, Voiry and Chhowalla58
TMDs as catalysts for hydrogen evolution reaction
The first report on the hydrogen evolution reaction (HER) activity of bulk MoS2 was published in 1977.Reference Tributsch and Bennett60 Since the performance (an onset potential −0.09 V versus reversible hydrogen electrode [RHE] and a Tafel slope of 692 mV/dec) was not good, MoS2 was considered to be an inefficient catalyst because of its large internal resistance.Reference Tributsch and Bennett60,Reference Tributsch61 Optimal onset potential and Tafel slope should be as low as possible. For example platinum has an onset potential of <20 mV and a Tafel of 30 mV/dec. However, density functional theory calculations by Hinnemann et al. attracted interest because they showed that the free energy of H adsorption on MoS2 edge sites was close to that on both hydrogenase and Pt.Reference Hinnemann, Moses, Bonde, Jørgensen, Nielsen, Horch, Chorkendorff and Nørskov62 Thus, the edges of MoS2 were considered as active sites in catalysis for H2 evolution. This was experimentally proven by Chorkendorff et al. using MoS2 nanoparticles grown on Au (111), which showed high catalytic activity with an onset potential of −0.15 V versus RHE and a Tafel slope of 55–60 mV/dec.Reference Jaramillo, Jørgensen, Bonde, Nielsen, Horch and Chorkendorff63
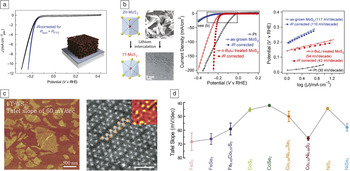
Since then, several approaches to improve the performance of HER have been explored. The first approach is to enhance the intrinsic catalytic activity of TMDs. An example of this is doping MoS2 with Co.Reference Bonde, Moses, Jaramillo, Nørskov and Chorkendorff64,Reference Merki, Vrubel, Rovelli, Fierro and Hu65 The second approach is to increase the number of active sites of the catalyst by controlling the surface properties of MoS2. In some studies, the surface structure of MoS2 was engineered to preferentially expose edge sites.Reference Kibsgaard, Chen, Reinecke and Jaramillo66–Reference Chen, Cummins, Reinecke, Clark, Sunkara and Jaramillo68 Jaramillo et al. synthesized a highly ordered double-gyroid MoS2 bicontinuous network with nanoscale pores (Figure 3a).Reference Kibsgaard, Chen, Reinecke and Jaramillo66 The basal plane of MoS2, which has a limited number of active sites, can be overcome by changing the surface structure. This catalyst showed excellent HER activity, with an onset potential of −0.2 to −0.15 V versus RHE and a Tafel slope of 50 mV/dec. Alternatively, MoS2 and MoSe2 films can be prepared with vertically aligned layers that expose the edges on the film surface.Reference Kong, Wang, Cha, Pasta, Koski, Yao and Cui67
(a) Polarization curves from double-gyroid mesoporous MoS2. The MoS2 surface structure has been engineered to maximize the number of edges exposed to improve the current density. Reprinted with permission from Reference 66. © 2012 Nature Publishing Group. (b) MoS2 sheets: structures of 2H-MoS2 and 1T-MoS2 and their polarization and Tafel curves. Mo and S atoms are displayed in red and yellow, respectively. The regions of onset potentials are indicated by the black dotted box. Polarization and Tafel plots demonstrate the higher activity of the 1T-MoS2 compared to 2H-MoS2 due to the improved nanosheet conductivity. Data reprinted with permission from Reference 28. © 2013 American Chemical Society. (c) Strained WS2 sheets: (left) atomic force microscopy image of chemically exfoliated WS2 nanosheets and (right) a high-resolution scanning transmission electron microscopy (STEM) image of an as-exfoliated WS2 monolayer. A zigzag chain of W atoms (orange dots) from the 1T′ phase is shown to aid the eye. The inset shows the strain tensor map generated from the STEM image using peak pair analysis. Yellow and black colors correspond to regions where the strain is in tension and compression, respectively. Data reprinted with permission from Reference 15. © 2013 Nature Publishing Group. (d) Comparison of Tafel slopes of various pyrite-phase transition-metal dichalcogenides. Low Tafel slopes have been measured from pyrite-phase TMDs, suggesting promising performance for the hydrogen evolution reaction. Data reprinted with permission from Reference 83. © 2013 Royal Society of Chemistry. Note: BuLi, butyllithium; iR correction, correction of the internal resistance; R soln, resistance of the solution; R FTO, resistance of fluorine-doped tin oxide substrate; V, electrical potential of the electrode; J, current density; RHE, reversible hydrogen electrode.

The third approach is to increase electron transport from the active sites to the electrode. Graphene-based TMD hybrids have demonstrated increased HER activity thanks to their high surface area and good electrical conductivity.Reference Li, Wang, Xie, Liang, Hong and Dai69–Reference Yang, Voiry, Ahn, Kang, Kim, Chhowalla and Shin72 Dai et al. reported the synthesis of MoS2 nanoparticles on rGO sheets, which exhibited high HER activity with a small over-potential of ∼−0.1 V, and a Tafel slope as small as 41 mV/dec because of MoS2 particles with an abundance of catalytic edge sites and an interconnected conducting network of rGO-induced efficient hydrogen evolution.Reference Li, Wang, Xie, Liang, Hong and Dai69 Similarly, Liu et al. synthesized MoS2 nanoparticles on mesoporous graphene foams (MoS2/MGFs) combining high specific surface area and an interconnected conductive graphene skeleton.Reference Liao, Zhu, Bian, Zhu, Scanlon, Girault and Liu70 The MoS2/MGF hybrid exhibited excellent electrocatalytic activity for HER with a Tafel slope of 42 mV/dec.
Merki et al. also hypothesized that the edge activity is related to the unsaturated S atom.Reference Merki, Fierro, Vrubel and Hu73 Amorphous MoS2 has defects and unsaturated S atoms, which can contribute to the evolution of H2.Reference Merki, Fierro, Vrubel and Hu73,Reference Vrubel, Merki and Hu74 Hu et al. reported that amorphous MoS3 has more unsaturated S atoms than crystalline MoS2.Reference Vrubel, Merki and Hu74 The amorphous MoS3 particles exhibited highly electrocatalytic HER with a Tafel slope of 41 mV/dec. They claimed that the unsaturated S atoms in amorphous MoS3 can form S–H bonds that facilitate H2 evolution. Recently, Li et al. grew graphene on a 3D Ni foam, and then synthesized MoS2 on the surface through thermolysis of (NH4)2MoS4 at 100–300°C.Reference Chang, Lin, Chen, Hsu, Lee, Zhang, Wei and Li75 Interestingly, the amorphous MoSx obtained at lower growth temperatures of 120°C showed the best electrocatalytic activity with an onset potential of −0.141 to −0.109 V versus RHE and a Tafel slope of ∼43 mV/dec. They explained that the higher HER activity was related to the presence of bridging S22– or apical S2– in the amorphous state. The importance of crystallinity on the HER activity of MoS2 and WS2 has been investigated.Reference Chen, Chang, Hsu, Wei, Chiang and Li76 Note that amorphous MoS2 on carbon cloth exhibited higher activity than crystalline MoS2, whereas WS2 gave the opposite result. The exact reason for the higher activity of crystalline WS2 as compared to amorphous WS2 has not yet been determined.Reference Chen, Chang, Hsu, Wei, Chiang and Li76
1T MoS2 and WS2 sheets for HER
Jin et al. reported a comparison of HER activities between 2H and 1T MoS2 sheets.Reference Lukowski, Daniel, Meng, Forticaux, Li and Jin28 Flower-like MoS2 sheets with a high density of exposed edges were grown using chemical vapor deposition (Figure 3b).Reference Lukowski, Daniel, Meng, Forticaux, Li and Jin28 The as-grown 2H MoS2 sheets were converted to 1T MoS2 sheets by treating them in a n-butyllithium solution. The 1T MoS2 sheets showed improved HER activity with a Tafel slope of 43 mV/dec, compared to the 2H MoS2 sheets with a Tafel slope of 110 mV/dec. This is because the metallic 1T MoS2 sheets exhibit a decreased charge-transfer resistance relative to the as-grown 2H MoS2.
Zhang et al. reported the catalytic activity of 1T phase MoS2 sheets decorated with metal nanoparticles (Pt-, Pd-, and Ag-MoS2) for HER.Reference Huang, Zeng, Bao, Wang, Qi, Fan and Zhang77 The 1T phase MoS2 and Pt decorated MoS2 sheets showed a Tafel slope of 94 and 40 mV/dec, respectively. Chhowalla et al. studied the influence of strain in the 1T phase on the catalytic activity (Figure 3c).Reference Voiry, Yamaguchi, Li, Silva, Alves, Fujita, Chen, Asefa, Shenoy and Eda15 Chemically exfoliated WS2 sheets have a high proportion of strained metallic 1T phase and thus show high HER performance with a Tafel slope of 60 mV/dec. 2H WS2 shows poor HER activity; however, its hybrid form with rGO can be a promising catalyst because the WS2/rGO showed a low over-potential and a Tafel slope of 58 mV/dec.Reference Yang, Voiry, Ahn, Kang, Kim, Chhowalla and Shin72
HER of pyrite TMDs
CoS2 has been investigated as a promising HER catalyst. CoS2 films synthesized by gas-phase reactions showed an over-potential of −180 mV and a Tafel slope of 44.6 mV/dec.Reference Faber, Dziedzic, Lukowski, Kaiser, Ding and Jin78,Reference Faber, Lukowski, Ding, Kaiser and Jin79 CoS2 micro- and nanowires have over-potentials of ∼−100 mV and –70 mV, respectively, and Tafel slopes of 58 mV/dec and 51.6 mV/dec, respectively.Reference Faber, Dziedzic, Lukowski, Kaiser, Ding and Jin78 Recently, CoS2 was synthesized on a large scale by adding GO of sufficient quantity (at least 2 mg/mL) via the hydrothermal method.Reference Peng, Li, Han, Sun, Srinivasan, Mhaisalkar, Cheng, Yan, Chen and Ramakrishna80 The resulting CoS2/rGO hybrid exhibited high electrocatalytic activity with a Tafel slope of 48 mV/dec. In addition, the family of the pyrite phase, including NiS2, FeS2, and CoSe2, also exhibited high activity for HER (Figure 3d).Reference Faber, Lukowski, Ding, Kaiser and Jin79,Reference Wang, Gong, Chou, Pan, Chen, Wu, Lin, Guan, Yang and Chen81–Reference Kong, Cha, Wang, Lee and Cui83
Metallic 1T phase TMDs as electrodes in field-effect transistors
The finite and direct bandgap in single-layer TMDs make them particularly useful for logic devices.Reference Chang, Yang, Lee, Tao, Hwang, Jena, Lu and Akinwande84–Reference Wang, Yu, Lee, Shi, Hsu, Chin, Li, Dubey, Kong and Palacios87 However, despite the fact that the effective masses of the conduction and valence band edges have been calculated to be rather symmetric (an electron effective mass ∼0.57 and a hole effective mass ∼0.66), the MoS2 field-effect transistors exhibit n-type characteristics due to large injection barriers for holes and impractically high contact resistance (kΩ).Reference Yoon, Ganapathi and Salahuddin88–Reference Peelaers and Van de Walle90 Thus a major challenge in single-layer TMD electronics is in the formation of Ohmic contacts to the individual layers. To this end, graphene has been used as an effective low barrier contact.Reference Yu, Lee, Ling, Santos, Shin, Lin, Dubey, Kaxiras, Kong, Wang and Palacios91–Reference Lee, Choi, Lee, Min, Jeon, Hwang, Choi and Im93
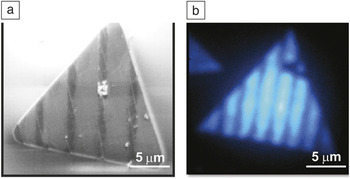
However, the lack of work function matching leads to Schottky junctions at the contacts. One way to overcome this is to utilize the metallic 1T phase of TMDs for contacts. Chhowalla et al. recently demonstrated that the interface between the 2H and 1T phases is structurally coherent.Reference Eda, Fujita, Yamaguchi, Voiry, Chen and Chhowalla4 It has also been demonstrated that it is possible to convert the 2H nanosheets to the 1T phase with fine control and precision by exposing them to n-butyllithium or lithium boron hydride. Patterning of the 1T and 2H phases on the same TMD nanosheet allows the realization of lateral heterostructures such as those shown in Figure 4 that are useful for devices.Reference Kappera, Voiry, Yalcin, Branch, Gupta, Mohite and Chhowalla23,Reference Kappera, Voiry, Yalcin, Jen, Acerce, Torrel, Branch, Lei, Chen and Najmaei24 Using the 1T phase as the source and drain electrodes while keeping the 2H phase as the channel, it is possible to fabricate devices with contact resistance values of ∼200–300 Ω-μm.Reference Kappera, Voiry, Yalcin, Branch, Gupta, Mohite and Chhowalla23 The low contact resistance facilitates charge injection and collection at the electrodes and improves the performance of the devices.
Precise control of phase conversion of MoS2 single-layer triangles. (a) The dark regions represent the 1T phase, while the lighter regions are the 2H phase. (b) Photoluminescence map of the patterned triangle is shown. The bright regions represent the semiconducting phase, and the darker regions represent the metallic 1T phase where the luminescence is quenched. Data reprinted with permission from Reference 24. © 2014 American Institute of Physics.

Conclusion
Exfoliated TMDs are interesting for both fundamental and technologically relevant research. In addition to their chemical versatility, the ability to engineer their phases is an additional variable that can be used to tune their properties. Phase engineering offers unique opportunities for studying and realizing novel phenomena in 2D TMDs.