Introduction
There is currently a debate regarding the requirement for, and the precise roles of, Ca2+ signalling during the sequential stages of cytokinesis, i.e. furrow positioning, propagation, deepening and zipping, in the large zygotes of fish and amphibians. On the whole, evidence has been reported that supports the requirement for a localized elevation in cytosolic levels of intracellular Ca2+ ([Ca2+]i) in the propagation, deepening and zipping of cleavage furrows in the zygotes of medaka fish (Fluck et al., Reference Fluck, Miller and Jaffe1991), zebrafish (Chang & Meng, Reference Chang and Meng1995; Webb et al., Reference Webb, Lee, Karplus and Miller1997; Créton et al., Reference Créton, Speksnijder and Jaffe1998; Chang & Lu, Reference Chang and Lu2000; Lee et al., Reference Lee, Webb and Miller2003) and Xenopus (Muto et al., Reference Muto, Kume, Inoue, Okano and Mikoshiba1996) during the first embryonic cell cycle. These reports reveal a marked degree of similarity with respect to the propagation, deepening and zipping Ca2+ signals, such as: the form they take (∼0.5 to 3.0 μm/s waves); their mode of generation (i.e. release via inositol 1,4,5-trisphosphate receptors, IP3Rs); their elevation above resting levels of [Ca2+]i (i.e. ∼2- to 5-fold); and their close correlation with a specific morphological stage in the cytokinesis process, i.e. either furrow propagation, deepening or zipping (Fluck et al., Reference Fluck, Miller and Jaffe1991; Muto et al., Reference Muto, Kume, Inoue, Okano and Mikoshiba1996; Webb et al., Reference Webb, Lee, Karplus and Miller1997; Chang & Lu, Reference Chang and Lu2000). Furthermore, a variety of attractive possible functions has also been suggested for the elevated Ca2+ transients during furrow propagation, deepening and zipping, such as: the assembly and extension of the actomyosin contractile arc via activated myosin light chain kinase (MLCK) (during furrow propagation: Fluck et al., Reference Fluck, Miller and Jaffe1991; Webb et al., Reference Webb, Lee, Karplus and Miller1997); the stimulation of actomyosin band contraction, again via activated MLCK (during furrow deepening: Fluck et al., Reference Fluck, Miller and Jaffe1991; Chang & Meng, Reference Chang and Meng1995; Webb et al., Reference Webb, Lee, Karplus and Miller1997); the trafficking of intracellular membranes to the furrow surface (during furrow deepening: Jesuthasan, Reference Jesuthasan1998); the exocytosis of cadherins to promote daughter blastomere cohesion (during furrow zipping: Jesuthasan, Reference Jesuthasan1998); and the promotion of vesicle fusion via Ca2+-sensitive SNARES (during furrow zipping: Lee et al., Reference Lee, Webb and Miller2003). It must be noted, however, that the requirement for Ca2+ in the latter stages of cytokinesis (i.e. furrow deepening and zipping) is not free from controversy, as it has also been reported that furrow deepening and zipping in early Xenopus embryos is not associated with a localized elevation of [Ca2+]i (Noguchi & Mabuchi, Reference Noguchi and Mabuchi2002).
It has been suggested that the corticular endoplasmic reticulum (ER) might be the intracellular store from which Ca2+ is released, via IP3Rs, to generate the cytokinetic transients (Fluck et al., Reference Fluck, Miller and Jaffe1991; Chang & Meng, Reference Chang and Meng1995; Muto et al., Reference Muto, Kume, Inoue, Okano and Mikoshiba1996; Webb et al., Reference Webb, Lee, Karplus and Miller1997). Indeed, Lee et al. (Reference Lee, Ho, Wong, Webb and Miller2004) showed that prior to the appearance of the cleavage furrow at the blastodisc surface in zebrafish zygotes, the cortical ER is rearranged in linear tracts that predict where the cleavage furrow will appear. The key role played by Ca2+ release from the ER in positioning the cleavage furrow is supported by evidence from amphibians demonstrating that the microinjection of Ca2+-store-enriched microsomal fractions into dividing newt zygotes can induce the induction of extra furrows at the site of injection via IP3-mediated Ca2+ release (Mitsuyama et al., Reference Mitsuyama, Sawai, Carafoli, Furuichi and Mikoshiba1999; Mitsuyama & Sawai, Reference Mitsuyama and Sawai2001). These experiments clearly link Ca2+ release from the ER with cleavage furrow positioning.
It is, however, in this earliest phase of the cytokinetic process when the detailed nature of, the absolute requirement for, and the precise role played by Ca2+ signalling is less clear and thus poorly understood. Indeed, differences have been reported even in cases where the same embryonic system was examined. For example, in zebrafish zygotes, Chang & Lu (Reference Chang and Lu2000), using a fluorescent Ca2+ reporter (a 10 kDa Calcium Green-1 dextran) and confocal imaging, describe the initial cytokinetic Ca2+ transients that precede (by ‘several minutes’) the appearance of the furrow at the blastodisc surface, as being ‘repetitive calcium spikes’ that occur all over the blastodisc surface then eventually localize to the presumptive furrow plane. On the other hand, Lee et al. (Reference Lee, Ho, Wong, Webb and Miller2004), using aequorin-based luminescent imaging, did not report any spiking activity in the time-frame indicated by Chang & Lu (Reference Chang and Lu2000), but did describe a steady localized Ca2+ rise at the apex of the blastodisc that preceded the appearance of the furrow at this location by approximately 30 s. Thus, in spite of these differences, there is reasonable evidence emerging that some form of Ca2+ signal precedes the appearance of the cleavage furrow at the blastodisc surface in zebrafish zygotes.
In this study we have re-examined the Ca2+ transient associated with furrow positioning in more detail and used our new data to extend what we (and others) have published in the past with regard to this early phase of cytokinetic Ca2+ signalling. Our new data suggest that the furrow positioning Ca2+ transient is a required element in positioning the cleavage furrow at the blastodisc surface of zebrafish zygotes, and thus might be one of the crucial final steps in transmitting positional information from the mitotic apparatus to the blastodisc cortex. We demonstrate that the positioning signal is generated by Ca2+ release via IP3Rs and has a distinct rising phase that differentiates it from the subsequent wave-form of the propagation transient. We propose that the rising phase Ca2+ transient develops into the furrow propagation transient, and we present a hypothetical model to illustrate how individual IP3Rs might sequentially cooperate to generate first a rising phase transient followed by a wave propagation phase via the generation of a Ca2+ blip, followed by a Ca2+ puff that initiates the generation of a Ca2+ wave (Yao et al., Reference Yao, Choi and Parker1995; Bootman & Berridge, Reference Bootman and Berridge1996; Bootman et al., Reference Bootman, Niggli, Berridge and Lipp1997).
Materials and methods
Egg collection
Zebrafish were maintained on a 14 h light/10 h dark cycle to stimulate spawning (Westerfield, Reference Westerfield1994). Fertilized eggs were collected as described elsewhere (Webb et al., Reference Webb, Lee, Karplus and Miller1997). To enhance optical clarity, embryos were dechorionated by treatment with protease (P8811, Sigma; at 1 mg/ml in 30% Danieau's solution) for several minutes at room temperature and then washed several times in 30% Danieau's solution (19.3 mM NaCl; 0.23 mM KCl; 0.13 mM MgSO4.7H2O; 0.2 mM Ca(NO3)2; 1.67 mM Hepes, pH 7.2). The dechorionated embryos were then placed in custom-made holding/viewing chambers (described in Webb et al., Reference Webb, Lee, Karplus and Miller1997) for microinjection and subsequent imaging.
Microinjection of aequorins
The microinjection pipettes, the pressure injection system and the other protocols used for microinjection are described in detail elsewhere (Webb et al., Reference Webb, Lee, Karplus and Miller1997). Approximately 1.2 nl of recombinant f- or h-aequorin (0.5–1% in 100 mM KCl, 5 mM MOPS and 50 μM EDTA; Shimomura et al., Reference Shimomura, Musicki and Kishi1989; The Photoprotein Laboratory, Falmouth, MA) was microinjected into the centre of the yolk of single-cell stage embryos. The injectate was carried into the forming blastodisc by a combination of cytoplasmic streaming and diffusion (Lee et al., Reference Lee, Baker, Galione, Gilland, Hanlon and Miller1996).
Aequorin imaging
Following microinjection, embryos were transferred to our photon imaging microscopes (PIMs; Science Wares, East Falmouth, MA) for data acquisition (for details see Webb et al., Reference Webb, Lee, Karplus and Miller1997). Aequorin-generated and bright-field images were collected using a Zeiss Fluar 10×/0.5 NA objective. After data acquisition was complete, files were downloaded into MetaMorph 6.1 (Universal Imaging, Downington, PA) for detailed quantitative data analysis. Images were then downloaded into Corel PHOTO PAINT 11 and Corel DRAW 11 (Corel Corp.) for figure preparation and presentation.
Ca2+-free experiments
Experiments were performed to determine the source of the Ca2+ transients observed during furrow positioning. Initially, a series of experiments was undertaken to investigate whether Ca2+ was entering the embryo from the outside, i.e. from the external medium. Precautions were taken to ensure that Ca2+-free (i.e. in reality what was probably ultra-low Ca2+) conditions were created and maintained external to the embryos. Thus, embryos were dechorionated as described above and were then maintained in 30% Danieau's solution that had been prepared by omitting Ca(NO3)2, using ultra-pure deionized water to dissolve the remaining Danieau's reagents, and finally adding 5 mM EGTA to chelate any trace levels of contaminating Ca2+. Embryos were placed in viewing/holding chambers that had been rinsed several times with 5 mM EGTA, and the 1% agarose used to prepare the viewing wells in these chambers was made up with the Ca2+-free Danieau's solution. As an added precaution, only a single embryo was placed in each holding/viewing chamber in order to eliminate the chance of Ca2+ being introduced to the embryo-bathing medium as a result of the lysis of neighbouring embryos during the imaging period.
Determination of challenge time
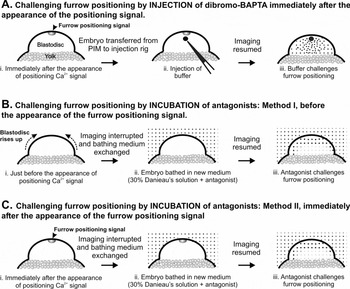
It was important to establish protocols to ensure that the buffer and channel antagonists used reached the apex of the blastodisc cortex in time to have an effect specifically on the furrow positioning process. From our previous imaging studies (Webb et al., Reference Webb, Lee, Karplus and Miller1997; Lee et al., Reference Lee, Ho, Wong, Webb and Miller2004), we determined that the furrow positioning transient lasts for approximately 30–60 s before it develops into the furrow propagation transient. In order to challenge furrow positioning, embryos were removed for either microinjection or medium replacement shortly before or immediately after the furrow positioning transient was observed (i.e. within 10–20 s; Fig. 1). The former was judged via a combination of post-fertilization timing and the physical appearance of the blastodisc, which ‘rises up’ just prior to the furrow positioning signal. These protocols ensured that the furrow positioning Ca2+ transient, and not some other upstream or downstream Ca2+-related signalling event, was being challenged directly.
Schematic representation of the experimental protocols used for challenging the furrow positioning transient with (A) calcium buffer and (B, C) calcium channel antagonists.

Microinjection of dibromo-BAPTA
The need for a localized elevation of [Ca2+]i for furrow propagation and deepening/zipping has been demonstrated previously (Webb et al., Reference Webb, Lee, Karplus and Miller1997; Lee et al., Reference Lee, Webb and Miller2003). Here, experiments were carried out to explore whether localized increases in [Ca2+]i are also required for furrow positioning. Embryos were injected with either f- or h-aequorin, and imaged using our PIMs. Following the protocol described in Fig. 1A, the Ca2+ buffer 5,5’-dibromo-BAPTA (DBB; KD = 1.5 μM, Molecular Probes) was injected into the blastodisc immediately after the appearance of the furrow positioning signal and imaging was then resumed. DBB was prepared as a 25 mM stock solution in ∼18.0 mM CaCl2 and 5 mM Hepes, pH 7.0. The concentration of ∼18.0 mM CaCl2 was used in order to set the level of free [Ca2+] at ∼400 nM, which is well above that reported for the resting level in zebrafish embryos (i.e. ∼60 nM; Créton et al., Reference Créton, Speksnijder and Jaffe1998). Final cytosolic concentrations of between 250 μM and 400 μM DBB were tested, these concentrations being estimated by the method described in Leung et al. (Reference Leung, Webb and Miller1998).
Treatment with Ca2+ channel antagonists
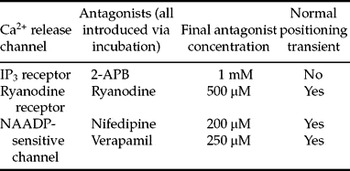
To identify the Ca2+ release mechanism(s) involved in generating the furrow positioning transient, embryos were treated with a variety of Ca2+ channel antagonists. In order to block the furrow positioning transient effectively, cell-permeable antagonists were used because it took less time to change the embryo bathing medium than to microinject antagonists into the embryos. Furthermore, as the Ca2+ transients are generated in the blastodisc cortex, a membrane-permeable antagonist is more likely to reach its target in a shorter period of time than one diffusing from a bolus injected into the blastodisc. Thus, the cell-permeable antagonists of: (1) the inositol 1,4,5-trisphosphate receptor (2-amino-ethoxydiphenyl borate; 2-APB), (2) the ryanodine receptor (i.e. ryanodine at high concentrations; Ehrlich et al., Reference Ehrlich, Kaftan, Bezprozvannaya and Bezprozvanny1994) and (3) the NAADP-sensitive Ca2+ channel (nifedipine and verapamil at high concentrations; Genazzani et al., Reference Genazzani, Mezna, Dickey, Michelangeli, Walseth and Galione1997) were utilized. Ryanodine was prepared at 500 μM in 30% Danieau's solution. Stock solutions of 2-APB (10 mM) and nifedipine (50 mM) were prepared in DMSO, while a stock solution of verapamil (25 mM) was prepared in 30% Danieau's solution. Embryos were incubated in the appropriate concentrations of these antagonists (see Table 1), following the protocols illustrated schematically in Fig. 1B and C.
Summary of the concentrations of Ca2+ channel antagonists used for treating embryos, and their effect on the positioning transient

Extent of the Ca2+ rise
The extent of the Ca2+ rise during the generation of the positioning transient in the presence or absence of channel antagonists was estimated in the following manner. The light output from a selected area of the blastodisc was measured at rest (i.e. before the occurrence of a transient) then measured again during the passage of the transient. Assuming that the luminescence of both f- and h-aequorins varies with [Ca2+] in vivo as it does in vitro, i.e. to the second power (Shimomura, Reference Shimomura1995), and that the resting level of [Ca2+]i in the zebrafish embryonic cytosol is ∼60 nM (Créton et al., Reference Créton, Speksnijder and Jaffe1998), it is thus possible to estimate the approximate Ca2+ rise during the transient. This form of ‘self-calibration’ makes experiment-to-experiment comparison of aequorin-generated data possible, where differences in aequorin loading and the ratio of spent to unspent aequorin (due to successive thawing and refreezing of the aequorin solution) injected into embryos varies.
Results
Characterization of the furrow positioning and propagation Ca2+ transients
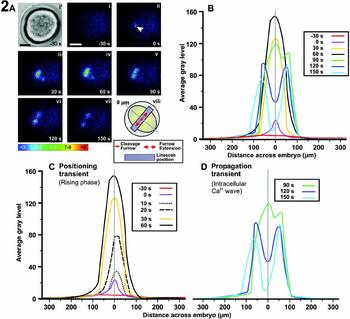
Figure 2A shows an animal pole view of the patterns of luminescence along the first cleavage furrow at 30 s before and then during the first 150 s following the initial appearance of the furrow positioning Ca2+ transient in the central region of the blastodisc. To characterize the nature of the positioning and subsequent propagation Ca2+ transients, a profile showing the intensity of luminescence at each time point in Fig. 2A was plotted both as a single graph (see Fig. 2B) and also as separate positioning transient (Fig. 2C) and propagation transient (Fig. 2D) graphs. In the positioning Ca2+ transient graph (Fig. 2C) two additional time points (i.e. 10 s and 20 s) were plotted in order to confirm the rising dynamics of this transient. These profiles show that whereas the furrow positioning transient displays a distinct rising phase, which occurs in a central position at the apex of the blastodisc (Fig. 2C), the subsequent furrow propagation transient consists of two linear, subsurface, self propagating Ca2+ waves that travel across the surface of the blastodisc (Fig. 2D). The two Ca2+ wave fronts extend out in opposite directions from the centrally located rising phase positioning transient until they reach the edge of the blastodisc. The data thus support the idea that the furrow positioning and propagation transients are indeed two distinct signals, the former being essentially a rising phase transient while the latter takes the form of self-propagating Ca2+ waves, as originally suggested by Webb et al. (Reference Webb, Lee, Karplus and Miller1997). It is clear that the propagation transient arises from the positioning transient, but there is a distinct time delay, of some 60 s from the initial appearance of the positioning transient, before this transition occurs.
(A) Representative animal pole view of an embryo loaded with f-aequorin illustrating the changes in aequorin-generated light during furrow positioning of the first cell division cycle. The pseudo-colour panels represent 10 s of accumulated luminescence. Panels i–vii represent luminescent images obtained at the following time intervals: (i) 30 s before the appearance of the positioning transient; (ii) during the initial appearance of the positioning transient (see arrowhead); then (iii) 30, (iv) 60, (v) 90, (vi) 120 and (vi) 150 s after the initiation of the positioning transient. (i’) A bright-field image of the embryo that was acquired just before pseudo-colour panel i. (viii) Schematic illustration of the embryo to show the location of the cleavage furrow and extension of the furrow as well as the position of the Linescan analysis function, the results of which are shown in (B). Colour scale indicates luminescent flux in photons per pixel. Scale bar represents 200 μm. (B) Analysis of luminescence along the first cleavage furrow during furrow positioning and propagation. The profiles represent the average grey level of photon signal shown in (A) panels i–vii and were measured using the Linescan function in the MetaMorph (version 6.1) image analysis program. Each profile shows the average grey level of photons collected for 10 s. 0 μm represents the location on the blastodisc where the positioning signal was first detected and corresponds to the mid-point of the furrow. (C, D) Analysis of luminescence along the first cleavage furrow during (C) furrow positioning and (D) furrow propagation.

The effect of bathing embryos in Ca2+-free medium on the generation of the furrow positioning Ca2+ transients
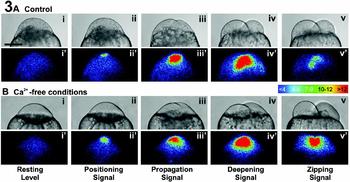
Webb et al. (Reference Webb, Lee, Karplus and Miller1997) reported that embryos divide normally for the first few cell division cycles when bathed in Ca2+-free medium, (i.e. 30% modified Danieau's solution containing 0.3 mM EGTA). In these experiments, we focused specifically on the initial furrow positioning transient and applied more stringent Ca2+-free conditions, i.e. a higher concentration of EGTA (5 mM) was used to ensure that Ca2+ free conditions were set up and maintained for the duration of the experiment. Figure 3 shows the patterns of luminescence during the first cell division cycle of representative aequorin loaded embryos that were incubated either in our usual Ca2+-containing Danieau's solution (Fig. 3A) or in more stringent Ca2+-free Danieau's solution (n = 14; Fig. 3B). Under Ca2+-free conditions, the positioning signal and all subsequent cytokinetic Ca2+ transients still continue to be generated normally for the first cell division cycle, when compared with the control (Fig. 3A). This suggests that the Ca2+ involved in generating these transients is released from internal stores. The bright-field images shown in Fig. 3B panels i to v also clearly show that cytokinesis proceeds normally compared with the control (panels 3A i to v).
The effect of Ca2+-free medium on the furrow positioning signal and subsequent cytokinetic Ca2+ transients during the first cell division cycle. Representative sequences of images from two aequorin-loaded embryos (both in a facial orientation) illustrating the changes in intracellular free Ca2+ when (A) raised under normal conditions and (B) incubated with Ca2+-free medium during the first cell division cycle (see Materials and Methods for details). The luminescent images (pseudo-colour panels labelled i'–v’) represent 60 s of accumulated light. Bright-field images (panels i–v) were grabbed just prior to each luminescent image. Images were obtained at the following time intervals: (i, i’) just prior to the positioning signal which precedes the appearance of the first furrow arc, and then during (ii, ii’) the positioning, (iii, iii’) the propagation, (iv, iv’) the deepening and (v, v’) the zipping signals of the first cell division cycle. Colour scale indicates luminescent flux in photons per pixel. Scale bar represents 200 μm.

The effect of injecting the Ca2+ buffer, dibromo-BAPTA, on the generation of the positioning Ca2+ transient
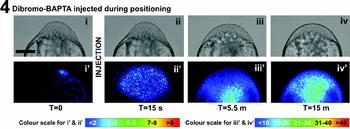
Figure 4 is a representative example (n = 10) illustrating the effect of the Ca2+ buffer 5,5’-dibromo-BAPTA (DBB) on the furrow positioning Ca2+ signal during the first cell division cycle. DBB was injected into the blastodisc of the embryo as soon as the positioning Ca2+ transient of the first cell division cycle was observed (following the protocol illustrated in Fig. 1A). The concentration (25 mM) and amount (1.44 nl) of DBB injected was calculated to result in a final cytosolic concentration of around 330 μM (following the method described in Leung et al., Reference Leung, Webb and Miller1998). The luminescence images displayed in Fig. 4, panels ii'–iv’, clearly illustrate the delocalizing effect of the Ca2+ buffer on the normally compact domain of the furrow positioning transient (i.e. compare Fig. 4 panel ii’ with Fig. 5A panel ii). In the DBB-injected embryos, the corresponding bright-field images (Fig. 4 panels ii–iv) also show that the furrow never physically appears at the blastodisc surface. Thus, the buffer-induced elimination of the localized Ca2+ positioning transient suggests that the Ca2+-related positioning information was never transmitted to the blastodisc cortex, resulting in a failure to position the furrow. The elimination of the furrow positioning signal results in a subsequent failure to generate furrow propagation and deepening/zipping signals, leading to the absence of either a propagating or deepening/zipping furrow. This clearly indicates the absolute requirement for this initial furrow positioning transient.
A representative sequence of images from an aequorin-loaded embryo illustrating the changes in intracellular free Ca2+ after injection with dibromo-BAPTA, following the protocol illustrated in Fig. 1A. The luminescent images (pseudo-colour panels labelled i’ to iv’) represent 60 s of accumulated luminescence. A bright-field image (labelled i to iv) was grabbed just prior to each photon image. Images were collected with the embryo in an axial orientation as follows: (i, i’) during the positioning signal and then (ii, ii’) 15 s, (iii, iii’) 5.5 min and (iv, iv’) 15 min after the dibromo-BAPTA injection. Colour scale indicates luminescent flux in photons per pixel. Scale bar represents 200 μm.

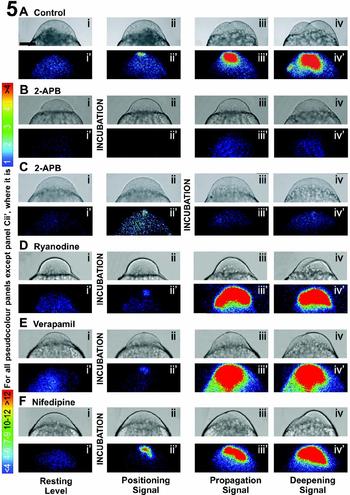
The effect of intracellular Ca2+-release channel antagonists on the furrow positioning Ca2+ signal and subsequent cytokinetic Ca2+ transients. Representative sequences of images from aequorin-loaded embryos illustrating the changes in intracellular free Ca2+ during the first cell division cycle when (A) raised under normal conditions; or when incubated with (B) 2-APB, (D) ryanodine, (E) verapamil or (F) nifedipine before the appearance, or (C) 2-APB after the appearance, of the positioning transient following the protocols illustrated schematically in Fig. 1B and 1C (see Materials and Methods for details). The luminescent images (pseudo-colour panels labelled i’ to iv’) represent 60 s of accumulated light. A bright-field image (i to iv) was grabbed just prior to each luminescent image. Images were obtained as follows: (i, i’) before the appearance of the positioning transient; and then during (ii, ii’) the positioning, (iii, iii’) propagation and (iv, iv’) deepening transients of the first cell division cycle. Colour scale indicates luminescent flux in photons per pixel. Scale bar represents 200 μm.

The effect of Ca2+ channel antagonists on the generation of the positioning Ca2+ transient
The effects of different Ca2+ channel antagonists on the furrow positioning Ca2+ transient and the physical positioning of the furrow during the first cell division cycle are shown in Fig. 5. Figure 5A illustrates a representative control embryo (n = 5) and shows the typical pattern of luminescence observed to accompany furrow positioning, propagation and deepening of the first cell division cycle. Figure 5B shows an example of an embryo (n = 18) treated with the cell-permeable IP3-sensitive channel antagonist, 2-aminoethoxydiphenyl borate (2-APB), shortly before the appearance of the positioning signal, following the protocol described in Fig. 1B. It is clear that the positioning, propagation and deepening transients (see Fig. 5B panels ii'–iv’) of the first cell division cycle are completely abolished after incubation (compared with the control, Fig. 5A panels ii'–iv’). The corresponding bright-field images show that the furrow does not appear at the apex of the blastodisc (see Fig. 5B panels iii and iv). To ensure that the 2-APB was only challenging the positioning signal and not some upstream Ca2+-sensitive step, embryos were also treated with 2-APB immediately after the appearance of the positioning signal. Figure 5C shows a representative example of an embryo (n = 9) treated with 2-APB following the protocol illustrated in Fig. 1C. The positioning signal was once again completely abolished after incubation with this antagonist (Fig. 5C panel iii’), and the furrow was once again never positioned at the blastodisc surface.
Figure 5D, E and F show representative embryos incubated with ryanodine (n = 14), verapamil (n = 4) and nifedipine (n = 5), respectively, shortly before the furrow positioning transient, following the protocols illustrated in Fig. 1B. None of these antagonists has an effect on the positioning transient or the positioning of the furrow at the blastodisc surface, and furrows subsequently propagate and deepen normally during the first cell division cycle (see Fig. 5D–F panels iii'–iv’). The results illustrated in Fig. 5 are summarized in Table 1 along with the antagonist concentrations used.
Estimation of the range of elevated Ca2+
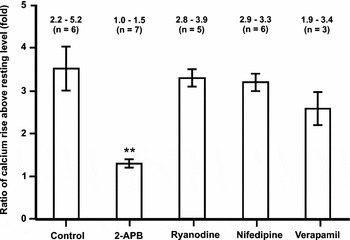
Figure 6 displays the mean-fold Ca2+ rise (±SEM) of the furrow positioning transient above the background resting level, comparing (using the Student t-test) antagonist-treated (for concentrations see Table 1) with control embryos. In the case of the positioning transient, only incubation in medium containing 2-APB resulted in a significantly lower (where p < 0.001) ratio of Ca2+ rise above resting than the control.
The effect of Ca2+ channel antagonists on the ratio of Ca2+ rise above resting level for the positioning transient. The data presented in the histograms are expressed as mean ± SEM, while the numbers above each bar show the range of values calculated and the number of imaging experiments carried out for each antagonist (or control). Student t-tests were performed and show that for the positioning transient, the ratio of Ca2+ rise above resting for the 2-APB-treated embryos (**) was significantly lower than the control at p < 0.001. The concentrations of the channel antagonists used are listed in Table 1.

Discussion
We have previously reported that at least three Ca2+ transients appear to be associated with cytokinesis during the early cell division cycles of zebrafish embryos. We termed these the furrow positioning, propagation, and deepening/zipping transients (Webb et al., Reference Webb, Lee, Karplus and Miller1997). We subsequently demonstrated that Ca2+ released via IP3Rs was responsible for generating both the furrow propagation and deepening/zipping transients and that these transients were an absolute requirement in the cytokinetic process (Lee et al., Reference Lee, Webb and Miller2003). It was not clear, however, whether what we had termed the furrow positioning transient (i.e. the initial localized rise in cortical Ca2+) was an essential and distinct signal with a specific function, or was just the initial phase of a localized Ca2+ transient that eventually developed into the furrow propagation transient.
Our new data suggest that although the furrow positioning and propagation transients are not separated by a distinct return towards resting levels of [Ca2+]i in the blastodisc cortex (as is the case between the propagation and deepening/zipping transients; see Webb et al., Reference Webb, Lee, Karplus and Miller1997) the initial rising phase of this localized cortical [Ca2+]i increase has unique characteristics and thus may be regarded as a distinct signal. The propagation transient does develop from the positioning transient, but it also displays its own distinctive features. This is in spite of both transients being generated by the same intracellular Ca2+ release mechanism, i.e. from the ER via IP3Rs.
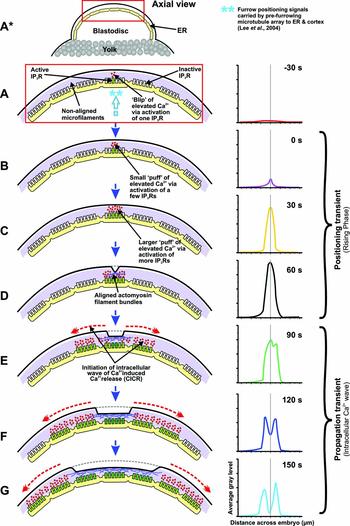
Figure 7 is a schematic representation of what we propose might be the mechanism for generating the initial rising phase of the Ca2+ transient (i.e. the furrow positioning signal), followed by the generation of a pair of self-propagating, linear, subsurface Ca2+ waves (i.e. the furrow propagation signal). We propose that the initial rising phase might start as a form of IP3R-generated Ca2+ blip, and as additional IP3Rs are recruited, this blip develops into a Ca2+ puff (Yao et al., Reference Yao, Choi and Parker1995; Berridge, Reference Berridge1997; Bootman et al., Reference Bootman, Niggli, Berridge and Lipp1997; Berridge et al., Reference Berridge, Lipp and Bootman2000). We suggest that this progressive recruitment of IP3Rs results in the rising phase of the transient and thus defines what we have termed the furrow positioning signal. Once the Ca2+ puff reaches a threshold value (as illustrated in Fig. 2C), it develops into a self-propagating, intracellular Ca2+-induced Ca2+-release wave, and it is at this point that we suggest the furrow positioning signal develops into the furrow propagation signal (as illustrated in Fig. 2D). Although we do not have the sensitivity to distinguish individual blips, we suggest that a blip to puff transition, via the recruitment of additional IP3Rs, is an essential prerequisite to the eventual generation of the furrow propagation waves. The importance of reaching a threshold Ca2+ level in order to propagate a regenerative Ca2+ wave has previously been emphasized by Bootman et al. (Reference Bootman, Niggli, Berridge and Lipp1997).
Hypothetical model showing an axial view of a zebrafish blastodisc to illustrate how Ca2+ released via the activation of IP3Rs might generate the furrow positioning and propagation transients during the first cell division cycle via our proposed blip/puff/wave Ca2+ signalling cascade.

A comparison was made between some of the characteristics of what we term blips and puffs, with those that have been previously described. From the luminescent rise shown in Fig. 2C, the peak Ca2+ rise was estimated to be approximately 5-fold above the resting level (see Materials and Methods). Créton et al. (Reference Créton, Speksnijder and Jaffe1998) have estimated the latter in zebrafish zygotes to be around 60 nM, thus the rising phase furrow positioning transient peaks at around 300 nM prior to the initiation of the subsequent furrow propagation waves. This estimation is comparable to the free Ca2+ peaks reported during IP3-induced Ca2+ puffs in Xenopus oocytes (i.e. 100 to 200 nM; Parker & Yao, Reference Parker and Yao1996) and histamine-induced puffs in HeLa cells (i.e. ∼250 nM; Bootman et al., Reference Bootman, Niggli, Berridge and Lipp1997). An interesting feature of the furrow propagation waves in zebrafish is that the peak Ca2+ level of the propagating wave fronts appears to be less than that of the peak of the rising phase transient (see Fig. 2B), whereas those of the Ca2+ waves in both Xenopus oocytes and HeLa cells are a good deal higher than the peak of their preceding Ca2+ puffs (Parker & Yao, Reference Parker and Yao1996; Bootman et al., Reference Bootman, Niggli, Berridge and Lipp1997). In addition, the dimensions of the initial zone of elevated Ca2+ (as shown in Fig. 2A panel ii) appears to be much larger than the areas of Ca2+ elevation reported from blips in both Xenopus oocytes and HeLa cells (Parker & Yao, Reference Parker and Yao1996; Bootman et al., Reference Bootman, Niggli, Berridge and Lipp1997). This, however, could be due to the fact that aequorin-based imaging might not have the sensitivity and spatial resolution required for the detection of Ca2+ release from a single IP3R. Thus, what we might visualize as the initial positioning transient is likely to be Ca2+ release from a few IP3Rs, i.e. as a small Ca2+ puff, rather than from a single IP3R, i.e. as a Ca2+ blip. The use of fluorescent Ca2+ reporters and higher resolution confocal imaging should help to confirm this suggestion.
We have previously reported that in zebrafish zygotes a pre-furrowing microtubule array, which develops from mid-spindle microtubules, acts to reorganize the corticular ER (along with its resident population of IP3Rs) in a distinctive manner just prior to the appearance of the cleavage furrow at the blastodisc surface (Lee et al., Reference Lee, Ho, Wong, Webb and Miller2004). A significant portion of the ER was seen to be reorganized into linear tracts that precede and predict the position of the subsequent cleavage furrow. In our current hypothesis, we propose that the furrow positioning signal is generated in this reorganized ER at the apex of the blastodisc. When the positioning signal develops into an intracellular Ca2+ wave, it is thus restricted in its pathway of propagation due to the architecture of the reorganized ER. It therefore propagates as linear (as opposed to radial) subsurface Ca2+ waves. We propose that these waves act to induce the formation of the contractile arc along the precise plane determined by the mid-spindle microtubule array via the reorganized ER. In this manner, the contractile arc is correctly positioned in the blastodisc cortex to effectively separate the daughter nuclei into separate blastomeres. It has been suggested that the furrow propagation transients may act to organize the assembly of the growing ends of the actomyosin contractile arc via Ca2+-sensitive elements in the blastodisc cortex such as MLCK (Fluck et al., Reference Fluck, Miller and Jaffe1991; Chang & Meng, Reference Chang and Meng1995; Webb et al., Reference Webb, Lee, Karplus and Miller1997). This idea is supported by reports that activated MLCK can induce the assembly of both non-muscle and smooth muscle myosins into stable filaments, which in turn can organize actin into actomyosin complexes (Mabuchi, Reference Mabuchi1986; Mabuchi & Takano-Ohmuro, Reference Mabuchi and Takano-Ohmuro1990).
A key question yet to be addressed is what might induce the initial IP3R-generated blip that sets the proposed blip/puff/wave Ca2+ signalling cascade in motion. The fact that the IP3R antagonist 2-APB blocks the generation of the initial signal (see Fig. 5B), supports the suggestion that it is indeed generated by one or a few IP3Rs. It has also previously been suggested that microtubules and the ER are highly interdependent and interactive structures (Terasaki et al., Reference Terasaki, Chen and Fujiwara1986). Furthermore, microtubules have been implicated in the process of Ca2+ release from the ER (Tasaka et al., Reference Tasaka, Mio, Fujisawa and Aoki1991). We suggest, therefore, that perhaps an interaction between the expanding pre-furrowing microtubule array and the reorganizing ER at the apex of the blastodisc results in the initial stimulation of a localized Ca2+ release via one or a few IP3Rs, and that this leads to the further recruitment of activated IP3Rs leading to the proposed Ca2+ signalling cascade.
It has also been reported that microtubules may directly dictate the distribution of actin filaments as well as the positioning of the cleavage furrow in grasshopper spermatocytes (Alsop & Zhang, Reference Alsop and Zhang2004). We suggest, therefore, a dual role for the pre-furrowing microtubule array during cytokinesis in zebrafish zygotes. Firstly, it could serve to directly recruit and organize actin filaments in the blastodisc cortex along an arc where the furrow will subsequently form. Secondly, it could reorganize and stimulate the ER to release Ca2+ to promote, via MLCK and myosin filament stabilization, the formation of the actomyosin band. The positioning transient could thus serve to initiate this process at the blastodisc apex by establishing a contractile band nucleation arc. As the propagation transients then spread out towards the edges of the blastodisc along their predetermined tracks, the actomyosin arc likewise extends towards the blastodisc edges.
Our new data have shown an absolute requirement for the initial rising phase of the Ca2+ transient in positioning the cleavage furrow at the blastodisc surface. Furthermore, our blip/puff/wave signalling cascade hypothesis (based on components of the Ca2+ signalling toolkit proposed by Berridge et al., Reference Berridge, Bootman and Roderick2003) suggests a mechanism that might explain the essential nature of the rising phase of the positioning signal in generating subsequent intracellular Ca2+ waves. The fact that the latter are closely associated with the extension of the contractile arc across the blastodisc surface, while the rising phase of the positioning signal appears before there is any sign of the cleavage furrow at the surface, also suggests that the positioning signal might be considered to be a distinct signal in its own right.
Acknowledgements
We thank Drs O. Shimomura, Y. Kishi and S. Inouye for supplying us with the f- and h-aequorins. Some of the zebrafish used were supplied by the Zebrafish International Resource Center, supported by grant #RR12546 from the NIH-NCRR. This work was supported by RGC-CERG grants HKUST 6214/02M, HKUST 6279/03M and HKUST 6241/04M awarded to A.L.M. and S.E.W. This work was carried out while A.L.M. was the recipient of a Croucher Senior Research Fellowship.