


Introduction
News and social media data accurately measure protest size variation, according to estimates of protest size obtained via cellphone location data from 10 million individuals.
Protests are a key tool in the repertoire of social movements (Tilly and Tarrow Reference Tilly and Tarrow2015), and observational (Fassiotto and Soule Reference Fassiotto and Soule2017; Uba Reference Uba2005; Walgrave and Vliegenthart Reference Walgrave and Vliegenthart2012) as well as experimental (Wouters and Walgrave Reference Wouters and Walgrave2017) studies find that those with more participants are more likely to generate policy change. Methods to directly measure size are too costly to be employed across large numbers of protests, limiting their use in academic studies (McPhail and McCarthy Reference McPhail and McCarthy2004; Schweingruber and McPhail Reference Schweingruber and McPhail1999; Yip et al. Reference Yip, Watson, Chan, Lau, Chen, Xu, Xi, Cheung, Ip and Liu2010). Instead, event datasets that record size (usually of protests but also of riots or massacres) rely on numbers provided in media reports, usually newspapers (Earl et al. Reference Earl, Martin, McCarthy and Soule2004). This reliance raises concerns about the accuracy of the tallies because researchers do not create the measures themselves; those who do—usually organizers or authority figures—have incentives to misrepresent protest size,Footnote 1 and estimates are often provided as vague phrases (“hundreds” or “dozens”) whose translation into numbers is open to researcher interpretation (Raleigh et al. Reference Raleigh, Linke, Hegre and Karlsen2010). Newspapers can also choose between multiple estimates to find the one that suits their editorial beliefs (Barranco and Wisler Reference Barranco and Wisler1999; Mann Reference Mann1974). Concern about measurement validity means many event datasets record size as an ordinal variable (Salehyan et al. Reference Salehyan, Hendrix, Hammer, Case, Linebarger, Stull and Williams2012), average across reports (Weidmann and Rod Reference Weidmann and Rød2018), or focus on measuring fatalities (Raleigh et al. Reference Raleigh, Linke, Hegre and Karlsen2010).
Using individuals’ locations recorded via their cellphones (“cellphone data”), we show that scholars can rely on size estimates reported in newspapers or obtained via geolocated tweets. Since people almost always carry their cellphone, those devices record individuals’ locations passively, and other researchers have verified that the locations are not biased politically (Chen and Rohla Reference Chen and Rohla2018), we consider the cellphone location to be the most accurate estimate currently available.Footnote 2 Cellphone data are especially important because, since 1995, the federal government no longer records protest size in Washington DC (McCarthy et al. Reference McCarthy, McPhail, Smith, Crishock, Rucht, Koopmans and Neidhardt1999), rigorously measuring with enumerators is too costly when protests occur in multiple locations (Schweingruber and McPhail Reference Schweingruber and McPhail1999; Yip et al. Reference Yip, Watson, Chan, Lau, Chen, Xu, Xi, Cheung, Ip and Liu2010), and, even if possible across locations, is likely to feature response bias (Walgrave and Verhulst Reference Walgrave and Verhulst2011; Walgrave, Wouters, and Ketelaars Reference Walgrave, Wouters and Ketelaars2016). Therefore, the cellphone data forms the baseline against which we compare estimates from news (print and television) and social media (text and images). Since the cellphone data are a sample, protests’ true size is still unknown; the analysis presented below therefore compares protest size variation recorded in different datasets, and does not definitely establish protest size.
Estimates using the January 21, 2017, United States Women’s March substantiate this argument. One of the largest mobilizations in American history, that day featured 942 protests comprised of approximately 4.77 million individuals (Beyerlein, Ryan, et al. Reference Beyerlein, Barwis, Crubaugh and Carnesecca2018; Chenoweth and Pressman Reference Chenoweth and Pressman2017). The cellphone data shows that variations in protest size reported in newspapers as well as estimated via geolocated tweets are accurate. Of the four sets of estimates we compare, those reported in newspapers or calculated via geolocated tweets containing protest key words are the most accurate, followed by counting the number of faces in protest photos shared on Twitter. Counting the number of accounts that share protest photos is the least accurate. The supplementary materials show that the first principal component of the four sets of estimates recovers the most accurate protest size variation, though this fifth estimate is the most difficult to scale and so not one we recommend for future use.
The Challenge
A long line of research finds that large protests (those with many participants) are more likely than small ones to elicit policy responses across issues and regimes. During the Vietnam War in the United States, Congresspeople were more likely to engage in roll-call votes in response to protests with more than 10,000 participants (McAdam and Su Reference McAdam and Su2002). This responsiveness exists across branches of the government (Walgrave and Vliegenthart Reference Walgrave and Vliegenthart2012) and in non-Western contexts (Lohmann Reference Lohmann1994; Uba Reference Uba2005). Large protests are especially powerful in authoritarian settings because they decrease the legitimacy of the rulers while increasing the cost of repression (Stephan and Chenoweth Reference Stephan and Chenoweth2008). Experimental work that manipulates the reported size of a protest also finds that protest size affects policy decisions (Wouters and Walgrave Reference Wouters and Walgrave2017). Amenta et al. (Reference Amenta, Caren, Chiarello and Su2010) provide a more detailed overview of how social movements affect policy outcomes.
Previous estimates of protest size rely on teams of well-trained observers, surveys of participants, or size estimates reported in newspapers. Using observers who understand the square footage of a protest site, the density of the crowd, and the percentage of the site the crowd occupies is considered the most accurate estimation method; on average, a standing person requires about five square feet of personal space (McPhail and McCarthy Reference McPhail and McCarthy2004). New technology, such as unmanned aerial vehicles (Choi-Fitzpatrick, Juskauskas, and Sabur Reference Choi-Fitzpatrick, Juskauskas and Sabur2018) and high-resolution satellite imagery, may allow this methodology to scale across simultaneous events. Trained observers can also disperse within a protest and count the size of clusters of participants (Schweingruber and McPhail Reference Schweingruber and McPhail1999; Yip et al. Reference Yip, Watson, Chan, Lau, Chen, Xu, Xi, Cheung, Ip and Liu2010). Surveying protesters, during or after an event, can also generate size estimates (Beyerlein, Barwis, et al. Reference Beyerlein, Barwis, Crubaugh and Carnesecca2018; Opp and Gern Reference Opp and Gern1993; Walgrave and Wouters Reference Walgrave and Wouters2014; Walgrave, Wouters, and Ketelaars Reference Walgrave, Wouters and Ketelaars2016).
Scholars most often rely on estimates of protest size in newspapers (Earl et al. Reference Earl, Martin, McCarthy and Soule2004; Woolley Reference Woolley2000). Though newspapers have known biases in their coverage (Baum and Zhukov Reference Baum and Zhukov2015; Gerner and Schrodt Reference Gerner, Schrodt, Schmeidl and Adelman1998; Myers and Caniglia Reference Myers and Caniglia2004), the concern about measurement validity for protest size does not stem from their preference towards violent events in urbanized areas. The concerns are two. First, newspaper estimates of protest size are secondary, usually coming directly from protest organizers or state authorities (Wouters and Camp Reference Wouters and Camp2017). The estimates could be too high or too low, but the bias would not be correctable since no independent size estimate exists. Second, newspapers prefer to report on large protests, generating inaccurate records of protest events (McCarthy, McPhail, and Smith Reference McCarthy, McPhail and Smith1996; McCarthy et al. Reference McCarthy, McPhail, Smith, Crishock, Rucht, Koopmans and Neidhardt1999). See Section S1 of the Online Appendix for how other datasets report protest size.
Data
That news and geolocated social media can accurately measure protest size variation is demonstrated using the 2017 United States’ Women’s March. Occurring on January 21, 2017, the simultaneous protests across the country constitute the largest single-day mobilization in the United States.Footnote 3
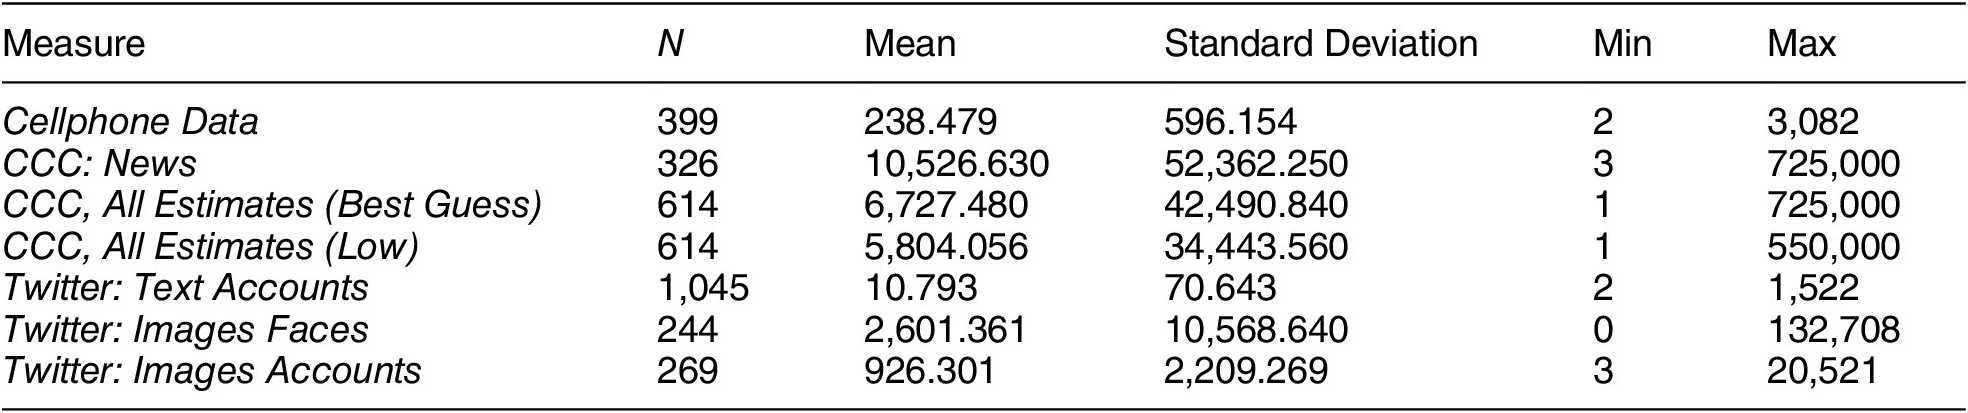
This letter compares seven estimates of protest size from three sources: cellphone location data (Chen and Rohla Reference Chen and Rohla2018), the Crowd Counting Consortium (Chenoweth and Pressman Reference Chenoweth and Pressman2017), and Twitter. The cellphone data are from a data broker and shared with an author of this paper. The Crowd Counting Consortium (CCC) data are publicly available, and the tweets have been collected by another author of this paper (Steinert-Threlkeld Reference Steinert-Threlkeld2018).Footnote 4Table 1 provides summary statistics of the three sources, and they are available at Sobolev et al. (Reference Sobolev, Chen, Joo and Steinert-Threlkeld2020).Footnote 5
Summary Statistics

Note: CCC refers to the Crowd Counting Consortium data and uses the “Best Guess” variable unless otherwise indicated. Twitter: Text Accounts uses keywords to identify protesters. Twitter: Images Faces sums the number of faces in protest images. Twitter: Images Accounts counts the number of unique accounts that share protest photos.
The cellphone estimates use data provided from SafeGraph. Cellphones record owners’ location and let downloaded applications use that information to provide, ostensibly, services. The applications and telecommunications providers then sell the location data to brokers or directly to companies (Cox Reference Cox2019; Valentino-DeVries et al. Reference Valentino-DeVries, Singer, Keller and Krolik2018). The dataset contains location information for just more than 10 million individuals. We have no identifying information on these individuals (de Montjoye et al. Reference de Montjoye, Gambs, Blondel, Canright, De Cordes, Deletaille and Engø-Monsen2018). Section S2 uses actual and imputed vote share by county in Texas to validate the political representativeness of the cellphone data.
Identifying protesters from the SafeGraph data requires several steps. First, we only search in cities identified in the CCC data. Second, in those cities, we only consider pedestrians by excluding pings that were registered while the owners of mobile phones used private or public transportation; mode of transit is identifiable by the frequency of location pings.Footnote 6 Third, we deduplicate individuals by averaging their location within a 30-minute window, assigning that location as the individual’s location, and keeping only their first appearance.Footnote 7 On average, our data has approximately three pings from every cellphone every thirty minutes. Fourth, we take the size distribution of seven-digit geohashes on January 21, 2017, the day of the Women’s March, and keep the geohashes above the 99th percentile per city.Footnote 8, Footnote 9 Figure A2 illustrates how geohashes identify locations, and Figures A11–A19 compare these geohashes with actual protest geohashes to demonstrate that this approach recovers locations where protests occur. Fifth, any individual in those geohashes is counted as a protester. The size of this group represents a conservative estimate of the total size of the protest in each city.Footnote 10
To summarize, the number of people in a city’s seven-digit geohashes whose density is in the 99th percentile or greater is the number of protesters to which we compare the other estimates.Footnote 11
The CCC is an open-source, hand-coded event dataset established to record reports of protest size. The CCC dataset is agnostic regarding source type. Most are newspapers or local television broadcasts, but a substantial minority (26.84%) of the estimates derive from tweets or Facebook statuses. It also reports high and low estimates, based on these sources. Unless otherwise indicated, we use the Best Guess variable, usually an average of the adjusted low and high estimates in an article, as the protest size estimate. The term CCC: News refers to events for which the source is a newspaper or local television broadcast. The term CCC, All Estimates includes events for which only social media provides estimates,Footnote 12 and CCC, All Estimates (Low) uses the Low estimate, not Best Guess, and ignores source type.Footnote 13
For Twitter, three approaches approximate the number of protesters.Footnote 14 The first counts the number of unique accounts in a city between 10:00 and 17:00 hours local time using one of three common keywords: “womensmarch,” “whyimarch,” or “imarchfor.” Tweets are not resolved to intracity locations for three reasons. First, for the majority of tweets, Twitter aggregates the specific location of a tweet to local polygons while reporting the actual location as the city that contains that polygon. The polygon, however, does not necessarily envelop the location of the actual tweet. For example, Rancho Palos Verdes and Monterrey, two cities near Los Angeles, recorded, based on GPS coordinates, the most number of tweets from January 21, but Twitter labels those tweets as coming from Los Angeles. Intracity location information is therefore unknown for almost all tweets. Second, the Crowd Counting Consortium does not always provide intracity geographic information. A protest it labels as occurring in Seattle would require further research for obtaining the specific location, for example. Third, most cities, even large ones, contain only one protest per day; if they contain multiple events, one protest will contain the vast majority of the protesters (Biggs Reference Biggs2016). We call this measure Twitter: Text Accounts.
The second Twitter approach counts the number of faces in any protest photo from a city. A convolutional neural network first identifies protest photos, and then another convolutional neural network identifies faces in that photo. Faces in a protest photo are summed and added per city-day. We call this measure Twitter: Images Faces. Footnote 15
The third Twitter approach counts the number of people tweeting a protest photo. This approach does not count retweets, so it assumes that any tweet of a protest photo requires that the Twitter user was actually at a protest. We call this measure Twitter: Images Accounts. The Discussion section provides more detail about why these three measures should correlate with the cellphone data estimates. For an explanation of using deep learning and computer vision to extract politically relevant data from images, see Joo and Steinert-Threlkeld (Reference Joo and Steinert-Threlkeld2019) and Steinert-Threlkeld, Chan, and Joo (Reference Steinert-Threlkeld, Chan and Joo2020).
For either image approach to be accurate, we assume that Twitter account owners take photographs of protesters, share them on Twitter during the day of the protest, are not strategic about the timing of the sharing (Pfeffer and Mayer Reference Pfeffer and Mayer2018), and enable geolocation for the tweet. If these assumptions are true, using Twitter is similar to authorities’ estimating procedures (McPhail and McCarthy Reference McPhail and McCarthy2004). While we can think of no reason that accounts would, in aggregate, be biased in sharing protest photos, it is possible these estimates will not be accurate, especially because so many steps are required to enter our data. The results presented in the next section show that, despite the biases that could enter in any of these steps, the Twitter approaches are accurate.
Table 1 shows that size estimates vary substantially across datasets. To compare the estimates, we convert each estimate of size to a per capita measure, log transform that result because it is still very skewed, and take the z-score of the logged per-capita measure (for the remainder of the paper, “z-score” refers to this measure). We prefer per capita to raw estimates because population size will drive the cellphone, CCC, and Twitter estimates. Incorporating it into our measurement therefore removes a possible source of omitted variable bias. The z-score is appropriate because the estimates vary by orders of magnitude across datasets.Footnote 16
Because each source records a different number of protests, Section S8.5 investigates the overlap of the cellphone data and four preferred size estimates in more detail. Manual investigation and Table A20 show no meaningful demographic or socioeconomic difference between the cities in which the measures record protest. Cities that have more people, higher earners, greater income inequality, and more inhabitants with a professional degree are more likely to record protests.
Results
The results indicate that CCC: News and Twitter: Text Accounts estimate protest size variation with the least error. Twitter: Images Faces is next best, while counting the number of accounts that share protest photos is the least accurate. No estimate, however, is inaccurate, and the Discussion section describes when different ones may be preferred.
Unless otherwise stated, all results are for the 155 cities for which each dataset records a protest size. The supplementary materials show results keeping the maximum number of observations each dataset and the cellphone data share do not change.
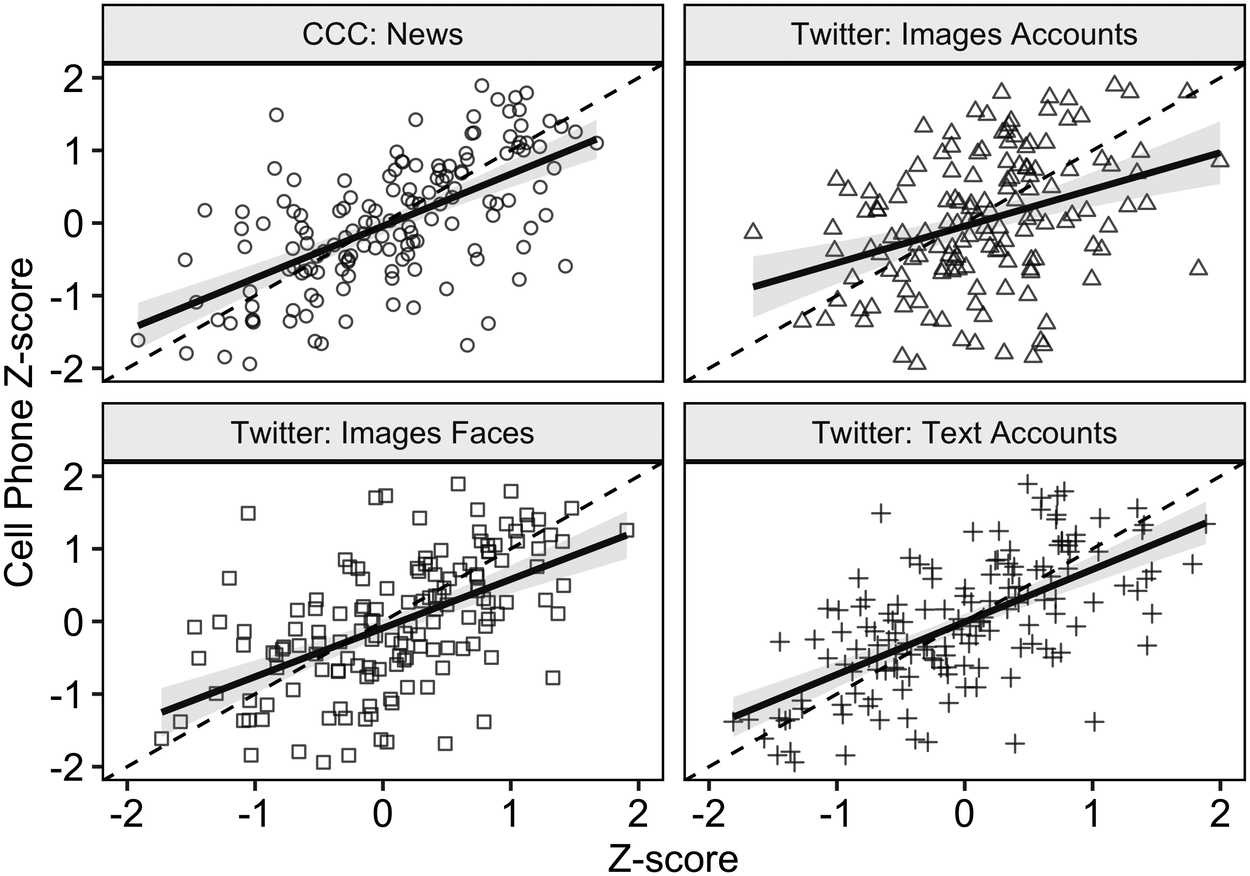
Figure 1 shows the correlation of the z-score for each of the datasets with the cellphone data. Section S7.1 reports these correlations in a table.Footnote 17
Correlation – Estimates

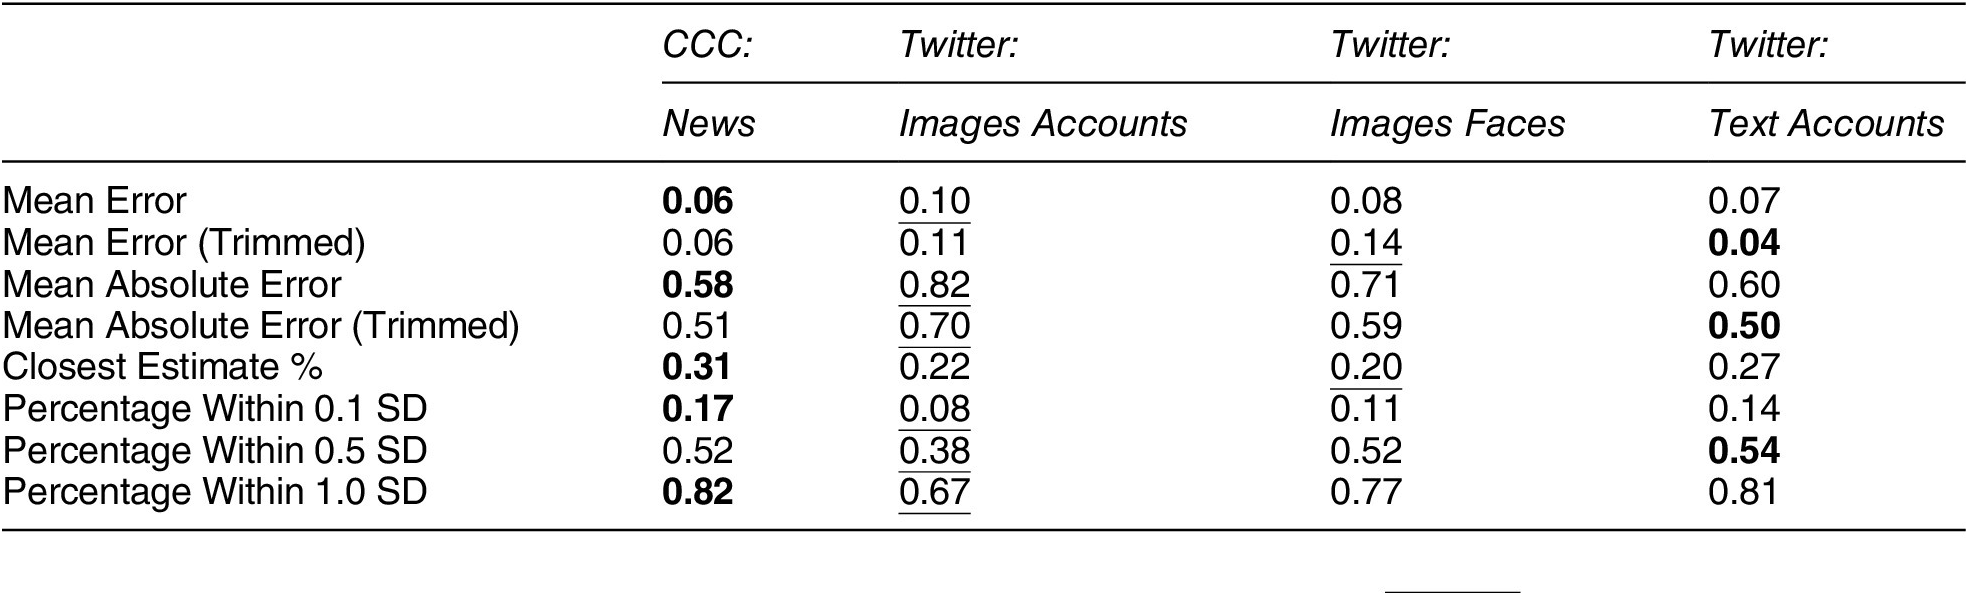
Table 2 shows that CCC: News and Twitter: Text Accounts produce the closest estimates to the cellphone data. Those two measures are also the closest to the cellphone data the greatest percentage of the time, whether measuring difference (rows 1–5) or the number of observations within 0.1, 0.5, and 1.0 standard deviation of the cellphone data (rows 6–8). Twitter: Images Accounts is the least accurate on six of the eight fit measures.
Measuring Fit

Note: “(Trimmed)” datasets drop observations where  . Bold is the best measure per row; underline, the worst.
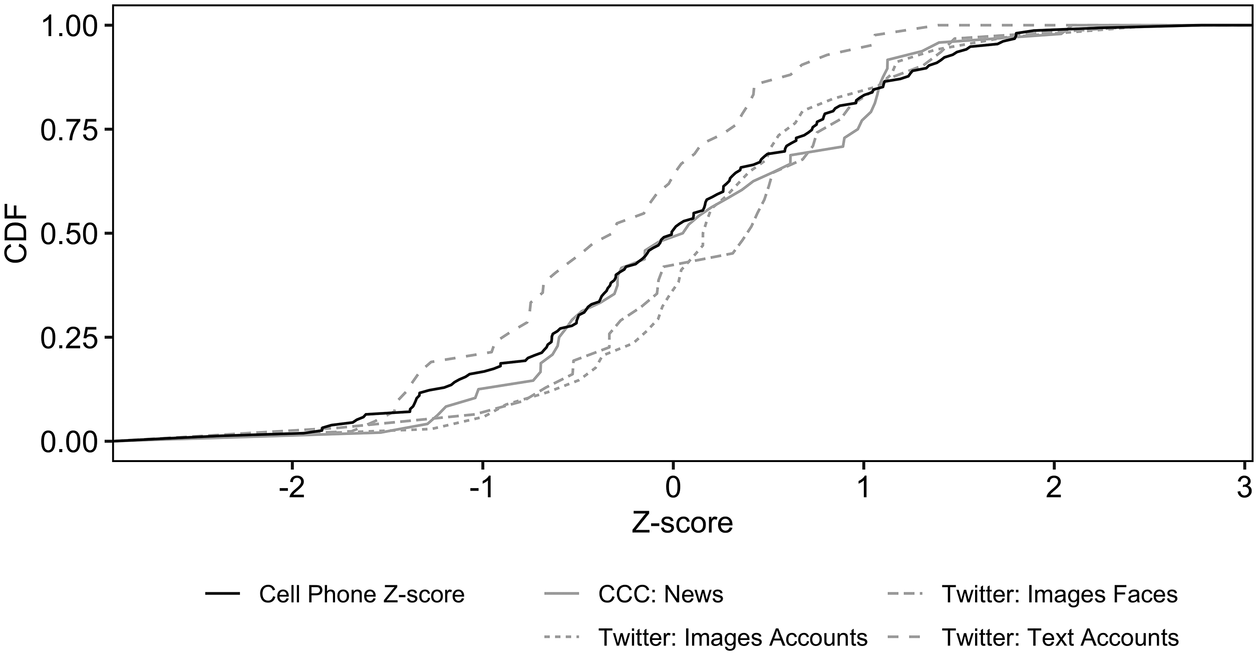
Figures 2 and 3 show the results when each dataset’s measure is close to the cellphone data. Figure 2 shows the cumulative distribution of the four datasets’ closest estimates across the range of z-scores. This graph reveals any bias in each estimate. For example, if most of a dataset’s closest predictions are for small protests, its cumulative distribution function (CDF) will approach 1.0 quickly. If its closest predictions are randomly scattered across the range of protest size, its CDF will track the cellphones’ CDF. Twitter: Text Accounts has more of its closest estimates occur for small protests, which makes sense: because more tweets contain protest hashtags than protest images, it records small protests better than image estimates. Twitter: Images Accounts tracks the cellphone data as protests pass their average size. Twitter: Images Faces outperforms Twitter: Images Accounts for most of its range except  . CCC is the most consistently accurate of the three, as its CDF closely tracks the cellphone data estimates.
Location of Best Fits per Measure

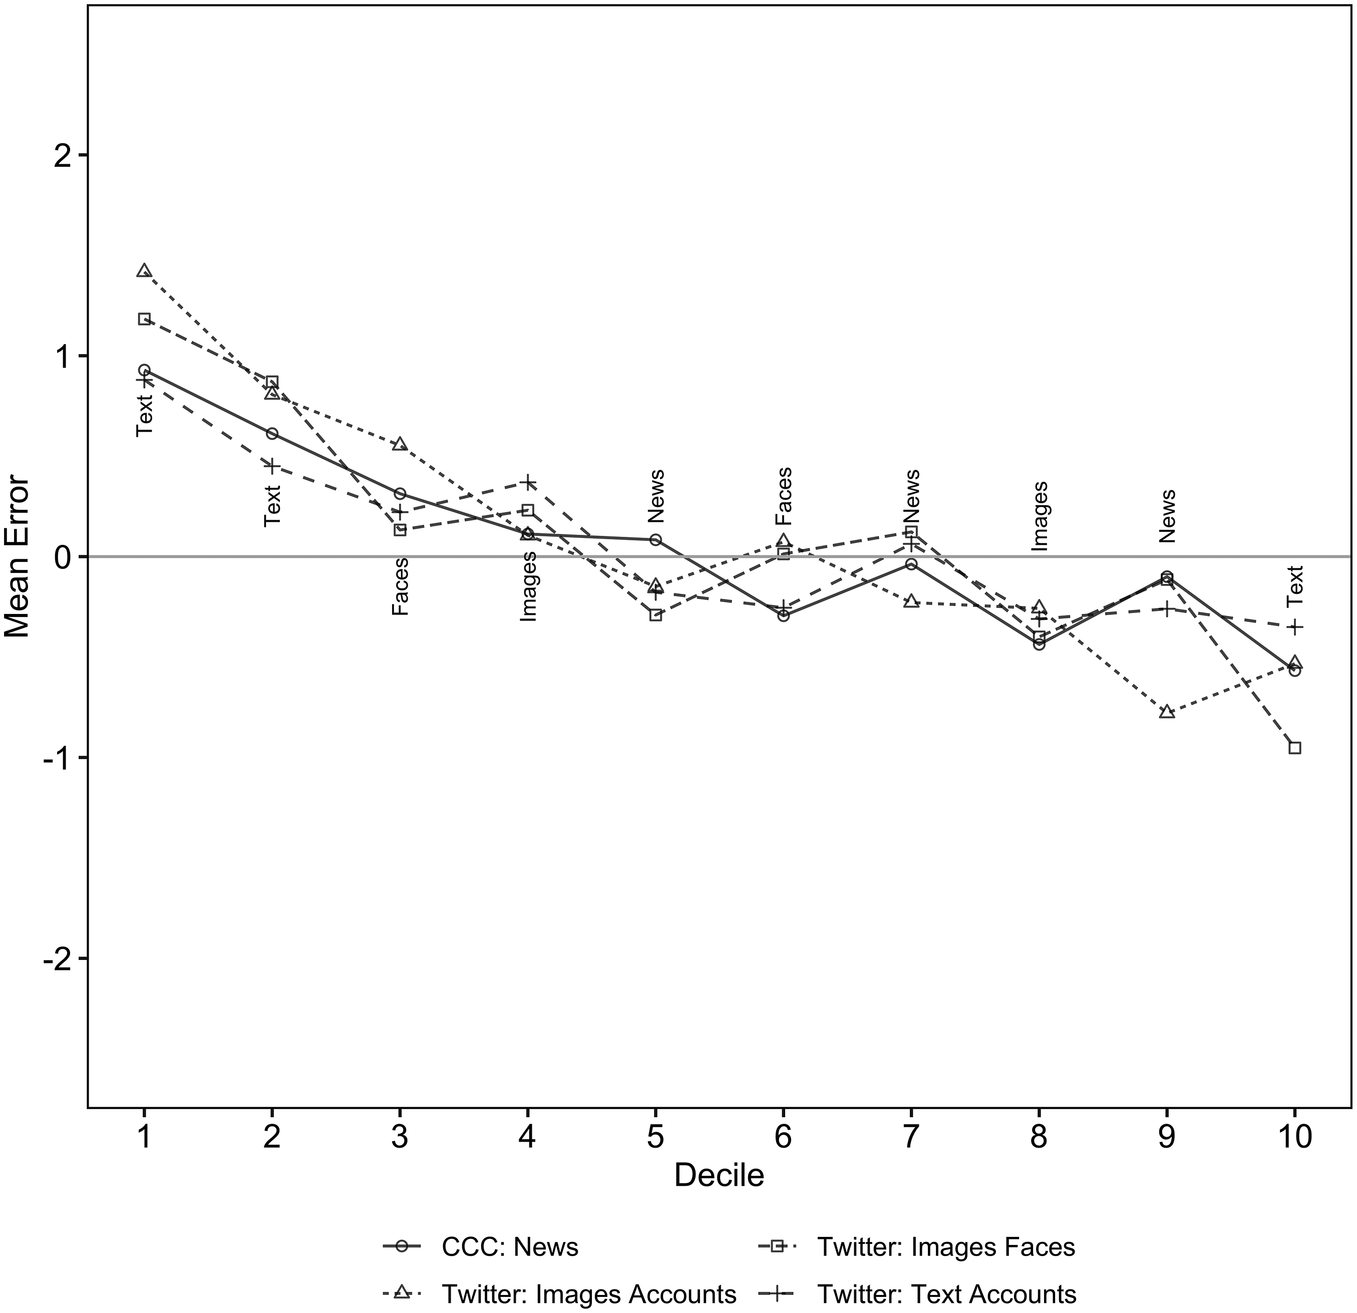
Finally, Figure 3 shows the mean error by z-score decile, with the closest estimate per decile labeled. All measures overestimate the size of small protests and underestimate large ones. CCC: News and Twitter: Text Accounts perform best, as they each have the smallest mean error three times. Twitter: Images Faces is closest twice; Twitter: Images Accounts, once.
Mean Error by Decile

The supplementary materials present additional analyses confirming these results. To verify that results are not driven by the per capita transformation, we show results measuring the outcome as the z-score of the logarithm of protest size; the subsections presenting them are labeled “Not Per Capita.” We also generate protest size estimates using the first principal component of all four measures as well as the two Twitter images measures. Section S4 explains this analysis, and its results are presented in other sections of the Supplementary Materials. The first principal component usually generates the least error.
After introducing the principal components analysis, subsequent sections replicate the results above. Section S5 repeats Table 2 using all observations per measure and the “Not Per Capita” measure. Section S6 replicates Figure 3 using all observations per measure and the “Not Per Capita” measure. Both incorporate the principal components results and show results when using the maximum number of observations per dataset.
Sections S7 and S8 provide two sets of additional results. Section S7 shows the Pearson correlation coefficient for each measure, using different subsets of data and operationalizations of protest size. Section S8 introduces a series of models regressing the cellphone data on the four measures, separately and pooled; all models include state fixed effects, socioeconomic controls at the urbanized area level taken from the 2016 American Community Survey, and population. Each table includes a placebo model using only ACS data. CCC: News and Twitter: Text Accounts feature the highest correlations and best model fit regardless of the subset of data or operationalization of protest size. Wealthier, more Democratic, and more populous areas generated larger protests, matching others’ results (McKane and McCammon Reference McKane and McCammon2018).
Discussion
Why Does It Work?
News reports rely on others’ estimates, and the social media estimates are from models applied to relatively small samples with many entry points for bias. That both sets of estimates work may therefore surprise.
The estimates in CCC: News correlate well with the cellphone data for two reasons. First, they tend to come from actors applying methodology similar to that developed in Schweingruber and McPhail (Reference Schweingruber and McPhail1999). While we can find no reports of how activists generate their estimates, state authorities approximate crowd attendance by estimating the carrying capacity of public areas and the percentage of that area covered with people (McPhail and McCarthy Reference McPhail and McCarthy2004). The estimates in newspapers therefore are not as haphazard as their lack of methodological reporting would suggest. Second, CCC generates its data by accepting submissions of protest reports instead of managing a team of researchers; adopting this open-source approach means it includes a broader range of sources than most event datasets (Herkenrath and Knoll Reference Herkenrath and Knoll2011; Nam Reference Nam2006).
The data generating process for Twitter: Images Faces is similar. The protest photos primarily consist of people documenting their immediate surrounding. They contain anywhere from 1 to 48 faces, with an average of 2.81 per photo. So long as people who geotag their photos are randomly distributed across a protest site, then Twitter: Images Faces is similar to randomly sampling segments of a protest site (McPhail and McCarthy Reference McPhail and McCarthy2004). See Steinert-Threlkeld, Chan, and Joo (Reference Steinert-Threlkeld, Chan and Joo2020) for verification of this approach in Hong Kong, South Korea, Spain, and Venezuela.
Which Dataset Should I Prefer?
We are agnostic about whether or not researchers should prefer news or social media data, as there are advantages and disadvantages to relying on either. Broadly speaking, Twitter requires a greater fixed cost but has lower marginal cost than using newspapers. Newspapers are easier to access than social media, so projects using them can start more quickly. If a project includes local newspapers, they may also provide more geographic coverage than Twitter. One disadvantage is that they are still secondary sources of information, whereas tweets, properly collected, provide primary evidence. A project using newspapers to measure protests also requires more ongoing personnel engagement than one using Twitter.
Though acquiring and processing Twitter data is more technically challenging than doing the same for news articles, it has some advantages over them. Protest images, because they are primary source material, may be closer to the cellphone data in their data generating process than news are. Using the keyword approach to estimate protest size is much less difficult than using images and equally accurate, so estimating protest size variation once a data pipeline is established is relatively easy.
One advantage to using images on Twitter versus tweet text is that text requires subject matter expertise on keywords per protest event, whereas visuals are closer to a universal language (Barry Reference Barry1997; Graber Reference Graber1996). Measuring size with text therefore requires more ongoing involvement than image-based estimates. Images, however, are available in fewer circumstances than text (Hawelka et al. Reference Hawelka, Sitko, Beinat, Sobolevsky, Kazakopoulos and Ratti2014).
How Broadly Applicable Are These Results?
Since this paper’s validation has only been tested on one event, the scope to which it holds remains to be tested. The results probably hold in other wealthy democracies, though for now that claim remains an assumption. Steinert-Threlkeld, Chan, and Joo (Reference Steinert-Threlkeld, Chan and Joo2020), for example, show that Twitter: Images Faces and newspaper estimates correlate with each other in four countries about 70% as well as in this paper (see Table A9), though that paper does not have cellphone data with which to verify those estimates. This approach should work in countries where domestic newspapers are not reliable sources, as event datasets rely on foreign newspapers and wire services for size estimates (Clark and Regan Reference Clark and Regan2018; Raleigh et al. Reference Raleigh, Linke, Hegre and Karlsen2010; Weidmann and Rod Reference Weidmann and Rød2018). Twitter penetration correlates strongly with a country’s per capita income, so this methodology may also work in wealthy non-democracies (Hawelka et al. Reference Hawelka, Sitko, Beinat, Sobolevsky, Kazakopoulos and Ratti2014). This work cannot test the international robustness of this finding because CCC only focuses on the United States, there is no other dataset of contemporaneous protest size, and we could not obtain cellphone location data in other locations.
Though cellphone location data are probably the best source for capturing variation in protest size, researchers still must rely on media reports or social media because of the difficulty of acquiring them. Orange, the French telecommunications company, made call detail record data available via its Data for Development program in 2012 and 2014 for the Ivory Coast and Senegal, respectively, but those data were not public, and the competition is no longer held. Data brokers such as SafeGraph and Cuebiq work with academics on a case-by-case basis. Otherwise, cellphone data are available based on idiosyncratic partnerships between researchers and private companies.
Concluding Thoughts
These results suggest that news sources provide accurate estimates of protest size variation, as do social media text or images of protesters (Botta, Moat, and Preis Reference Botta, Moat and Preis2015). Transforming, and not reporting, raw data throws away information future researchers may find useful. Event datasets that report size should therefore report raw estimates recorded in news. Researchers using those data can then decide whether or not to transform them.
The concern that news and social media estimates of protest size cannot be trusted should be laid to rest. Though others have reported protest size using cellphone records, we are the first, as far as we are aware, to use location data from them as opposed to call detail records collected by transmission towers (Shalev and Rotman Reference Shalev and Rotman2020; Traag, Quax, and Sloot Reference Traag, Quax and Sloot2017) and to verify secondary datasets. Whether a researcher prefers news or social media to measure protest size variation is his or her choice, as they are equally accurate. So long as one believes that estimates of protest size variation from cellphone location data are accurate, then estimates of protest size variation from news and social media are trustworthy.
Supplementary Materials
To view supplementary material for this article, please visit http://dx.doi.org/10.1017/S0003055420000295.
Replication materials can be found on Dataverse at: https://doi.org/10.7910/DVN/TRLSJA




Comments
No Comments have been published for this article.