Introduction
The emperor penguin, Aptenodytes forsteri Gray, colony near Coulman Island was discovered by US Navy helicopter pilot, Ensign Thomas Howarth, while flying a reconnaissance mission on 2 December 1958. The following day it was surveyed from the air and on the fast ice by John Dearborn and Hugh DeWitt (unpublished notes of Dearborn 1958). They roughly estimated that there were nearly 35 000 chicks present. Subsequently, in 1964 it was estimated to have about 21 000 chicks (Cranfield Reference Cranfield1966). It was known as the world's largest among the other 45 colonies discovered over the subsequent 50+ years. The third, and first accurate count in 1983 confirmed that it was the largest emperor penguin colony, closely followed by the Cape Washington colony (Kooyman & Mullins Reference Kooyman and Mullins1990, Kooyman Reference Kooyman1993, Reference Kooyman1994). The ensuing 11 censuses show that it was usually the largest known colony until 2010. With the sharp decline of more than 50% of the chick production and adult presence between 2008 and 2010, the top position of this once flagship colony has been ceded to the nearby colony at Cape Washington, which was nearly twice as large (Kooyman & Ponganis, unpublished data).
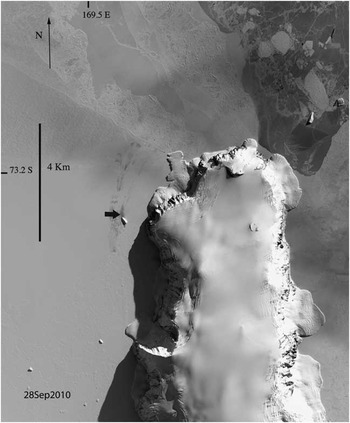
Like most colonies, including Cape Washington, Coulman Island is established on annual sea ice (Fig. 1). Birds are dependent on the integrity of the fast ice for nine months of the year. Reproduction for that year will fail, if the ice does not form early enough to provide a stable platform for the adults arriving in mid-autumn, or if it breaks up too early in late spring before the parents’ single chick has fledged. Accurate censuses for most emperor penguin colonies of the Antarctic did not begin until the 1980s or later. One exception is the Pointe Géologie colony from which counts have been recorded since 1952. Such long-term data on abundance of higher vertebrates are rare and important for assessing trends in population size (Barbraud & Weimerskirch Reference Barbraud and Weimerskirch2001). This small colony of about 3000 breeding pairs has been stable since the 1980s. Indeed in the last few years it seems to be increasing (Barbraud et al. Reference Barbraud, Gavrilo, Mizin and Weimerskirch2011).
Digitalglobe satellite image of Coulman Island on 28 September 2010 (Image copyright: DigitalGlobe, Inc. Image provided by National Geospatial Intelligence Agency (NGA) Commercial Imagery Program). This shows the entire colony, and how it has broken into suburbs, and most suburb movement is indicated by the dark streaks pointing toward the northern ice-edge. The location of the colony is about 169.639°E, 73.336°S, and the heavy black horizontal area indicates the approximate breeding site.

Materials and methods
Our survey methods are reported in Barber-Meyer et al. (Reference Barber-Meyer, Kooyman and Ponganis2008). These methods have steadily evolved since 1983, when the first aerial images were obtained for all of the western Ross Sea colonies. The originals are archived at the United States Geological Survey headquarters in Reston, VA. All other aerial photographs are archived in the Scripps Institution of Oceanography archival collections for GLK. In brief, we conducted ground counts in the last week or two of November, in 1990, 1992, 1993, 1994 and 1996. Missed years of the 1990s were a result of foul weather during the time of aircraft availability or breaks in our research programme. Whenever possible an elevated observation point was used for the count (see Kooyman & Mullins Reference Kooyman and Mullins1990, Barber-Meyer et al. Reference Barber-Meyer, Kooyman and Ponganis2008 for census details).
From 2005 onwards, digital aerial photographs were taken and both chick and adult counts were derived from the multiple images required to cover the entire colony, which was spread over an area about 5 km long and 2 km wide. When the surveys were completed from late October to early December, the colony had separated from the original single cluster (incubation site), verified as a single cluster by a 10 August 1994 aerial photograph (Kristin Larson, personal communication 1994), to 10 to 30 suburbs.
The photographic equipment used from 2005–08 was a Canon EOS 10D, 100–400 mm IS f4.5-5.6 zoom lens, through an open window from the aircraft at an altitude of 460 m. In 2010 a Canon Rebel T2I with the same lens was used, and in 2011 a Nikon D300 with a Nikon 80–400 mm f4.5-5.6D VR, was used. Also, the images from 2010–11 were obtained through a window rather than an open port.
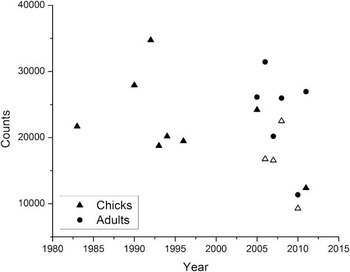
The analytical program used for the counts was Adobe Photoshop CS2 and CS5. Images were enhanced to define the birds by adjusting the exposure and colour. Each adult and chick within the suburbs and nearby were assigned a point. Photoshop assigns a number to each point, and at the end, the sum was used for the total of the suburbs. Up to 2005, all chicks were counted between 6 and 26 November. In subsequent years, both chicks and adults were counted except in 2006–10. In those years, when all adults were counted but when image quality for all suburbs was not adequate, only a sample of four suburbs, representing about 15% of the colony, were counted for chicks. From the adult and chick count in these four suburbs, the ratio of chicks to adults was determined and used for calculating the total number of chicks. These adult and chick counts and estimates were used for the scatter plot of Fig. 2.
Coulman Island colony population values from chicks (triangles) present in the colony from 1983–2011 and adults (circles) from 2005–11. Note that chick counts from 2006–10 are based on adult counts and determination of the chick numbers are from a ratio of chicks to adults from four suburb counts of both chicks and adults. These estimates are indicated by the open triangles. The estimated chick population for the years 2006–10 used a chick to adult ratio of 0.53, 0.82, 0.87 and 0.82, respectively. In 2011 all chicks were counted and the ratio was 0.46.

We use descriptive statistics to establish confidence intervals for the aerial counts of adults and chicks. Our procedure was to count four aerial photographs of individual suburbs from 2010 when the images compared to other years were of the lowest quality. We did this three times with different persons counting for each suburb, and determined the Pearson product moment coefficient r analysis by Statistix 12.
Results
The first “accurate” count from aerial photographs, on 7 November 1983, was 21 708 chicks. Since then until 2010, the colony has ranged from a 1992 high of 34 735 chicks to a low of 16 566 chicks in 2007. The latter was determined from the ratio of chicks to adults after counting all adults. The all time low in 2010 (Fig. 2) was a sharp decline from 22 511 in 2008 to 9305 chicks in 2010.
We did multiple counts of chicks and adults in the four different suburbs for the 2010 sample year. Using three different counters, two inexperienced until this survey, we obtained an average Pearson's r = 0.997, df = 3, and coefficient of variation (CV) = 0.03 for adults. The four suburbs on average ranged from 85.7–677.7 adults. The chick counts ranged from an average of 123–364 with an average Pearson's r = 0.997, df = 3, and CV = 0.19. The experienced counter had consistently higher counts than the two inexperienced counters who have never visited an emperor penguin colony. The estimates were based on the data of the experienced counter, which result in a higher estimate of chick numbers.
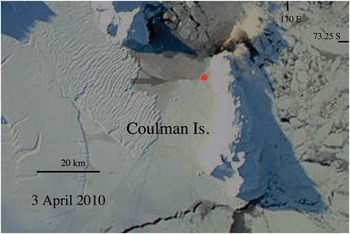
Determination of the ice-edge in early autumn 2010 was made from a MODIS image obtained from the NASA Goddard Space Flight Center, Rapid Response site (Fig. 3). No clear images could be found later in the year than 3 April for Coulman Island. By 15 April the sun sets and no further images are possible from Coulman Island. Photoshop CS5 was used to modify the image. The image was cropped extensively, and contrast was enhanced. By 21 March there was still a large polynya, west to north-west of the putative incubation area. On 3 April the polynya had a thin layer of new ice. On the same date in 2008 there was no polynya, the area was partially obscured by cloud, and the ice appeared older. There are no images for 2011 because the Coulman Island area was cloud covered from 13 March until the sunset on 15 April. On 12 March 2011, there was no ice around Coulman Island.
Coulman Island on 3 April 2010. All of the polynya is covered with a thin layer of new ice, and older but fragile-appearing sea ice (semi-transparent arrow) extends south of the polynya down the western side to the southern tip of the island. The polynya extends completely across the channel from Coulman Island to Cape Jones, a distance of 16 km. The red dot near the north-western edge of the colony is about where the incubation area will form, if ice conditions permit. All distances determined from Google Earth metrics measuring plotter. Photograph courtesy of NASA Goddard Space Flight Center, Rapid Response.

Discussion
In this report we do no annual trend analysis of the chick counts relative to the usual variables that are assumed to have an influence on breeding success. There is no evidence of a trend in the population from 1983–2008 that shows a departure from population stability, although in 2006 and 2007 the chick counts were the lowest observed at just under 17 000 (Fig. 2). However, the colony was back above 20 000 chicks in 2008 when it was 22 511. Then in 2010 there was a step change from the previous count of 2008 to 9305, a 59% drop. The success of the Coulman Island colony is variable (Fig. 2), but the decline in 2010 seems out of the ordinary, both in the relative magnitude of the decrease, and in the exceptionally low absolute number of chicks in that poor reproductive year.
The adult population is also variable, ranging from a high of 31 432 in 2006 to a low of 11 348 in 2010. The range in the ratio of chicks to adults was close to one to one in most years except 2006 and 2010 when it was 0.53 and 0.46, respectively. Overall the adult population was fairly stable for the six years of counts, except 2010. Importantly in 2011 the adult population was back near previous counts.
The step change of 2010 is not unique. In the famous curve derived from the population counts at the Pointe Géologie colony a steep step change of 37% occurred from 1975–77 in breeding adults. The Pointe Géologie colony made a rebound of about 20% in 1978 and then fell back in 1979 to the 1977 levels. Over the next 30 years, it remained at the 1979 level of about 50% or less of the pre-1976 population (Barbraud & Weimerkirsch 2001). Indeed the stability since 1979 seems remarkable. However, the annual population count at Pointe Géologie is a retrospective estimate of adult birds breeding at the colony. Consequently, the counts are not comparable to those for Coulman Island. In the Pointe Géologie programme, all failed eggs, dead chicks and chicks at fledging are added up for a retrospective estimate of the breeding pairs (Barbraud et al. Reference Barbraud, Gavrilo, Mizin and Weimerskirch2011). Our counts of chicks for 1983–96 were three weeks to a month before fledging and are low estimates of breeders because they do not include lost eggs or dead chicks before or after that time. If we were to compare fledged chicks only, then the Pointe Géologie colony would have a higher degree of variability compared to Coulman Island. In some years there was even total loss of chicks (Micol & Jouventin Reference Micol and Jouventin2001).
Unlike the Pointe Géologie study, which has an exceptionally long-term sample, our data do not allow a detailed modelling of the Coulman Island colony's past and future trajectory. However, we present three hypotheses that might be the cause of the recent steep change in the population in 2010 and its modest recovery in 2011. Similar to the Pointe Géologie results, there are assumptions to support the hypotheses, but they provide a guideline to be followed in the search for answers to this puzzling decrease in 2010, which has important ramifications in regard to the health of the Ross Sea.
The hypotheses deal more with the adult behaviour and condition than with the chick variability. We do not address what happened in the colony from the time of egg laying through chick mortality before and after the survey. The hypotheses are: I) many adults skipped a year of breeding, II) there was a mass die off of adults from Coulman Island during the moult cycle, or III) many birds emigrated to other colonies or sites.
Hypothesis I
Many adults simply skipped a breeding season and did not return to the colony in 2010. This is the most optimistic possibility. The reason for not breeding may have been poor sea ice conditions upon their autumn arrival and abandonment of Coulman Island for breeding in that year (Fig. 3). Or, there was poor foraging in the moult area of the eastern Ross Sea and they were not able to make the journey back to the colony in good enough condition to endure the long fast that would ensue after arrival. We have no direct evidence for the reason of poor reproduction in 2010. Evidence for skipping a year is the rebound in 2011 when the number of adults present in early spring was 26 959, near levels before 2010, and 2.4 times the adult count of 11 348 for 2010. Chick production was higher in 2011 than 2010, but at 12 382 chicks, it was still low compared to all other previous years. In 2011, the ratio between adults and chicks was also high compared to previous counts. It was more than two to one rather than about one to one. The recovery assessment is different between the two years of 2010 and 2011 depending up whether the comparison is between chicks or adults. If chicks are considered, then the conclusion is a modest rebound and prospects for the colony are not bright. On the other hand, the adults appear to have rebounded completely and hope for higher chick production in future years is good.
Hypothesis II
If there was a mass die-off of adults, it would be widely dispersed, far from the colony, and the chances of observing any aspect of it would be low. However, indirectly, a large loss of breeding adults would have a lasting impact on the colony. The recovery would result in a long process of recruitment from immature birds that have not begun to breed. The sharp increase in adults in 2011 is evidence that a large mortality event in adults was not the case. Presumably, many of the adults present in 2011 were adults that elected not to breed for unknown reasons.
Hypothesis III
The birds emigrated. Since there were no marked birds at Coulman Island, there is no direct evidence of emigration. Indirectly, a search for a surge in breeding animals at nearby colonies during the same year as the decline, or during the following year would be evidence of birds switching to a new breeding site. At the present time analyses of other Ross Sea colonies are in progress, and until those are complete, it is unknown whether there is supporting evidence for emigration. The return of adults in large numbers to Coulman Island in 2011 suggests that permanent emigration was not the reason for the decline, or that there was a significant level of recruitment from previous year classes of birds that are still not ready to breed.
Satellite imagery
In an earlier report that covered the period from 1983–2005, there was no trend and no significant correlation with potential factors affecting population changes, such as sea ice extent, sea surface temperature, and the southern oscillation index (Barber-Meyer et al. Reference Barber-Meyer, Kooyman and Ponganis2008). We subscribe to the conclusion from this previous paper “…that chick abundance is most impacted by fine scale sea ice extent and local weather events, which are best evaluated by on-site assessments”, but making on-site observations is untenable in most cases. As an example, the sea ice conditions at or near the colony at about the time of arrival of the breeders (Fig. 3) may have significant effects. The image we obtained for 3 April 2010 at about the time the birds would be arriving shows an extensive thin ice region near where the colony becomes established. The ice next to the island appears to be thicker, but possibly vulnerable to winter storms until it thickens more. Such information may be helpful in the future, and should be considered as a resource for determining possible annual variations in size of the colonies. In addition, other important factors include sea ice conditions and prey abundance near the moult area where the birds must fatten before returning to the colony to breed. For the western Ross Sea suitable pack ice or fast ice must occur in the sea near Marie Byrd Land, about 1000 km away from the western Ross Sea colonies, but where most of the birds moult. This area is extremely remote, but may hold keys to breeding success in the western Ross Sea colonies. In the near term this region is unlikely to be surveyed by any means other than satellite imaging.
Conclusions
Most of our evidence for the causes of the sudden collapse of Coulman Island chick production and the low adult presence in early November 2010 is circumstantial. We favour the reason was simply a sabbatical year for most of the adults. A primary cause for the large adult decrease in 2010 could be the possibility that decreased food availability prior to or shortly after the moult limited the option to breed for most of the birds. We have no evidence for this, but acknowledge that new technologies of satellite imagery may give us a clue in the future. The 2011 survey shows that many adults were present in the colony, and may have failed to breed for similar but less intense reasons than in 2010. While there have been dire predictions for colonies north of 70°S latitude (Ainley et al. Reference Ainley, Russell, Jenouvrier, Woehler, Lyver, Fraser and Kooyman2010, Jenouvrier et al. Reference Jenouvrier, Holland, Stroeve, Barbraud, Weimerskirch, Serreze and Caswell2012), those colonies further south are not exposed to the same degree to lack of sea ice for breeding and moulting. In neither case (Pointe Géologie or Coulman Island) is it necessary to conclude that the adults have perished. Of all penguin species emperor penguins are the least bonded to breeding or moulting sites which may be an advantage against future climatic changes and make them more resilient to change whether the climate trend is increased warming or cooling. Not only can they forage at a great range of depth and distance for prey, but they have a wider range of prey species. Compared to other species of penguins, they can also move more easily to other localities for breeding and moulting.
Acknowledgements
We dedicate this report to the memory of John Dearborn (now deceased), who shared his notes and photographs with GLK in 2010 about the discovery and first visit to Coulman Island. Thanks to all of the ground counters: Markus Horning, Carsten Kooyman, Tory Kooyman, and Robert van Dam; to Jerry Mullins for the USGS photos, and Kristin Larson for the early August 1994 aerial photographs; to the New Zealand helicopter pilot Grant White who flew us to Coulman Island in 1990. Thanks also to all the Ken Borek pilots who helped us to and from the colony in 1992, 1993 and 1994. We are grateful for the help from students Carley Senet, Courtney van Gorden, and Alexandra Wright in counting birds from the aerial photographs, and Birgitte McDonald for the figure and statistical analysis. This work was supported by NSF grants OPP 98-14794, OPP02-29638 and OPP 02-24957 to PJP, and DPP 83-16963, DPP86-13729, DPP 87-15863, DPP 87-1584, OPP 92-19872, OPP 96-15390, and OPP 0001450 to GLK and a Tinker Foundation Inc grant for 2006 to GLK. We are grateful to NSF, Raytheon Antarctic Support Services, and Antarctic Support Associates, for all the field support, and Kenn Borek Air for deep field camp air support. Finally, we thank two very conscientious referees who made important suggestions regarding all aspects of the paper.