Introduction
We present four examples of contemporary physical metallurgical design and development. Here, the design process of tailoring the alloy composition and the thermomechanical schedule has necessarily required inputs from measurements of the atomic-scale microstructure, such as are only available by atom probe tomography (APT). The physical metallurgical systems we developed have technologically important physical and mechanical properties—Nd-Fe-B permanent magnets, segregation engineering of steels and nickel-based alloys, advanced high-strength steels (AHSSs), and a model Ni-Al-Cr superalloy, which has excellent high-temperature properties. The instrument used to study these alloys was advanced APT, which is used correlatively with other characterization instruments, for example, transmission electron microscopy (TEM), to understand the nanostructures over a range of length scales. The common thread for the four metallic alloys studied is that their nanostructures determine their physical and mechanical properties over a range of temperatures. APT permits their nanostructures to be determined with subnano- to nanoscale spatial resolution and to identify all of the elements in each alloy studied with equal detection efficiencies. The information garnered via APT cannot be determined by any other characterization instrument.
Grain-boundary chemistry of Nd-Fe-B permanent magnets revealed by APT
Nd-Fe-B-based magnets are the strongest permanent magnets, critical for compact powerful motors and generators, such as voice coil motors for hard disk drives, traction motors, generators for hybrid electric vehicles, and high-efficiency wind turbines. Nd-Fe-B magnets consist of a Nd2Fe14B phase and a small fraction (∼10%) of nonferromagnetic phases, see Figure 1a.Reference Hono and Sepehri-Amin1 The coercivity is an extrinsic magnetic property, which depends on the size and morphology of the crystal grains and their magnetostatic and exchange interactions; hence, understanding the microstructure–coercivity relationships for Nd-Fe-B permanent magnets is essential for developing a higher coercivity magnet.
Multiscale observation of a Nd-Fe-B-sintered magnet. (a) Scanning electron microscope in-lens secondary ion image, high-resolution transmission electron microscope images of a grain boundary in (b) as-sintered and (c) post-sinter annealed sample. (d–e) Atom probe tomography results of Nd and Pr atoms obtained from a grain boundary of the as-sintered and post-sinter annealed samples, respectively. The concentration profiles were measured from the inset boxes in the atom probe tomographs.

The typical microstructure of sintered magnets observed with an in-lens secondary ion image in scanning electron microscopy (SEM), shown in Figure 1a, consists of brightly imaged regions at triple junctions denoted as Nd-rich phases (e.g., fcc-Nd, NdO, Nd2O3, and NdFe4B4). Additionally, grain boundaries (GBs) are imaged with bright contrast, indicating enrichment of Nd. All commercially sintered magnets contain a trace amount of Cu (∼0.1 at.%) and are post-sinter annealed between 550 and 600°C, which gives rise to a coercivity increase of ∼20%. Its underlying mechanism, however, has not been understood for a long time.Reference Hono and Sepehri-Amin1
Figure 1 displays high-resolution electron microscope images of (b) as-sintered, and (c) post-sinter annealed Nd-Fe-B-based magnets.Reference Li, Ohkubo and Hono2 The GBs in the as-sintered sample do not exhibit an intergranular phase, while a thin amorphous layer of ∼2 nm thickness is observed in the post-sinter annealed sample (c). APT results for an as-sintered magnet indicate that rare earths (REs, Nd plus Pr) are segregated at GBs as a monoatomic layer (Figure 1d). Alternatively, a distinct layer of a Nd-rich phase is seen in the post-sinter annealed sample (Figure 1e).Reference Sepehri-Amin, Ohkubo, Shima and Hono3 An earlier investigation speculated that a Nd-rich layer was nonferromagnetic, which decouples intergrain exchange interactions. The APT analyses, however, showed incorporation of a large amount of ferromagnetic elements, Fe and Co, in the Nd-rich phase, ∼Nd30Fe66B3Cu, suggesting it is ferromagnetic in contrast to conventional belief.
Anisotropic Nd-Fe-B magnets can also be processed by hot-pressing rapidly solidified nanocrystalline powders followed by a hot-deformation process. This is denoted a hot-deformed magnet, and its grains have unique platelet-like shapes, 200–300 nm wide and 50 nm thick, Figure 2a; because of this fine grain size, hot-deformed magnets have the potential to exhibit much higher coercivity and an improved temperature coefficient of coercivity compared to conventional sintered magnets. Backscattered SEM images and atom probe tomographs taken from all samples exhibit a thin Nd-rich layer along the GBs.Reference Liu, Sepehri-Amin, Ohkubo, Hioki, Hattori, Schrefl and Hono4 The APT results showed a correlation between the coercivity and the Nd concentration in the intergranular phase or the magnetization of the intergranular phase (Figure 2d). Based on this, a method to enhance the coercivity of the hot-deformed magnets by increasing the Nd-concentration in the intergranular phase using a RE-TM (transition metal) eutectic alloy diffusion process was developed.Reference Sepehri-Amin, Ohkubo, Nagashima, Yano, Shoji, Kato, Schrefl and Hono5,Reference Akiya, Liu, Sepehri-Amin, Ohkubo, Hioki, Hattori and Hono6
(a) Scanning electron microscope backscattered electron images and (b) atom probe tomography results of Nd and Ga atoms obtained from hot-deformed Nd-Fe-B magnets with three different Nd concentrations. (c) Typical concentration profiles of Nd and Fe, measured from the inset boxes at A in (b), are shown on the right side. From these data, the average chemical compositions of the intergranular phases have been estimated. (d) The coercivity exhibits a clear correlation with the Nd concentration in the intergranular phase. Note: GB, grain boundary.
Enabling segregation engineering for alloy design
Segregation phenomena, such as solute decoration of GBs and dislocations, are ubiquitous in alloys.Reference Krakauer and Seidman7–Reference Li, Choi, Borchers, Westerkamp, Goto, Raabe and Kirchheim14 In an approach called segregation engineering, such phenomena are not treated as undesired effects, but are instead utilized for microstructural design.Reference Raabe, Herbig, Sandlöbes, Li, Tytko, Kuzmina, Ponge and Choi15–Reference Raabe, Sandlöbes, Millán, Ponge, Assadi, Herbig and Choi17 Here, we address equilibrium segregation at GBsReference Kirchheim18–Reference Li, Raabe, Herbig, Choi, Goto, Kostka, Yarita, Borchers and Kirchheim22 with the aim of manipulating the interfacial structure, energy, composition, and properties, enabling beneficial materials behavior.
GB segregation engineering can be applied in two ways. In an indirect approach, segregation is utilized to manipulate microstructures with the aim of influencing the mechanical behavior through the underlying microstructure–property relationships. An example is the stabilization of small grain sizes by solid decoration of GBs,Reference Chen, Herz, Li, Borchers, Choi, Raabe and Kirchheim21,Reference Li, Raabe, Herbig, Choi, Goto, Kostka, Yarita, Borchers and Kirchheim22 which reduces GB energy, and therefore, the capillary driving forces and GB mobility. Figure 3 displays an example where carbon decoration of GBs stabilizes nanocrystalline steel through reduction of GB energy and mobility.Reference Herbig, Raabe, Li, Choi, Zaefferer and Goto9 The analyses were performed by utilizing TEM and APT at the same sample positionReference Herbig, Raabe, Li, Choi, Zaefferer and Goto9 and denoted correlative microscopy.Reference Krakauer and Seidman7–Reference Kuzmina, Herbig, Ponge, Sandlöbes and Raabe10,Reference Herbig, Choi and Raabe23
Carbon decoration of grain boundaries (GBs) in a nanocrystalline steel. The carbon segregation was quantified by combining (a) transmission electron microscopy and (b) atom probe tomography analyses conducted on the same specimen.Reference Herbig, Choi and Raabe23 The solid red line indicates that the carbon excess content in low-angle GBs scales with the number of dislocations comprising the interface. Adapted with permission from Reference 9.
A more direct way to modify a material’s properties is by GB segregation, involving decorating GBs with elements that improve interfacial cohesion. Figure 4 displays an example of alloy 617 (Ni-Co-Cr-Mo-based creep-resistant alloy), where the segregation of B at high-angle GBs leads to enhanced interfacial cohesion and promotes formation of precipitates.Reference Tytko, Choi, Klöwer, Kostka, Inden and Raabe24 These two examples demonstrate recent progress in correlative APT, enabling studies of GB manipulation by solute segregation.
Segregation of B at a high-angle grain boundary (GB) in Ni-alloy 617. (a) Transmission electron microscope (TEM) image of the sample; (b) corresponding atom probe tomography (APT) result; and (c) one-dimensional (1D) concentration profile of the major alloy constituents. Boron improves cohesion across the GB and promotes precipitation (γ), such that (d) the high-temperature rupture strength is improved, as demonstrated by comparing alloy 617 (Nicrofer5520Co) with the corresponding B-doped alloy, 617B (Nicrofer5520CoB), between 600°C and 750°C (105 h); the yellow arrow in (b) indicates the region from which the compositional profiles are taken. Adapted with permission from Reference 24.
APT-guided breakthroughs in the design of third-generation advanced high-strength steels
Motivated by the increasing demand for stronger steels that achieve dramatic weight savings in engineered structures, a recent research study investigated the design of an AHSS.Reference Yen, Ooi, Eizadjou, Breen, Huang, Bhadeshia and Ringer25 The critical enabler was APT, where subnano- to nanoscale resolution of the chemistry and crystallography guided the selection of steel composition and thermomechanical treatment.Reference Gault, Moody, Cairney and Ringer26 The focus in this case is on steels that exhibit a reverse austenite transformation to yield an austenite–ferrite (γ–α) duplex microstructure. The goal was to extend the performance and practicality of a third-generation (G3) AHSS utilizing an ultrafine grain size; see Figure 5a.Reference Yen, Ooi, Eizadjou, Breen, Huang, Bhadeshia and Ringer25 The first generation of AHSS (G1) has classical constraints on the combinations of strength and ductility that can be achieved. Second-generation AHSSs (G2) possess very attractive combinations of strength and ductility, but there has been limited adoption of these steels into, for example, the auto industry because of the costs associated with the need for such high (∼5–17 wt%) Mn content.Reference De Cooman, Chin, Kim and Chiaberge29 This has driven demand for G3 steels with reduced Mn content, yet excellent toughness. As is clear from Figure 5a, issues remain—the properties are largely inferior to the G2 steels, and prohibitively long annealing periods are often required to produce the desired microstructures.
(a) A map of the mechanical properties of conventional and advanced high-strength steels, based on Bouaziz’s approach.Reference Bouaziz, Allain, Scott, Cugy and Barbier27 Current results (red circle) for a Fe-11Mn-0.08C-0.36Si-0.07V-0.3Mo wt% steel annealed at 610°C for 8 min are charted, demonstrating a highly desirable combination of strength and ductility. (b) Atomic distribution map of iron, manganese, and carbon across a ferrite (α)/austenite (γ) interface, the crystallography of which is revealed via the field desorption images from each phase (arrowed, inset) to be consistent with the Kurdjumov–Sachs orientation relationship; the concentration profiles of (c) manganese, and (d) carbon across the α/γ interface, showing clear solute partitioning to austenite; (e) austenite (blue) and ferrite (red) mapped using transmission Kikuchi diffraction imaging,Reference Trimby28 demonstrating the submicron grain sizes in this duplex microstructure.Reference Yen, Ooi, Eizadjou, Breen, Huang, Bhadeshia and Ringer25 Adapted with permission from References 27 and 28. Note: Q&P, quenching and partitioning; CP, complex phase; TRIP, transformation-induced plasticity; DP, dual phase; BH, bake hardening; HSLA, high-strength low-alloy; d α, ferrite grain size; d γ, austenite grain size; YS, yield strength; UTS, ultimate tensile strength; and EL, elongation.
The G3 steel design in this study had a higher Mn concentration and a slightly lower carbon concentration than earlier G3 steels. This alloy design makes cold rolling feasible, enabling the production of a fine martensitic starting microstructure. This dramatically enhanced the number of nucleation sites for the formation of austenite during subsequent annealing, accelerating a reverse-austenite transformation and producing an outstanding grain-refinement effect for the resulting duplex microstructure.
Importantly, this enabled the application of higher annealing temperature to accelerate solute partitioning to shorter times, a critical industrial consideration that is an issue for recent G3 steel designs.Reference Luo, Shi, Wang, Cao, Sun and Dong30–Reference De Cooman, Gibbs, Lee and Matlock32 Moreover, prior work identified that austenite formed at these higher annealing temperatures was relatively unstable, with rapid onset of the transformation induced plasticity effect, thus achieving high strengths with low ductility.Reference De Cooman, Gibbs, Lee and Matlock32 In the present case, this austenite instability is compensated for by the ultrafine austenite grain sizes that result from high nucleation rates. Thus, synergistic effects were engineered between (i) enhanced mechanical stability of the austenite due to fine grain sizes; and (ii) reduced chemical stability of the austenite due to solute enrichment. This serves to balance the austenite stability. After deformation of this duplex microstructure, the austenite transforms to martensite to sustain a high work-hardening rate. This produces an outstanding combination of strength and ductility.
APT has been essential for developing these ideas, enabling critical investigations of solute partitioning. Figure 5b shows an analysis of the solute partitioning between austenite and ferrite in Fe-11Mn-0.08C-0.36Si-0.07V-0.3Mo (wt%) steel, annealed at 610°C for 8 min.Reference Yen, Ooi, Eizadjou, Breen, Huang, Bhadeshia and Ringer25 Such short heat treatments make it extremely challenging to predict the degree of partitioning using calculations, where the heating part of the thermal cycle is a significant component of the overall heat treatment. Figure 5c–d shows concentration profiles of Mn and C across the α/γ interface shown in Figure 5b. The measured Mn and C concentrations are significantly higher than the equilibrium values calculated using the Thermocalc program with the TCFE7 database (thermodynamic database for various types of steels).Reference Andersson, Helander, Hoglund, Shi and Sundman33 The additional ∼2.6 wt% Mn resulted in different mechanical behavior compared to materials annealed for longer times to achieve near-equilibrium values.
We measured a yield strength of 1080 MPa, an ultimate tensile strength of 1390 MPa, and an elongation of 26.7%, compared to corresponding values of 1240 MPa, 1360 MPa, and 8.5% for a 2 h anneal at 550°C,Reference Yen, Ooi, Eizadjou, Breen, Huang, Bhadeshia and Ringer25 where the solute levels are close to their equilibrium values. The direct measurements of solute partitioning via APT were essential in obtaining these microstructure–property relationships. Figure 5e confirms that the ultrafine-grained austenite is retained after a short annealing time at higher temperatures. Using APT measurements of partitioning, we are able to tune the heat treatments to achieve GPa-level strength via an ultrafine-grained microstructure and achieve high ductility via control of the austenite stability.
As these AHSSs are utilized in the automobile industry, the reduced CO2 emissions and lower fuel consumption, achieved by reduced vehicle weight, will improve human health and contribute significantly to achieving emission targets. These advances are enabled by modern materials science, underpinned by 3D observations of atomic-scale microstructures via APT.
Temporal evolution of a Ni-Al-Cr alloy studied by APT
We next focus on the phase separation of a Ni-6.5 Al-9.5 Cr (at.%) alloy.Reference Booth-Morrison, Zhou, Noebe and Seidman34 Nanometer-sized spheroidal γ′ (L12-structure) precipitates were detected in the γ (fcc) matrix of this alloy for aging times between 0.5 h and 1024 h. After aging for 4096 h, the γ′ precipitates commenced a spheroidal-to-cuboidal morphological transformation to minimize their elastic strain energy as their radii increase. For times of 1.5–64 h, γ′ precipitate coagulation and coalescence occurred, with L12-ordered necks interconnecting γ′ precipitates. Coagulation–coalescence has been detected in two other Ni-Al-Cr alloysReference Lund and Voorhees35–Reference Sudbrack, Yoon, Noebe and Seidman37 due to overlapping of the nonequilibrium γ′ precipitate diffusion fields, which are caused by coupling among diffusion fluxes of Ni, Al, and Cr toward and away from γ′ precipitates.
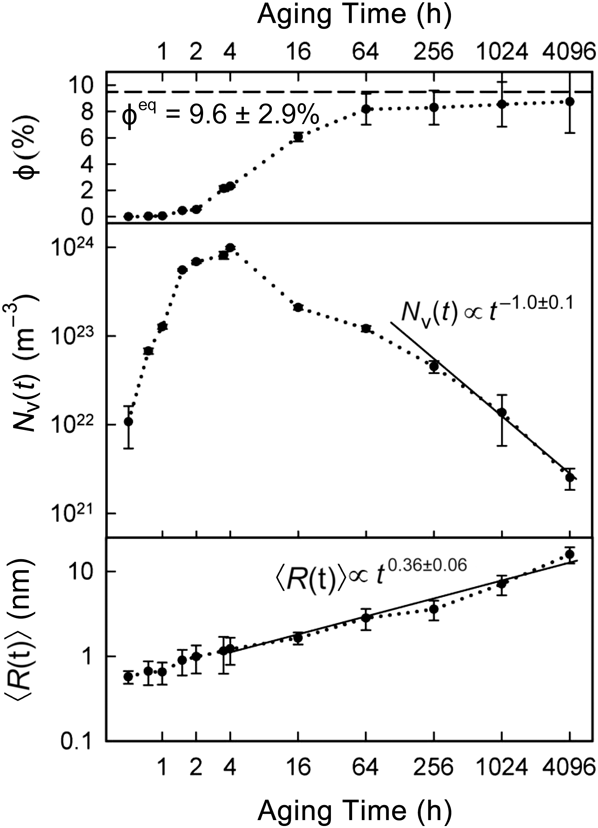
The temporal evolution at 873 K has four regimes: (i) quasi-stationary γ′-precipitate nucleation from 0.5 h to 1.5 h; (ii) nucleation and growth from 1.5 to 4 h; (iii) growth and coarsening from 4 to 256 h; and (iv) quasi-stationary coarsening of γ′ precipitates from 256 to 4096 h. Figure 6 displays the temporal evolution of the γ′-precipitate volume fraction, ϕ, mean radius, 〈R(t)〉, and number density, N v(t), where t is time. The γ′-precipitate nucleation current is 1.5 ± 0.7 × 10²⁰ m–3 s–1 between 0.5 and 1.5 h, at a relatively constant 〈R(t)〉 of 0.62 ± 0.17 nm. Phase separation by nucleation has been studied for model binary alloys using nucleation theory, which is beyond the scope of this article.Reference Martin38
The temporal evolution of γ′-precipitate volume fraction, ϕ, number density, N v(t), and mean radius, 〈R(t)〉, for Ni-6.5 Al-9.5 Cr at.% at 873 K. The quantity 〈R(t)〉 is proportional to t 1/3 during quasi-stationary coarsening for times >4 h, as predicted by all diffusion-limited coarsening models. Once the equilibrium volume fraction is achieved after 256 h, the dependence of N v(t) is proportional to t –1. Note: ϕeq, equilibrium volume fraction of the γ′-precipitate phase.Reference Booth-Morrison, Zhou, Noebe and Seidman34
As seen in Figure 6, between 4 and 256 h, ϕ and 〈R(t)〉 increase and N v(t) decreases, as expected for quasi-stationary coarsening. Prior studies of phase separation of Ni-Al-Cr alloys have shown that 〈R(t)〉 obeys classical quasi-stationary coarsening models.Reference Lund and Voorhees35,Reference Booth-Morrison, Weninger, Sudbrack, Mao, Noebe and Seidman36,Reference Sudbrack, Noebe and Seidman39 Previously, the predicted temporal evolution of N v(t) and the precipitate size distributions were not validated in detail, because the alloys had not achieved a quasi-stationary coarsening for kinetic reasons. The first comprehensive mean-field model of coarsening, the Lifshitz–Slyozov–Wagner model, is for dilute binary alloys with spatially fixed spherical precipitates, whose initial compositions are equal to their equilibrium values. These are very stringent requirements.
Kuehmann–Voorhees (KV)Reference Kuehmann and Voorhees40 considered isothermal coarsening in ternary alloys and developed a model, which includes the effects of capillarity on precipitate composition. Therefore, the phase compositions can deviate from their equilibrium values. In the quasi-stationary limit, the exponents of the temporal dependencies for 〈R(t)〉, N v(t), and γ-matrix supersaturation,  $\Delta C_i^\gamma \left( t \right)$, of each solute species i are:
 $${\left\langle {R\left( t \right)} \right\rangle ^3} - {\left\langle {R\left( {{t_0}} \right)} \right\rangle ^3} = {K_{{\rm{KV}}}}\left( {t - {t_0}} \right),$$
 $${N_{\rm{v}}}{\left( t \right)^{ - 1}} - {N_{\rm{v}}}{\left( {{t_0}} \right)^{ - 1}} = {{4.74{K_{{\rm{KV}}}}} \over {{\phi ^{{\rm{eq}}}}}}\left( {t - {t_0}} \right),$$
 $$\Delta C_i^\gamma \left( t \right) = \left\langle {C_i^{\gamma ,{\rm{ff}}}\left( t \right)} \right\rangle - C_i^{\gamma ,{\rm{eq}}}\left( \infty \right) = \kappa _{i,{\rm{KV}}}^\gamma {t^{{{ - 1} \mathord{\left/ {\vphantom {{ - 1} 3}} \right. \kern-\nulldelimiterspace} 3}}},$$
where K KV and  $\kappa _{i,{\rm{KV}}}^\gamma$ are coarsening rate constants; 〈R(t 0)〉 and N v(t 0) are the mean radius and number density values, respectively, at the onset of quasi-stationary coarsening (t 0); and ϕeq is the equilibrium precipitate volume fraction. The quantity
 $\Delta C_i^\gamma \left( t \right)$ is the supersaturation and is the difference between the concentration in the far-field γ matrix,
 $\left\langle {C_i^{\gamma ,{\rm{ff}}}\left( t \right)} \right\rangle$, and the equilibrium γ-matrix solute solubility,
 $C_i^{\gamma ,{\rm{eq}}}\left( \infty \right)$. 〈R(t)〉 is t 0.36±0.06 from 4 h to 4096 h. The prediction of the evolution of 〈R(t)〉 has been validated for alloys where ϕeq has not been achieved, as is the case for aging times of 4–256 h.
From 4 h to 16 h, N v(t) decreases from its maximum, 9.84 ± 0.33 × 10²³ m–3, at 4 h to 2.09 ± 0.12 × 10²³ m–3 at 16 h, as a result of coarsening by both evaporation–condensation and coagulation–coalescence coarsening mechanisms. The percentage of coagulating–coalescing γ′ precipitates is 25 ± 3% at 4 h, and 12 ± 2% after 16 h; thus, coarsening by this mechanism is significant in this time range. ϕ(t) increases from 2.31 ± 0.08 to 6.06 ± 0.34% in this range, where γ′-precipitate growth is continuously ongoing. For times >64 h, only 4 ± 1% of γ′-precipitates undergo coagulation–coalescence, thus coarsening by the evaporation–condensation mechanism is also occurring. For the range 256–4096 h, where coagulation–coalescence is not detected and ϕ → ϕeq, the temporal dependence of N v(t) is t –1.0±0.1, as predicted by all physically based diffusion-limited models of coarsening: the KV model for ternary alloys and the Philippe–VoorheesReference Philippe and Voorhees41 model for concentrated multicomponent alloys.Reference Morral and Purdy42,Reference Umantsev and Olson43 We also determined that  $\Delta C_i^\gamma \left( t \right)$ for Ni-Al-Cr is a function of t –1/3, thereby, demonstrating in detail that for Ni-6.5 Al-9.5 Cr (at.%), Equations 1, 2, and 3 are obeyed.Reference Booth-Morrison, Zhou, Noebe and Seidman34
Conclusions
APT continues to have a significant impact on studies of metallic alloys because of its unique ability to yield highly quantitative chemical information on a subnano- to nanoscale, which can frequently be compared with atomistic simulations, as demonstrated in the four example studies discussed here and elsewhere in the archival literature.
Acknowledgments
We wish to acknowledge the important contributions of our colleagues at our respective institutions for helping to make this research possible. K.H. thanks JST, CREST for funding permanent magnet research at NIMS. S.P.R. acknowledges Prof. Yen (NTU), the ARC, and the AMMRF. D.N.S. thanks the NSF MURI, ONR DURIP programs for funds to purchase a LEAP tomograph and for funds to perform research.