Introduction
Retinitis pigmentosa (RP) encompasses several heritable diseases that involve the degeneration of photoreceptor cells. Individuals with RP exhibit symptoms such as night blindness, followed by decreasing visual fields and ultimately progressive visual impairment that can result in legal or complete blindness (Hartong et al., Reference Hartong, Berson and Dryja2006). On the basis of inheritance, nonsyndromic RP can be divided into autosomal dominant, recessive, and X-linked forms. Multiple factors contribute to the heterogeneous nature of RP (reviewed in Rivolta et al., Reference Rivolta, Sharon, DeAngelis and Dryja2002; Anasagasti et al., Reference Anasagasti, Irigoyen, Barandika, López de Munain and Ruiz-Ederra2012). Clinical RP phenotypes vary considerably with respect to severity, age of onset, and causal genes, and are thought to reflect the effects of particular mutations of RP-associated proteins (Mendes et al., Reference Mendes, van der Spuy, Chapple and Cheetham2005; Hartong et al., Reference Hartong, Berson and Dryja2006; Anasagasti et al., Reference Anasagasti, Irigoyen, Barandika, López de Munain and Ruiz-Ederra2012). Currently, mutations in over 50 genes have known links to RP, and recent advances in high-throughput sequencing are frequently uncovering novel causative genes and mutations (e.g., Bowne et al., Reference Bowne, Sullivan, Koboldt, Ding, Fulton, Abbott, Sodergren, Birch, Wheaton, Heckenlively, Liu, Pierce, Weinstock and Daiger2011; Nishiguchi et al., Reference Nishiguchi, Tearle, Liu, Oh, Miyake, Benaglio, Harper, Koskiniemi-Kuendig, Venturini, Sharon, Koenekoop, Nakamura, Kondo, Ueno, Yasuma, Beckmann, Ikegawa, Matsumoto, Terasaki, Berson, Katsanis and Rivolta2013; Yang et al., Reference Yang, Xie, Feng, Yuan, Zhang and Zhao2014). Despite these advances in diagnosis and clinical characterization, molecular characterization of RP remains challenging due to the diversity of causal genes and their numerous disease-associated mutations. These disease genes are involved in a variety of processes both within and outside of the visual cycle, such as vitamin A metabolism, cell–cell interactions, cell structure, and signaling (reviewed in Hartong et al., Reference Hartong, Berson and Dryja2006).
One of the most prominent and best characterized RP disease genes investigated to date is rhodopsin (RHO), the visual pigment found in rod photoreceptor cells that initiates the visual transduction cascade. Mutations in RHO account for roughly 30–40% of dominant RP cases (Ferrari et al., Reference Ferrari, Di Iorio, Barbaro, Ponzin, Sorrentino and Parmeggiani2011). Of the variety of RP-linked genes studied to date, RHO is particularly amenable to studies exploring the link between variation in amino acid residues and protein function. First, it has been established that disease-causing mutations in RHO often interfere with proper protein folding or transportation, resulting in the aggregation of defective proteins and subsequent photoreceptor cell death (Breikers et al., Reference Breikers, Portier-VandeLuytgaarden, Bovee-Geurts and DeGrip2002; Mendes et al., Reference Mendes, van der Spuy, Chapple and Cheetham2005). Second, the crystal structure of RHO has been resolved for both the inactive and active conformations (Palczewski et al., Reference Palczewski, Kumasaka, Hori, Behnke, Motoshima, Fox, Le Trong, Teller, Okada, Stenkamp, Yamamoto and Miyano2000; Choe et al., Reference Choe, Kim, Park, Morizumi, Pai, Krauß, Hofmann, Scheerer and Ernst2011). Third, numerous mutant RHO proteins (comprising both naturally occurring and pathogenic mutants) have been characterized with respect to structure and function (e.g., Janz et al., Reference Janz, Fay and Farrens2003; Piechnick et al., Reference Piechnick, Ritter, Hildebrand, Ernst, Scheerer, Hofmann and Heck2012; McKeone et al., Reference McKeone, Wikstrom, Kiel and Rakoczy2014; Morrow & Chang, Reference Morrow and Chang2015). Due to its importance in visual transduction, natural variation in RHO sequence, structure, and function has been extensively investigated across a diversity of animals (Zhao et al., Reference Zhao, Ru, Teeling, Faulkes, Zhang and Rossiter2009; Sugawara et al., Reference Sugawara, Imai, Nikaido, Imamoto and Okada2010; Porter et al., Reference Porter, Blasic, Bok, Cameron, Pringle, Cronin and Robinson2011; Schott et al., Reference Schott, Refvik, Hauser, López-Fernández and Chang2014).
Outside of the visual transduction cascade, the visual cycle gene RPE65 has also been experimentally investigated with respect to clinically relevant mutations: over 60 point mutations have been linked to both RP and an early-onset form of retinal degeneration, Leber's congenital amaurosis. RPE65 is a large membrane-bound retinoid isomerase located in the retinal pigment epithelium and is responsible for the conversion of activated all-trans-retinal to 11-cis-retinal. While less extensively studied relative to RHO, recent structural and clinical studies have begun to elucidate the effect of point mutations on RPE65 function in greater detail (Moiseyev et al., Reference Moiseyev, Chen, Takahashi, Wu and Ma2005; Redmond et al., Reference Redmond, Poliakov, Yu, Tsai, Lu and Gentleman2005; Philpa et al., Reference Philpa, Jin, Li, Schindler, Iannaccone, Lam, Weleber, Fishman, Jacobson, Mullins, Travis and Stone2009; Cideciyan, Reference Cideciyan2010; Li et al., Reference Li, Izumi, Hu, Jin, Siddiqui, Jacobson, Bok and Jin2014; Takahashi et al., Reference Takahashi, Moiseyev and Ma2014; Li et al., Reference Li, Hu, Jin, Aiyar, Jacobson, Bok and Jin2015), and a crystal structure has also been resolved (Kiser & Palczewski, Reference Kiser and Palczewski2010).
Despite numerous studies examining RP mutations in RHO and other causal RP genes in human populations, molecular characterization of this disease remains challenging, and accurately validating disease mutations is not always straightforward, particularly in genes for which there is little functional information. Comparative analyses combined with studies of protein structure and function can lend insight into the molecular determinants of disease and help to inform which mutations are more likely to result in a disease phenotype. Intuitively, mutations at highly conserved amino acid sites are more likely to be deleterious, often resulting in the disease phenotypes observed in RP (e.g., Briscoe et al., Reference Briscoe, Gaur and Kumar2004; Iannaccone et al., Reference Iannaccone, Man, Waseem, Jennings, Ganapathiraju, Gallaher, Reese, Bhattacharya and Klein-Seetharaman2006). However, despite the high conservation of RHO and RPE65 and their critical role in phototransduction and visual regeneration, there is abundant natural sequence variation in both genes across vertebrate groups. This variation presents an opportunity to conduct an evolutionarily informed (phylomedicine) study of retinal protein function in the context of hereditary disease.
The genetic complexity of RP combined with recent advances in sequencing technology means that accurate and reliable molecular diagnosis of disease-causing RP mutations is particularly important (reviewed in Anasagasti et al., Reference Anasagasti, Irigoyen, Barandika, López de Munain and Ruiz-Ederra2012). Through the analysis of natural sequence variation, we can make inferences about the evolutionary constraints operating on amino acid residues critical for proper protein function. In addition to identifying the location of conserved residues, codon-based methods of sequence analysis can estimate the degree of selective constraint imposed on a given site, as indicated by the evolutionary rate ratio of nonsynonymous to synonymous amino acid substitutions, or d N/d S. This approach assumes that functionally important residues will be subject to greater selective constraint, and therefore lower d N/d S, and that mutations at these sites are more likely to be deleterious and potentially disease-causing. Numerous studies have harnessed interspecific sequence analysis to examine known disease mutations, encompassing a variety of diseases and proteins (Greenblatt et al., Reference Greenblatt, Beaudet, Gump, Godin, Trombley, Koh and Bond2003; Gaucher et al., Reference Gaucher, De Kee and Benner2006; Stover & Verrelli, Reference Stover and Verrelli2010; Rishishwar et al., Reference Rishishwar, Varghese, Tyagi, Harvey, Jordan and McCarty2012; Kirwan et al., Reference Kirwan, Bekaert, Commins, Davies, Rossiter and Teeling2013). Beyond an explicitly disease-focused context, these comparative methods have also addressed areas of medical relevance, such as longevity (Morgan et al., Reference Morgan, Mc Cartney, Donoghue, Loughran, Spillane, Teeling and O’Connell2013) and immune response (Webb et al., Reference Webb, Gerek, Morgan, Walsh, Loscher, Edwards and O’Connell2015), using estimates of positive selection to interpret and identify potential changes in protein function. In addition to known disease sites, cross-species data may aid predictions of other conserved amino acid residues critical for proper protein function that would likely generate a defective product if mutated (Miller & Kumar, Reference Miller and Kumar2001; Mooney & Klein, Reference Mooney and Klein2002; Greenblatt et al., Reference Greenblatt, Beaudet, Gump, Godin, Trombley, Koh and Bond2003). To take advantage of the diversity of sequences available, an appropriate phylogenetic scope for coding sequence sampling must be established. For analyses of human disease genes, although it may be desirable to use only mammalian sequences, if these sequences have high similarity there may be insufficient variation to detect conserved versus nonconserved sites (but see Cooper et al., Reference Cooper, Brudno, Green, Batzoglou and Sidow2003).
In this study, we calculated the evolutionary rate ratio (d N/d S) in vertebrate and mammalian datasets of the visual transduction gene RHO and the visual (retinoid) cycle gene RPE65, and compared the evolutionary conservation of codon sites harboring disease-associated (pathogenic) mutations with sites that have not been implicated in disease. Our aim was to assess the extent to which codon-based evolutionary analyses can inform studies of human diseases caused by defective proteins. Metrics of evolutionary conservation using orthologous sequences are implemented in several disease prediction programs, such as PolyPhen (Adzhubei et al., Reference Adzhubei, Schmidt, Peshkin, Ramensky, Gerasimova, Bork, Kondrashov and Sunyaev2010) and SIFT (Ng & Henikoff, Reference Ng and Henikoff2003), but the appropriate method of homologous sequence analysis varies depending on the nature of the alignment, disease, and protein in question (Flanagan et al., Reference Flanagan, Patch and Ellard2010; Hicks et al., Reference Hicks, Wheeler, Plon and Kimmel2011). Incorporating measures of d N/d S as estimated by the methods outlined in this study may provide a useful complement to programs designed to specifically identify disease-causing protein defects. Using large sequence datasets, we investigate how varying the level of taxonomic divergence, the selection of pathogenic sites, and the molecular evolutionary method can impact analyses of human visual disease genes. Overall, pathogenic sites had significantly lower d N/d S values in comparison to nonpathogenic sites. Many of the RHO mutations known to cause RP have been examined through mutagenesis experiments; however, new disease-associated RHO mutations are frequently discovered (Hollingsworth & Gross, Reference Hollingsworth and Gross2013; Liu et al., Reference Liu, Liu, Mehrotra, Liu, Guo, Baldera-Aguayo, Mooney, Nour and Yan2013; Opefi et al., Reference Opefi, South, Reynolds, Smith and Reeves2013; Pierrottet et al., Reference Pierrottet, Zuntini, Digiuni, Bazzanella, Ferri, Paderni, Rossetti, Cecchin, Orzalesi and Bertelli2014; Yang et al., Reference Yang, Xie, Feng, Yuan, Zhang and Zhao2014). In genes such as RPE65, for which there are fewer studies of structure and function, computational analyses of this nature may provide a crucial first step in understanding novel mutations in a clinical context.
Materials and methods
Dataset acquisition
RHO and RPE65 genes were selected for comparative analyses of coding sequence evolution in vertebrates. These genes were selected based on an abundance of nonsyndromic disease-associated missense or nonsense mutations in humans, expression in the retina, association with hereditary retinal degeneration, and a large number of available sequences for robust molecular evolutionary analyses. Since there are fewer RPE65 sequences available compared to RHO, an exhaustive search was performed to identify and acquire all vertebrate RPE65 sequences available on GenBank. To maintain similar taxon sampling and ensure that the datasets were comparable, we acquired RHO sequences from these same species where possible. We also created a second RHO dataset that contained only mammals but with a similar number of sequences as the vertebrate datasets. As we already included all available RPE65 sequences, our mammalian dataset for RPE65 is simply the subset containing only mammals. Species list and accession numbers for all sequences used in this study are provided in Supplementary Table 1.
Phylogenetic analyses
Sequences from each of the four datasets were aligned separately using PRANK codon alignment, which has been found to reduce coding sequence alignment errors for evolutionary analysis by incorporating phylogenetic information into gap placement (Löytynoja & Goldman, Reference Löytynoja and Goldman2005; Löytynoja & Goldman, Reference Löytynoja and Goldman2008). Gene trees were estimated in MrBayes 3 (Ronquist & Huelsenbeck, Reference Ronquist and Huelsenbeck2003) and by maximum likelihood (ML) using PhyML 3 (Guindon et al., Reference Guindon, Dufayard, Lefort, Anisimova, Hordijk and Gascuel2010) (Supplemental Figs. 1–8). The Bayesian analyses were run for five million generations with a 25% burn-in. Convergence was determined by verifying that the standard deviations of split frequencies approached zero and that there was no obvious trend in the log likelihood plot. The ML analyses were run under the GTR+G+I model with a BioNJ starting tree, the best of NNI (nearest neighbour interchange) and SPR (subtree pruning and regrafting) tree improvement and aLRT SH-like branch support (approximate likelihood ratio test with Shimodaira-Hasegawa-like branch support) (Anisimova & Gascuel, Reference Anisimova and Gascuel2006).
Molecular evolutionary analyses
To estimate the strength of selection acting across RHO and RPE65, as well as the strength of selection acting on individual amino acid sites, the alignment and gene trees were analyzed in the HYPHY software package (Kosakovsky Pond et al., Reference Kosakovsky Pond, Frost and Muse2005), as implemented on the Datamonkey webserver (Delport et al., Reference Delport, Poon, Frost and Kosakovsky Pond2010) and in the codeml package of PAML 4 (Yang, Reference Yang2007). Specifically, we used the PAML random sites models (M0, M1a, M2a, M3, M7, M8), and the FEL and FUBAR methods in HYPHY (Scheffler et al., Reference Scheffler, Martin and Seoighe2006; Yang, Reference Yang2007; Murrell et al., Reference Murrell, Moola, Mabona, Weighill, Sheward, Kosakovsky Pond and Scheffler2013). The PAML random sites models estimate d N/d S as a single value for a prespecified number of site classes. The posterior probability distribution of the assignment of individual sites to these site classes is then calculated using a Bayes empirical Bayes analysis and d N/d S values are calculated as weighted averages from this distribution. For comparison to the HYPHY models, we chose M8, as this was most often the best-fitting model and was most comparable in terms of the numbers of site classes. For M8, site categories are calculated from a β distribution ranging from 0 to 1, discretized into 10 categories, with an additional site category with d N/d S ≥ 1. Unlike the PAML models, FEL and FUBAR estimate d N and d S separately. FEL estimates d N and d S independently for each site, while FUBAR estimates d N and d S using alignment-wide information and 400 rate categories. All analyses were carried out using both the Bayesian and ML trees.
Analyses of disease-associated mutations
Disease-associated mutations were identified for both RHO and RPE65. For the purpose of this study, we defined pathogenic mutations as being any mutation reported in the Human Gene Mutation Database (Stenson et al., Reference Stenson, Mort, Ball, Shaw, Phillips and Cooper2013), dbSNP (Sherry et al., Reference Sherry, Ward, Kholodov, Baker, Phan, Smigielski and Sirotkin2001), UniProt (Magrane & UniProt Consortium, Reference Magrane2011), or Online Mendelian Inheritance in Man (Hamosh, Reference Hamosh2005) disease databases (referred to as “reported” pathogenic mutations in our RHO dataset). Sites linked to congenital stationary night blindness were included in our list of RHO pathogenic sites, as well as sites linked to Leber congenital amaurosis in RPE65. As substantial verification of disease-associated mutations has been performed for RHO, we also created a second subset of disease sites (hereafter, referred to as “confirmed pathogenic sites”) that included only those sites with either experimental validation or that were clinically verified with familial cosegregation studies (Supplemental Table 2). We used these criteria to categorize sites as either pathogenic or nonpathogenic (and for RHO, confirmed pathogenic and nonpathogenic) and compared d N/d S values between these two groups. Because the HYPHY models estimate d N and d S separately, we were also able to compare a second metric, d N − d S, as well as d N and d S separately. To identify statistically significant differences between estimates at pathogenic versus nonpathogenic sites, we used the nonparametric Mann–Whitney U test, due to substitution rates being highly nonnormal. Comparisons were made using the M8 (PAML), FUBAR (HYPHY), and FEL (HYPHY) models for the vertebrate and mammalian datasets of RHO and RPE65 using both the Bayesian and ML tree topologies. Values of d N/d S for RHO and RPE65 from vertebrate FUBAR analyses were scaled and converted into color gradient space (where white represents the highest d N/d S, and dark blue represents the lowest d N/d S) and mapped onto the 3D crystal structures of RHO (IU19; Okada et al., Reference Okada, Sugihara, Bondar, Elstner, Entel and Buss2004) and RPE65 (3FSN; Kiser et al., Reference Kiser, Golczak, Lodowski, Chance and Palczewski2009) using Chimera (Pettersen et al., Reference Pettersen, Goddard, Huang, Couch, Greenblatt, Meng and Ferrin2004). This created a “heat map” of conservation values (d N/d S) that were visualized in the context of the 3D structure. To infer how structural features correspond to conservation and pathogenicity, pathogenic sites in RHO and RPE65 were highlighted in both structures.
Results
Alignments and trees
The alignment length and number of sequences for the vertebrate and mammalian datasets of RHO and RPE65 are summarized in Table 1, as well as the number of disease-associated sites analyzed in each gene. Results from the phylogenetic analyses of the vertebrate and mammalian RHO and RPE65 alignments were generally congruent with species relationships (Meredith et al., Reference Meredith, Janečka, Gatesy, Ryder, Fisher, Teeling, Goodbla, Eizirik, Simão, Stadler, Rabosky, Honeycutt, Flynn, Ingram, Steiner, Williams, Robinson, Burk-Herrick, Westerman, Ayoub, Springer and Murphy2011; Crottini et al., Reference Crottini, Madsen and Poux2012; Fong et al., Reference Fong, Brown, Fujita and Boussau2012). Bayesian and ML phylogenies for RHO and RPE65 were similar, and both phylogenies were used in subsequent molecular evolutionary analyses. The results of the analyses were consistent regardless of the phylogenetic reconstruction method used (Supplemental Tables 3–9).
Summary of RHO and RPE65 datasets

Molecular evolutionary analyses
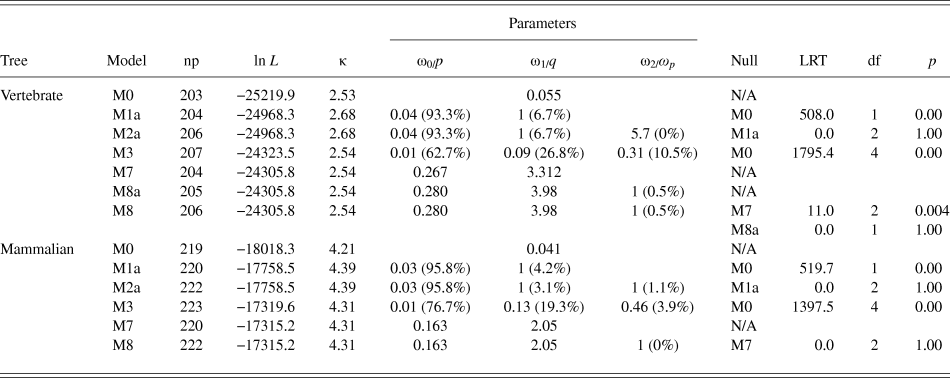
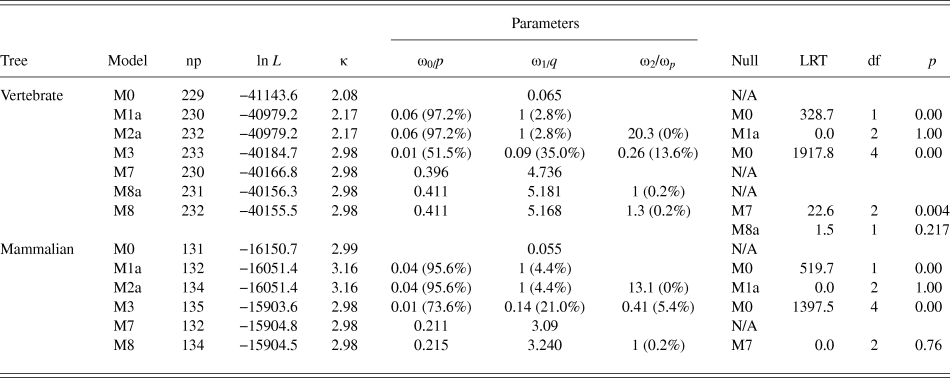
To assess selective pressure across vertebrate and mammalian datasets of RHO and RPE65, we used a variety of molecular evolutionary approaches: the random sites models in the PAML software package (Yang, Reference Yang2007), and FEL and FUBAR models in the HYPHY software package (Kosakovsky Pond et al., Reference Kosakovsky Pond, Frost and Muse2005). The random sites PAML models confirmed that there is variation in d N/d S in the vertebrate and mammalian datasets of both RHO and RPE65 (the ratio of nonsynonymous to synonymous substitution rate; M3 vs. M0, P < 0.001; Tables 2 and 3), as expected for protein-coding genes. These models did not find significant evidence for a positively selected class of sites (M2a vs. M1a, M7 vs. M8, M8 vs. M8a where applicable; Tables 2 and 3) for either gene, reflecting high evolutionary conservation across both vertebrates and mammals. No positively selected (i.e., d N/d S > 1) sites were found using any of the molecular evolutionary analyses implemented in this study.
Results of random sites models (PAML) for RHO performed on the ML tree

Note: np, number of parameters; ln L, ln likelihood; κ, transition/transversion ratio; df, degrees of freedom. For models M0–M3, the ω values for each site class (ω0–ω2) are shown with their proportions in parentheses. For models M7–M8, p and q describe the shape of the beta distribution, and ωp refers to the positively selected site class (with proportion in parentheses) for models M8 and M8a (where it is constrained to one).
Results of random sites models (PAML) for RPE65 performed on the ML tree

Note: np, number of parameters; ln L, ln likelihood; κ, transition/transversion ratio; df, degrees of freedom. For models M0–M3, the ω values for each site class (ω0–ω2) are shown with their proportions in parentheses. For models M7 and M8, p and q describe the shape of the beta distribution, and ωp refers to the positively selected site class (with proportion in parentheses) for models M8 and M8a (where it is constrained to one).
Evolutionary constraint on disease-associated amino acid sites
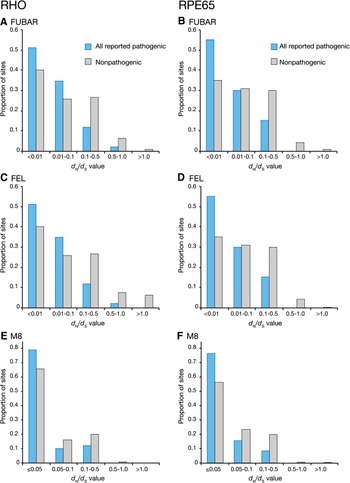
In both RHO and RPE65, we compared estimates of d N/d S across individual amino acid sites generated by three different approaches: the M8 model in PAML, and the FEL and FUBAR methods in HYPHY (Kosakovsky Pond et al., Reference Kosakovsky Pond, Frost and Muse2005; Yang, Reference Yang2005) (Murrell et al., Reference Murrell, Moola, Mabona, Weighill, Sheward, Kosakovsky Pond and Scheffler2013). Fig. 1 shows a series of histograms illustrating the distribution of pathogenic and nonpathogenic sites across d N/d S value categories, as estimated by FUBAR, FEL, and M8 in vertebrate RHO (all reported sites) and vertebrate RPE65. Regardless of the method used, pathogenic sites had significantly lower d N/d S when compared to nonpathogenic sites (Supplemental Table 6); however, Fig. 1 illustrates how the distribution of estimated d N/d S values in RHO and RPE65 differs depending on the method used.
Frequency histograms comparing the assignment of d N/d S ratios of pathogenic and nonpathogenic sites for FUBAR, FEL, and M8 analyses of vertebrate RHO and RPE65. For RHO, all 84 disease sites were used to generate histograms. Statistical comparisons of d N/d S values between pathogenic versus nonpathogenic sites for all three methods are summarized in Supplemental Table 6.

FUBAR estimates the highest proportion of disease sites with d N/d S values less than 0.01 in both RHO and RPE65 (Fig. 1A and 1B), with an increasingly lower proportion estimated at higher d N/d S values. FUBAR does not estimate any pathogenic sites with d N/d S values greater than 0.5 in RPE65 (Fig. 1B). Nonpathogenic sites in both genes show a more even distribution across the d N/d S categories, with 6–10% of sites approaching neutral selection (d N/d S = 1) and a small proportion exceeding d N/d S of 1. FEL estimates of d N/d S reveal a similar trend to the FUBAR analyses (Fig. 1C and 1D). In contrast, for any given site in RHO or RPE65, M8 does not estimate a d N/d S value less than 0.05 (Fig. 1E and 1F). The overall d N/d S estimates show a narrower distribution in both pathogenic and nonpathogenic sites, with the majority of both types of sites having an estimated d N/d S value of 0.05.
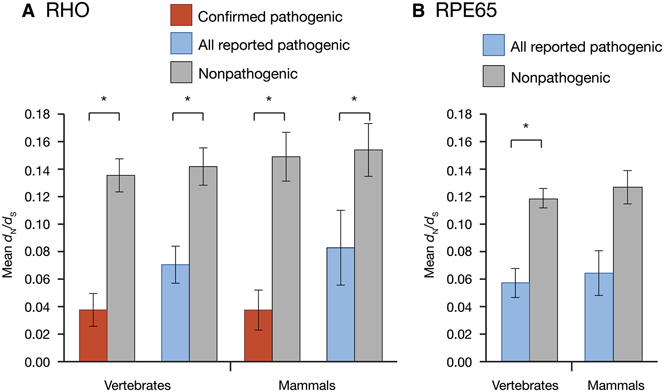
To determine if pathogenic sites had statistically significantly lower d N/d S values than nonpathogenic sites, we compared values using the nonparametric Mann–Whitney test. For d N/d S values estimated with FUBAR at each amino acid site, vertebrate and mammalian RHO sequences showed significantly lower d N/d S values at all reported (84) pathogenic sites (Fig. 2A; Supplemental Table 7). The vertebrate datasets exhibited greater overall constraint (lower d N/d S) on pathogenic sites relative to the mammalian datasets and showed more significant differences when compared to the d N/d S values of nonpathogenic sites (Fig. 2A, Supplemental Table 7). This difference was even larger when the confirmed pathogenic subset of sites was compared to nonpathogenic sites, with these 53 sites having lower d N/d S relative to the 84 sites analyzed, and these d N/d S values were more significantly different from nonpathogenic sites (Fig. 2A, Supplemental Table 7). This pattern was found in both vertebrates and mammals. In RPE65, a similar finding was recovered using the FUBAR-estimated d N/d S values. Vertebrates exhibited significant differences in d N/d S at pathogenic versus nonpathogenic sites, while the differences detected in mammals were not significant, likely due to the lower available sample size (Fig. 2B; Supplemental Table 7).
Differences in mean d N/d S of pathogenic versus nonpathogenic sites in (A) RHO and (B) RPE65 datasets. Estimates of d N/d S were obtained with FUBAR. In all instances pathogenic sites had significantly lower d N/d S with the exception of the RPE65 mammal dataset (Mann–Whitney test, P < 0.05). Statistical comparisons are summarized in Supplemental Table 7. Error bars represent ±S.E.M.

We found that differences between pathogenic and nonpathogenic sites remained significant using both the M8 and FEL methods, and supported our FUBAR results. In general, we found that out of the three methods, the FUBAR method performed best (Supplemental Tables 6 and 7). At certain sites, FEL estimates either undefined or infinite values of d N/d S due to extremely low d S values, so d N − d S is also used to infer selection. When d N − d S was compared between pathogenic and nonpathogenic sites, differences were not significant with the exception of the confirmed subset of pathogenic sites in mammalian and vertebrate RHO, and vertebrate RPE65 (Supplemental Table 8). Although the d N/d S estimates generated through M8 in PAML spanned a much narrower range of values relative to FUBAR and FEL, we still detected differences between pathogenic and nonpathogenic sites.
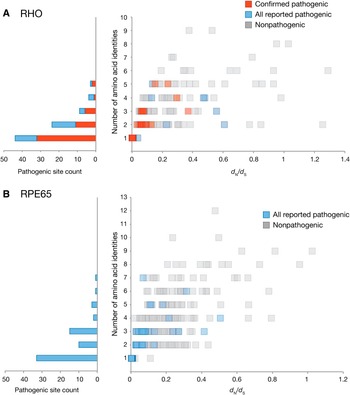
To explore the distribution of pathogenic versus nonpathogenic sites in more detail, we plotted each amino acid site with respect to the number of different amino acid residues found at that site in the alignment, against its assigned d N/d S value as estimated using FUBAR, for RHO and RPE65 (Fig. 3A and 3B). This shows that the majority of pathogenic sites are consistently found at invariant and highly conserved amino acid sites (with accompanying low d N/d S), while nonpathogenic sites show more variation in both dimensions. This pattern is even stronger in the “confirmed” subset of RHO pathogenic sites (Fig. 3A).
Distribution of all alignment sites in (A) Vertebrate RHO and (B) Vertebrate RPE65 with respect to the number of different amino acid identities at a particular site and FUBAR-estimated d N/d S values. All reported RHO pathogenic sites are shown in blue, and confirmed pathogenic RHO sites are shown in red. To illustrate the number of disease-associated alignment sites with respect to amino acid variation (where 1 = one amino acid, i.e., no variation; 2 = two different amino acids, etc.), raw counts of the pathogenic sites relative to the number of different amino acid identities at a particular alignment site are shown to the left of each graph.

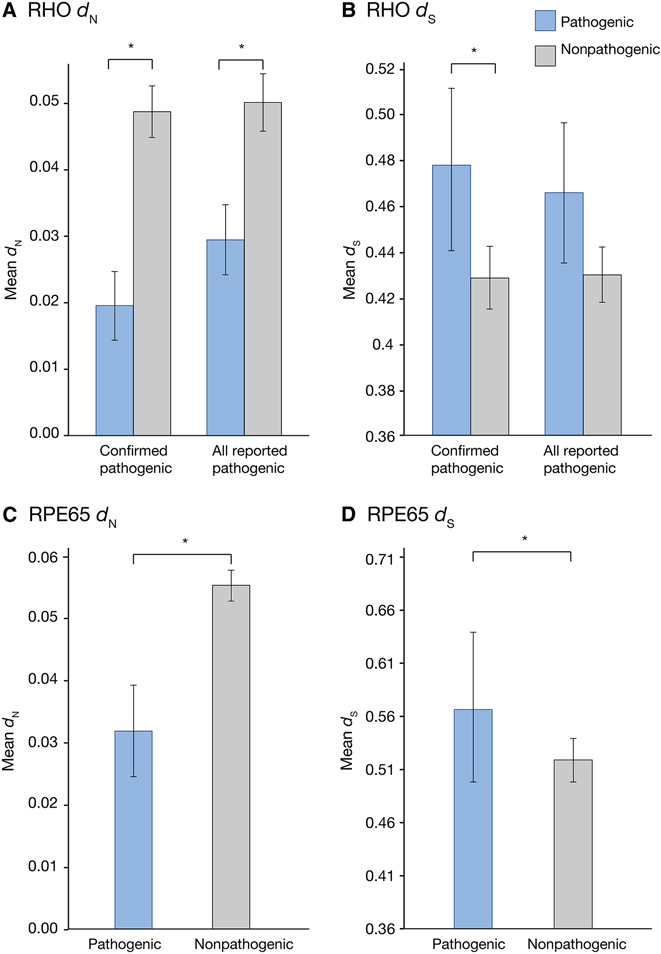
Since FUBAR allows d N and d S to be estimated independently, we were able to obtain individual values of d N and d S for each site in our vertebrate RHO and RPE65 alignments. Vertebrate RHO shows significant differences in d N between all reported pathogenic sites and nonpathogenic sites (Fig. 4A and 4B; Supplemental Table 9), but no differences in d S. The confirmed pathogenic set of RHO sites, however, shows significantly lower d N and higher d S. In vertebrate RPE65, d N is significantly lower and d S is significantly higher compared to pathogenic sites (Fig. 4C and 4D; Supplemental Table 9).
Differences in mean nonsynonymous and mean synonymous substitution rates of pathogenic versus nonpathogenic sites in the RHO vertebrate datasets (A and B) and RPE65 (C and D), determined through FUBAR analyses. In both “all reported” and “confirmed pathogenic” site categories, d N values were significantly lower relative to nondisease sites (Mann–Whitney test, P < 0.05). For confirmed sites, d S was significantly higher in disease sites, but this was not the case for “all reported” sites. Statistical comparisons are summarized in Supplemental Table 9. Error bars represent ±S.E.M.

Disease sites and dN/dS on the crystal structure
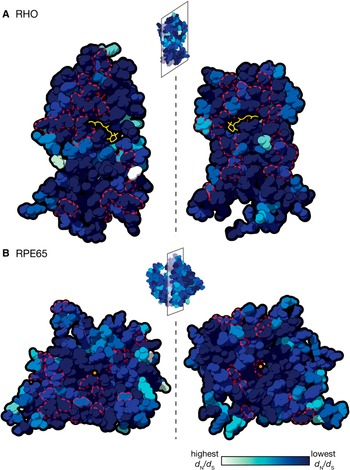
Using FUBAR-estimated vertebrate d N/d S values, we created a d N/d S heat map of conservation (where dark blue = most conserved and white = least conserved) to illustrate the relationship between structure and disease in both RHO and RPE65 (Fig. 5). The interior views of RHO (Fig. 5A) and RPE65 (Fig. 5B) show conserved residues surrounding the retinal chromophore in RHO and the catalytically active iron cofactor in RPE65. Conversely, the exterior of the proteins (the smaller structures shown above the interior views of the respective proteins) has higher variability in d N/d S. Pathogenic sites, outlined in red, are distributed throughout both proteins, tending to occur in areas of low d N/d S.
d N/d S values estimated from vertebrate FUBAR analyses converted into a conservation heat map and mapped on the 3D crystal structures of (A) RHO and (B) RPE65. The structures of both proteins have been bisected and internal views are shown. The RHO chromophore is shown in yellow, and the RPE65 iron cofactor as an orange dot. Pathogenic sites are outlined in dotted red lines.

Discussion
This study used a phylomedicine-based approach to investigate RP-associated mutations in two critical visual genes using interspecific sequence variation across vertebrates and mammals. In vertebrate and mammalian RHO sequences, we found that sites implicated in RP had significantly lower rates of nonsynonymous to synonymous substitution (d N/d S) relative to sites that were not associated with disease. We also found similarly significant lower rates for pathogenic sites in the vertebrate dataset for the visual cycle gene RPE65, but we did not find significant differences in the mammalian dataset, likely due to the smaller sample size and reduced variation in these sequences. In both genes, our vertebrate dataset yielded more statistically significant differences in mean d N/d S between pathogenic and nonpathogenic amino acid sites, as compared with a more restricted mammalian dataset. For RHO, these differences were even more striking when we only included disease-associated sites that had substantial biochemical or clinical support for pathogenicity. Our results were consistent regardless of the molecular evolutionary approach used, but here we discuss some important differences among these methods and their implications for future studies of this nature. Finally, we found that differences in the nonsynonymous substitution rate (d N), rather than the synonymous substitution rate (d S), between pathogenic and nonpathogenic sites, drive the overall differences in d N/d S rates in most instances. We discuss the importance of dataset properties, pathogenic site selection, and molecular evolutionary method for our results, and compare our approach to similar evolutionary studies of visual disease genes and human disease in general.
Implications of dataset properties on analyses of disease sites
In both visual disease genes, we consistently found significantly lower mean d N/d S in all analyses of pathogenic sites compared to nonpathogenic sites, with the single exception of the mammalian RPE65 dataset. This is most likely due to the absence of sufficient interspecific variation to generate (detectable) differences in d N/d S among sites. Though both genes are highly conserved among mammals, the additional mammalian sequences included in our RHO dataset may have provided sufficient additional variation to detect significant differences between pathogenic and nonpathogenic sites. In general, our analyses of the vertebrate dataset had greater differences between pathogenic and nonpathogenic sites and higher significance levels. Previous comparative studies of human disease genes have used various levels of evolutionary depth and taxonomic sampling (e.g., RP, Briscoe et al., Reference Briscoe, Gaur and Kumar2004; deafness, Kirwan et al., Reference Kirwan, Bekaert, Commins, Davies, Rossiter and Teeling2013; and cystic fibrosis, Rishishwar et al. Reference Rishishwar, Varghese, Tyagi, Harvey, Jordan and McCarty2012). Past work has suggested that analyses of mammalian sequences are most appropriate for studies of human disease (Cooper et al., Reference Cooper, Brudno, Green, Batzoglou and Sidow2003). While this is feasible for extensively sequenced genes (e.g., RHO), genes with less sequence information, such as RPE65, may require a wider evolutionary scope for statistically robust analyses. In general, a wider scope when fewer interspecific sequences are available is likely to enhance the ability to detect differences between pathogenic and nonpathogenic sites, due to an increased amount of variation at nonpathogenic sites as a result of increased evolutionary divergence, when function is conserved. It is important to note that increased sequence divergence can also lead to functional divergence, potentially confounding studies aiming to investigate human disease. In the case of RHO and RPE65, where function is highly conserved across vertebrates, this is not likely to be an issue, but should be carefully considered for future studies on different genes. Fortunately, with the increasing number of both mammalian and vertebrate genomes available, evolutionary studies of human disease using interspecific variation can be undertaken at multiple taxonomic levels.
Beyond varying the taxonomic scale in our study, we also performed our RHO analyses on two separate sets of pathogenic sites. We found that both our more stringent pathogenic site dataset (53 confirmed pathogenic sites, selected based on substantial clinical or biochemical evidence for deleterious effects; Supplemental Table 2) and the “all reported” pathogenic sites showed significant differences between pathogenic and nonpathogenic sites. The confirmed pathogenic sites dataset was under greater constraint than all reported pathogenic sites and thus gave more significant results, suggesting that some of the “all reported” pathogenic sites may not actually be pathogenic, or may be less severe and therefore under weaker purifying selection. This result demonstrates that the method is robust to the inclusion of sites that do not have biochemical or clinical confirmation, since most disease genes lack substantial experimental investigation of point mutations and their impact on protein structure and function.
These results also highlight an application of the method for selecting putative disease-causing mutations that lack clinical or biochemical characterization but have low d N/d S similar to known pathogenic sites, for future in vitro mutagenesis experiments. Mutations implicated in disease, but of unknown effect, that show comparatively lower evolutionary constraint (i.e., more interspecific variation) may also warrant further clinical or experimental investigation to confirm that they are actually deleterious rather than benign polymorphisms (e.g., Vincent et al., Reference Vincent, Carroll, Fishman, Sauer, Sharp, Summerfelt, Williams, Dubis, Kohl and Wong2013). For disease-associated genes with less functional data available, deleterious mutations found in these databases can be examined through comparative approaches outlined in this study to identify high priority sites (highly conserved sites) for further investigation.
Detection of higher constraint in disease sites achieved with multiple methods
The three molecular evolutionary methods used to investigate RHO and RPE65 (FUBAR, FEL, and M8) yielded similar results, and mean d N/d S estimates of each method showed significant differences between pathogenic and nonpathogenic sites. The distribution of disease sites across varying levels of evolutionary conservation was comparable between RHO and RPE65 regardless of the method implemented. Using ratios derived from FEL may be problematic when d S is zero, as d N/d S will be calculated as infinite (or undefined when d N is also zero). In these instances, using normalized d N − d S values for such comparisons between site categories could be used instead of d N/d S, or, the issue can be avoided via use of methods such as FUBAR that incorporate alignment-wide information rather than calculating d N and d S for each site independently (Kosakovsky Pond, Reference Kosakovsky Pond2005; Murrell et al., Reference Murrell, Moola, Mabona, Weighill, Sheward, Kosakovsky Pond and Scheffler2013). We found that in contrast to FUBAR and FEL, site-by-site d N/d S estimates from M8 were assigned a much narrower range of values, since these estimates are generally restricted to 10 rate categories. This discretization of the M8 β distribution into rate categories also results in d N/d S estimates that do not fall below a certain threshold (in the case of these analyses, 0.05). In contrast, FUBAR avoids this due to its larger number of site classes that are able to capture sequence variation that cannot otherwise be captured by a (discretized) β distribution. Despite these discrepancies across methods, we were still able to detect significant differences between pathogenic and nonpathogenic sites in RHO, and the M8 model in particular has been successfully used in previous studies to investigate auditory disease mutations in mammals (Kirwan et al., Reference Kirwan, Bekaert, Commins, Davies, Rossiter and Teeling2013).
An advantage of the FUBAR and FEL analyses implemented in this investigation is the ability to separately examine d N and d S. Differing levels of evolutionary constraint on nonsynonymous substitutions at disease-associated amino acid sites are intuitive, since these mutations alter the amino acid sequence, and therefore the biochemical properties, of a particular protein (Li et al., Reference Li, Wu and Luo1985). Elevated mean d S at pathogenic sites in RHO and RPE65 may be driven by outlier pathogenic sites with high d S or perhaps interspecific variation in codon usage bias at these sites (Plotkin & Kudla, Reference Plotkin and Kudla2011). The role of synonymous variation in human disease has gained prominence in recent years (e.g., Sauna et al., Reference Sauna, Kimchi-Sarfaty, Ambudkar and Gottesman2007; Sauna & Kimchi-Sarfaty, Reference Sauna and Kimchi-Sarfaty2011), and work on mammalian RHO in particular has identified selection on synonymous sites, likely contributing to mRNA stability and translational efficiency (Du et al., Reference Du, Dungan, Sabouhanian and Chang2014). A broader investigation of many protein-coding gene families also found that genes with synonymous rate variation were overrepresented in genetic diseases (Dimitrieva & Anisimova, Reference Dimitrieva and Anisimova2014). Our finding that d S may be consistently higher in pathogenic sites suggests that future work investigating the role of synonymous rate variation in genes involved in human disease is warranted.
Protein structure, dN/dS, and pathogenicity
Although an examination of specific structural defects in protein function is not readily available with the codon-based models used in this study, incorporating metrics of conservation from multiple methods can be an important first step for future analyses integrating protein structure and amino acid identity into disease site prediction and downstream phenotypic characterization of mutant proteins. For instance, RP-causing mutations in RHO are found throughout the protein, with the majority located within the transmembrane domains. Known pathogenic mutations disrupt protein folding, and several restricted to the C-terminus interfere with protein translocation but proper protein structure is maintained (Mendes et al., Reference Mendes, van der Spuy, Chapple and Cheetham2005). Critical structural sites, such as those that participate in glycosylation and those responsible for correct protein folding, are highly conserved across vertebrates and mutations at these sites invariably result in protein defects (Pope et al., Reference Pope, Eilers, Reeves and Smith2014). Conserved d N/d S estimates mapped onto the RHO crystal structure coincide with these known highly conserved regions, as well as confirmed pathogenic sites. In some cases, however, a pathogenic site may be tolerant of a nonsynonymous substitution to a particular amino acid residue, while the true disease-associated residue differs considerably from the wild type with respect to size or charge. For instance, the A292S substitution in RHO occurs frequently across vertebrates (e.g., Sugawara et al., Reference Sugawara, Imai, Nikaido, Imamoto and Okada2010), while the A292E substitution is not found in vertebrate sequences and is known to cause constitutive activation of RHO (Weitz & Nathans, Reference Weitz and Nathans1992). Moreover, different amino acid substitutions at the same amino acid site in RHO may lead to different clinical disease phenotypes (Neidhardt et al., Reference Neidhardt, Barthelmes, Farahmand, Fleischhauer and Berger2006). In our vertebrate analyses, we found that in both RHO and RPE65 certain pathogenic amino acid sites (including those with functional validation in RHO) exhibited some variability, supporting the use of amino acid characterization methods to determine which residue in particular is deleterious. In these instances, further in silico investigations of the mutation in question could be undertaken with disease prediction methods such as SIFT, PolyPhen, or Provean (Ng & Henikoff, Reference Ng and Henikoff2003; Adzhubei et al., Reference Adzhubei, Schmidt, Peshkin, Ramensky, Gerasimova, Bork, Kondrashov and Sunyaev2010; Flanagan et al., Reference Flanagan, Patch and Ellard2010; Choi et al., Reference Choi, Sims, Murphy, Miller and Chan2012), with additional in vitro characterization to corroborate the mutation.
Intuitively, sites in both RHO and RPE65 showed high evolutionary conservation in structurally important regions, particularly when contrasting the interior with the exterior of the protein. Much like RHO, pathogenic residues in RPE65 are located throughout the protein and their deleterious effects are mediated via a variety of mechanisms (Bereta et al., Reference Bereta, Kiser, Golczak, Sun, Heon, Saperstein and Palczewski2008). In RPE65, amino acid sites associated with isomerase activity, those pointing toward the catalytic interior of the protein (specifically, four highly conserved histidine residues), and those that may mediate membrane association are tightly constrained (Kiser & Palczewski, Reference Kiser and Palczewski2010; Li et al., Reference Li, Hu, Jin, Aiyar, Jacobson, Bok and Jin2015). Recent mutagenesis work has begun to elucidate the importance of these and other disease-associated residues for RPE65 function (Li et al., Reference Li, Izumi, Hu, Jin, Siddiqui, Jacobson, Bok and Jin2014). Since known pathogenic mutations are widespread in the RPE65 structure, rather than localized to a few key regions, further work investigating mutations in vitro will lend valuable insight to its function.
Evolutionary conservation and disease site prediction
The comparative approach used in this study is ideal for visual genes that are known to have many point mutations associated with RP. In some instances, however, only one or two pathogenic mutations in a given visual protein are known, and there are likely other deleterious mutations in such proteins yet to be discovered. Other techniques complementary to the ones employed in this study can be used to elucidate the nature of these mutations. Comparing observed and expected numbers of disease-associated nonsynonymous substitutions across sites in a protein has been used to explore the spectrum of selective constraint across genes (reviewed in Miller & Kumar, Reference Miller and Kumar2001; Kumar et al., Reference Kumar, Dudley, Filipski and Liu2011). For these genes, even a small number of disease sites can be investigated, by testing whether disease mutations occur at highly conserved sites more frequently than expected by chance. An evolutionary prior, or “conservation index” (1 − d N/d S) has also been used to evaluate selective constraint across sites undergoing purifying selection (Burk-Herrick et al., Reference Burk-Herrick, Scally, Amrine-Madsen, Stanhope and Springer2006). In this approach, sites undergoing neutral or positive selection have an index set to 0, generating a spectrum of sites ranging from weak to strong purifying selection, wherein the most highly conserved sites have a conservation index approaching 1. Similar to our expectations for this study, pathogenic sites in the mammalian BRCA1 gene and 10 mammalian auditory genes were found to predominantly occur in regions undergoing strong purifying selection (Burk-Herrick et al., Reference Burk-Herrick, Scally, Amrine-Madsen, Stanhope and Springer2006; Kirwan et al., Reference Kirwan, Bekaert, Commins, Davies, Rossiter and Teeling2013). An additional caveat to the methods used in this study is that missense/nonsense mutations were the sole target of our analyses. In addition to defects in protein structure/function, the role of pre-mRNA splicing mutations in human disease has been documented, including in hereditary visual diseases (e.g., Ueyama et al., Reference Ueyama, Miraki-Oda, Yamade, Tanabe, Yamashita, Shichida and Ogita2012). Extending these existing phylomedicine approaches to incorporate splicing mutations would be a valuable avenue of future study.
Current tools aiming to predict the occurrence of novel disease sites often incorporate structural information for specific amino acids as well as entire proteins (Ng & Henikoff, Reference Ng and Henikoff2003; Adzhubei et al., Reference Adzhubei, Schmidt, Peshkin, Ramensky, Gerasimova, Bork, Kondrashov and Sunyaev2010) and can filter sequence variants that are of potential functional importance. In some cases, these methods may be sensitive to changes in alignment and taxonomic sampling and may not be sufficiently sensitive to resolve ambiguity surrounding particular disease sites (Flanagan et al., Reference Flanagan, Patch and Ellard2010; Hicks et al., Reference Hicks, Wheeler, Plon and Kimmel2011; Castellana et al., Reference Castellana, Rónai and Mazza2015); however, incorporating structural information and amino acid properties is an important aspect of disease prediction that is not explicitly addressed in the molecular evolutionary analyses undertaken here. Statistical estimates of selection obtained from several different molecular evolutionary methods could be integrated into existing techniques that use interspecific alignments to assess the severity of a given mutation (e.g., PolyPhen or SIFT) or complement these alignment-based analyses, improving the ability for interspecific variation to inform studies of human disease and predict deleterious mutations.
Conclusions
With the advancement of high-throughput sequencing technology, rapid and extensive recovery of putative genes and mutations implicated in visual disease is increasingly feasible (Neveling et al., Reference Neveling, Collin, Gilissen, van Huet, Visser, Kwint, Gijsen, Zonneveld, Wieskamp, de Ligt, Siemiatkowska, Hoefsloot, Buckley, Kellner, Branham, den Hollander, Hoischen, Hoyng, Klevering, van den Born, Veltman, Cremers and Scheffer2012). This volume of data, particularly for newly recovered missense mutations, means that further validation of their clinical relevance is necessary. How likely are newly recovered mutations or genes to result in a disease phenotype? In instances where insufficient clinical or sequence information preclude the identification of important amino acid sites, computational approaches drawing on interspecific data found in vertebrate genomes, such as those employed in this study, may serve as an important first step in the characterization of novel genes and mutations. Genes implicated in hereditary visual disease are good candidates for these studies since there are abundant homologous sequence data for many genes, and a strong relationship between genotype and visual degeneration phenotype can be established. In this study, we used several molecular evolutionary methods and interspecific datasets to investigate disease-causing mutations in RHO and RPE65 and found that pathogenic sites in these genes were under significantly stronger evolutionary constraint than nonpathogenic sites. Models of molecular evolution may aid in the identification, prediction, and investigation of point mutations associated with human disease. Moreover, at the codon level, they may reveal patterns of selection not easily recovered with amino acid-based approaches. Current disease prediction methods using homologous sequences and amino acid properties may be complemented by codon-based molecular evolutionary analyses, advancing our understanding of conservation, protein function, and pathogenicity.
Supplementary Data
Supplemental materials can be viewed in this issue of VNS by visiting http://journals.cambridge.org/VNS.
Acknowledgments
This work was supported by an NSERC Discovery Grant and a Foundation for Fighting Blindness seed grant to BSWC, Vision Science Research Fellowships to FEH, RKS, GMC, and AVN, and Ontario Graduate Fellowships to FEH and RKS. Amir Sabouhanian provided valuable feedback on the statistical analyses.