Introduction
It is estimated that of the over 220,000 breast cancers diagnosed in the USA each year, 53% will receive some sort of radiotherapy. Reference Bilani, Zabor and Elson1 The quality of external beam radiotherapy treatment plans for these patients depends on the confidence in accuracy between the reported dose metrics predicted by the treatment planning software and the actual delivered dose. While different, commercially available dose calculation algorithms have been used in external beam treatment planning, non-Monte Carlo-based (MC) algorithms have primarily been used for the creation of 3D breast plans using tangent fields (and/or using the ‘field-in-field’ (FiF) planning technique). This is because of their acceptable accuracy and the historically long calculation times associated with MC. Reference Reynaert, Marck and Schaart2 The standard practice at our institution is to use the collapsed cone (CC) algorithm in the Monaco® (Elekta Solutions AB, Stockholm, Sweden) treatment planning system (TPS) for all breast cancer cases—including two, three and four field—and partial breast irradiation (PBI) plans. However, since processing power has increased, the time needed for accurate MC dose calculations has decreased dramatically, allowing for the MC algorithm to be incorporated into routine clinical with a potential decrease in computation time.
The CC algorithm has been used clinically for over 10 years and is considered appropriate because of its dose accuracy within an acceptable margin. The dose calculated with CC algorithm was confirmed with surface dose measurements using thermoluminescent dosimeters, optically stimulated luminescence dosimeters and metal oxide semiconductor field-effect transistors when necessary. Metrics such as 95% of the target volume receiving 95% of the prescribed dose (V95%) have been historically used to evaluate plan quality. Newer metrics, such as whole breast target V105% (the volume of the target receiving 105% of the prescribed dose), have been introduced to assess dose homogeneity and reduce acute and chronic toxicities, Reference Patel, Ling, Richman and Champ3 such as moist desquamation, tenderness, erythema, burns, etc. Reference Krasin, McCall and King4 While MC is shown to be far more accurate than CC, Reference Hasenbalg, Neuenschwander, Mini and Born5,Reference Knöös, Wieslander and Cozzi6 at our institution, MC has been reserved for intensity-modulated radiation treatment (IMRT) planning. This is because the knowledge and documentation of doses to critical structures is of increased importance for IMRT planning, and therefore, the supposed longer times to perform dose calculations are justified.
Our institution has begun to closely scrutinise specific dose metrics in clinical tangent breast treatment plans, such as target coverage and target V105%, thyroid, lung and heart doses. The need to accurately correlate adverse effects to these metrics and the decrease in calculation time associated with MC have renewed interest in the clinical viability of routinely using the MC algorithm.
Methods
Thirteen clinically treated breast cancer cases were selected from our treatment archive to perform our pilot study. Although the patients were all treated using tangent field geometry, there was variability of breast sizes, prescribed dose levels, geographic treatment locations and attending physicians within the cohort. For 9 of the plans, fields using at least 2 energies were necessary to achieve clinically adequate coverage, but 4 plans were able to achieve coverage using the same field energy. In the initial plan, the breast where the gross disease was located was defined by the physician and contoured using 3D rendering software in the TPS. The glandular breast tissue where the disease was located was expanded to encompass the clinical extension and account for variation in patient positioning and movement, which resulted in the planning target volume (PTV). Finally, the PTV was copied and cropped 0·5cm from the patient surface to create the breast planning target volume evaluation structure (PTVeval). The PTVeval was used to evaluate the plan quality in case the target superficially extended because of an inability of the clinically used photon fields to deposit a clinically accurate dose near the surface of the PTV. 7 All cases were planned using the FiF technique with the CC algorithm in the Monaco® v 5.11.03 TPS. The PTVeval V95%, V100% and V105% were recorded as the percentage of the structure volume, while the PTVevalD95% was recorded as a percentage of the prescribed dose, controlling for the different prescription schemes being used in this study.
Although lung dose (specifically V20) is of interest for tangential breast planning, the decision was made to not include data for the change in this metric because V20 is based on the volume receiving an absolute dose value. The variability of the prescribed dose for patients in the cohort (42·56Gy – 50·4Gy) may prevent the drawing of meaningful conclusions from the data, as well as the use of a breath-hold technique for a subset of the cohort data.
The treatment plans were then copied and forward-calculated using the same monitor units, leaf pattern and beams, but this time with MC, a 3mm grid size and a statistical uncertainty of 3% per control point. The values of the previously mentioned metrics were recorded, and the differences analysed. The time required for calculations using either the CC or MC algorithm was also recorded.
We then compared results shown in the planning software itself to the delivered dose in a clinical setting. To do this, a technique of evaluation called patient-specific QA was necessary. TPSs have an input and an output. The input is a fixed set of parameters (e.g., fractional prescribed dose, field size and shape, beam energy, delivery angle) defined by the user. The output is the visual display and graphical result of the radiation treatment beam calculations based on the input parameters. The patient contour was defined using a computed tomography (CT) dataset with differing grey-level values corresponding to differing tissue densities, which in turn affect the dose deposition via photon beam physics. The dose distribution shown (output) was dependent on the algorithm used for the dose calculation; however, the plan parameters (input) themselves did not change. It was therefore possible to copy the entire treatment plan (input) and calculate the dose (output) onto a measurement device. The CT of the ArcCHECK® (Sun Nuclear Corporation, Melbourne, Florida, USA) QA phantom was imported into the TPS. The dose was then calculated with both the CC and MC algorithms using the original patient plan. Note that the output was different, but the input did not change. This was done for the 4 patients within the cohort that had treatments planned using beams of all the same energy.
The measurement device was then set up on the treatment machine in accordance with the TPS treatment plan, and the plan (input) was delivered and evaluated using SNCPatient®(Sun Nuclear Corporation, Melbourne, Florida, USA) analysis software. The decision to use only mono-energetic plans was made due to the interest in a combined-field cumulative QA pass rate and the necessary dose calibration for the analysis software. This software requires a dose calibration file unique to the energy of the delivered field, so because all sub-fields using the FiF technique were delivered and measured as one acquired dose file, using fields of all the same energy was necessary.
The gamma analysis index is a clinical standard for evaluating dynamic radiation treatment plans, which considers the differences between expected and measured dose values and the distances to agreement of those values. Reference Low, Harms, Mutic and Purdy8 During the delivery, the QA device continuously measured the actual delivered dose, which was compared to the doses predicted in the TPS for both the CC and MC plans and evaluated using gamma index analysis. We initially evaluated each plan using 2%2mm gamma criteria: measured points found to be within 2% of the expected dose value and 2mm of the expected location were considered ‘passing’. Because higher doses were more clinically relevant to our study and practice, doses below a 10% maximum dose threshold were excluded. The total number of passing and failing points above this threshold were evaluated and recorded.
Results
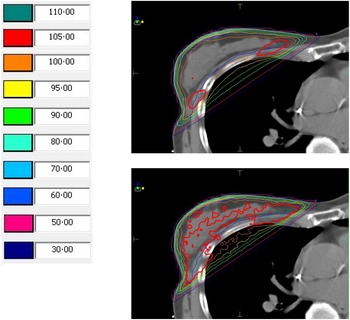
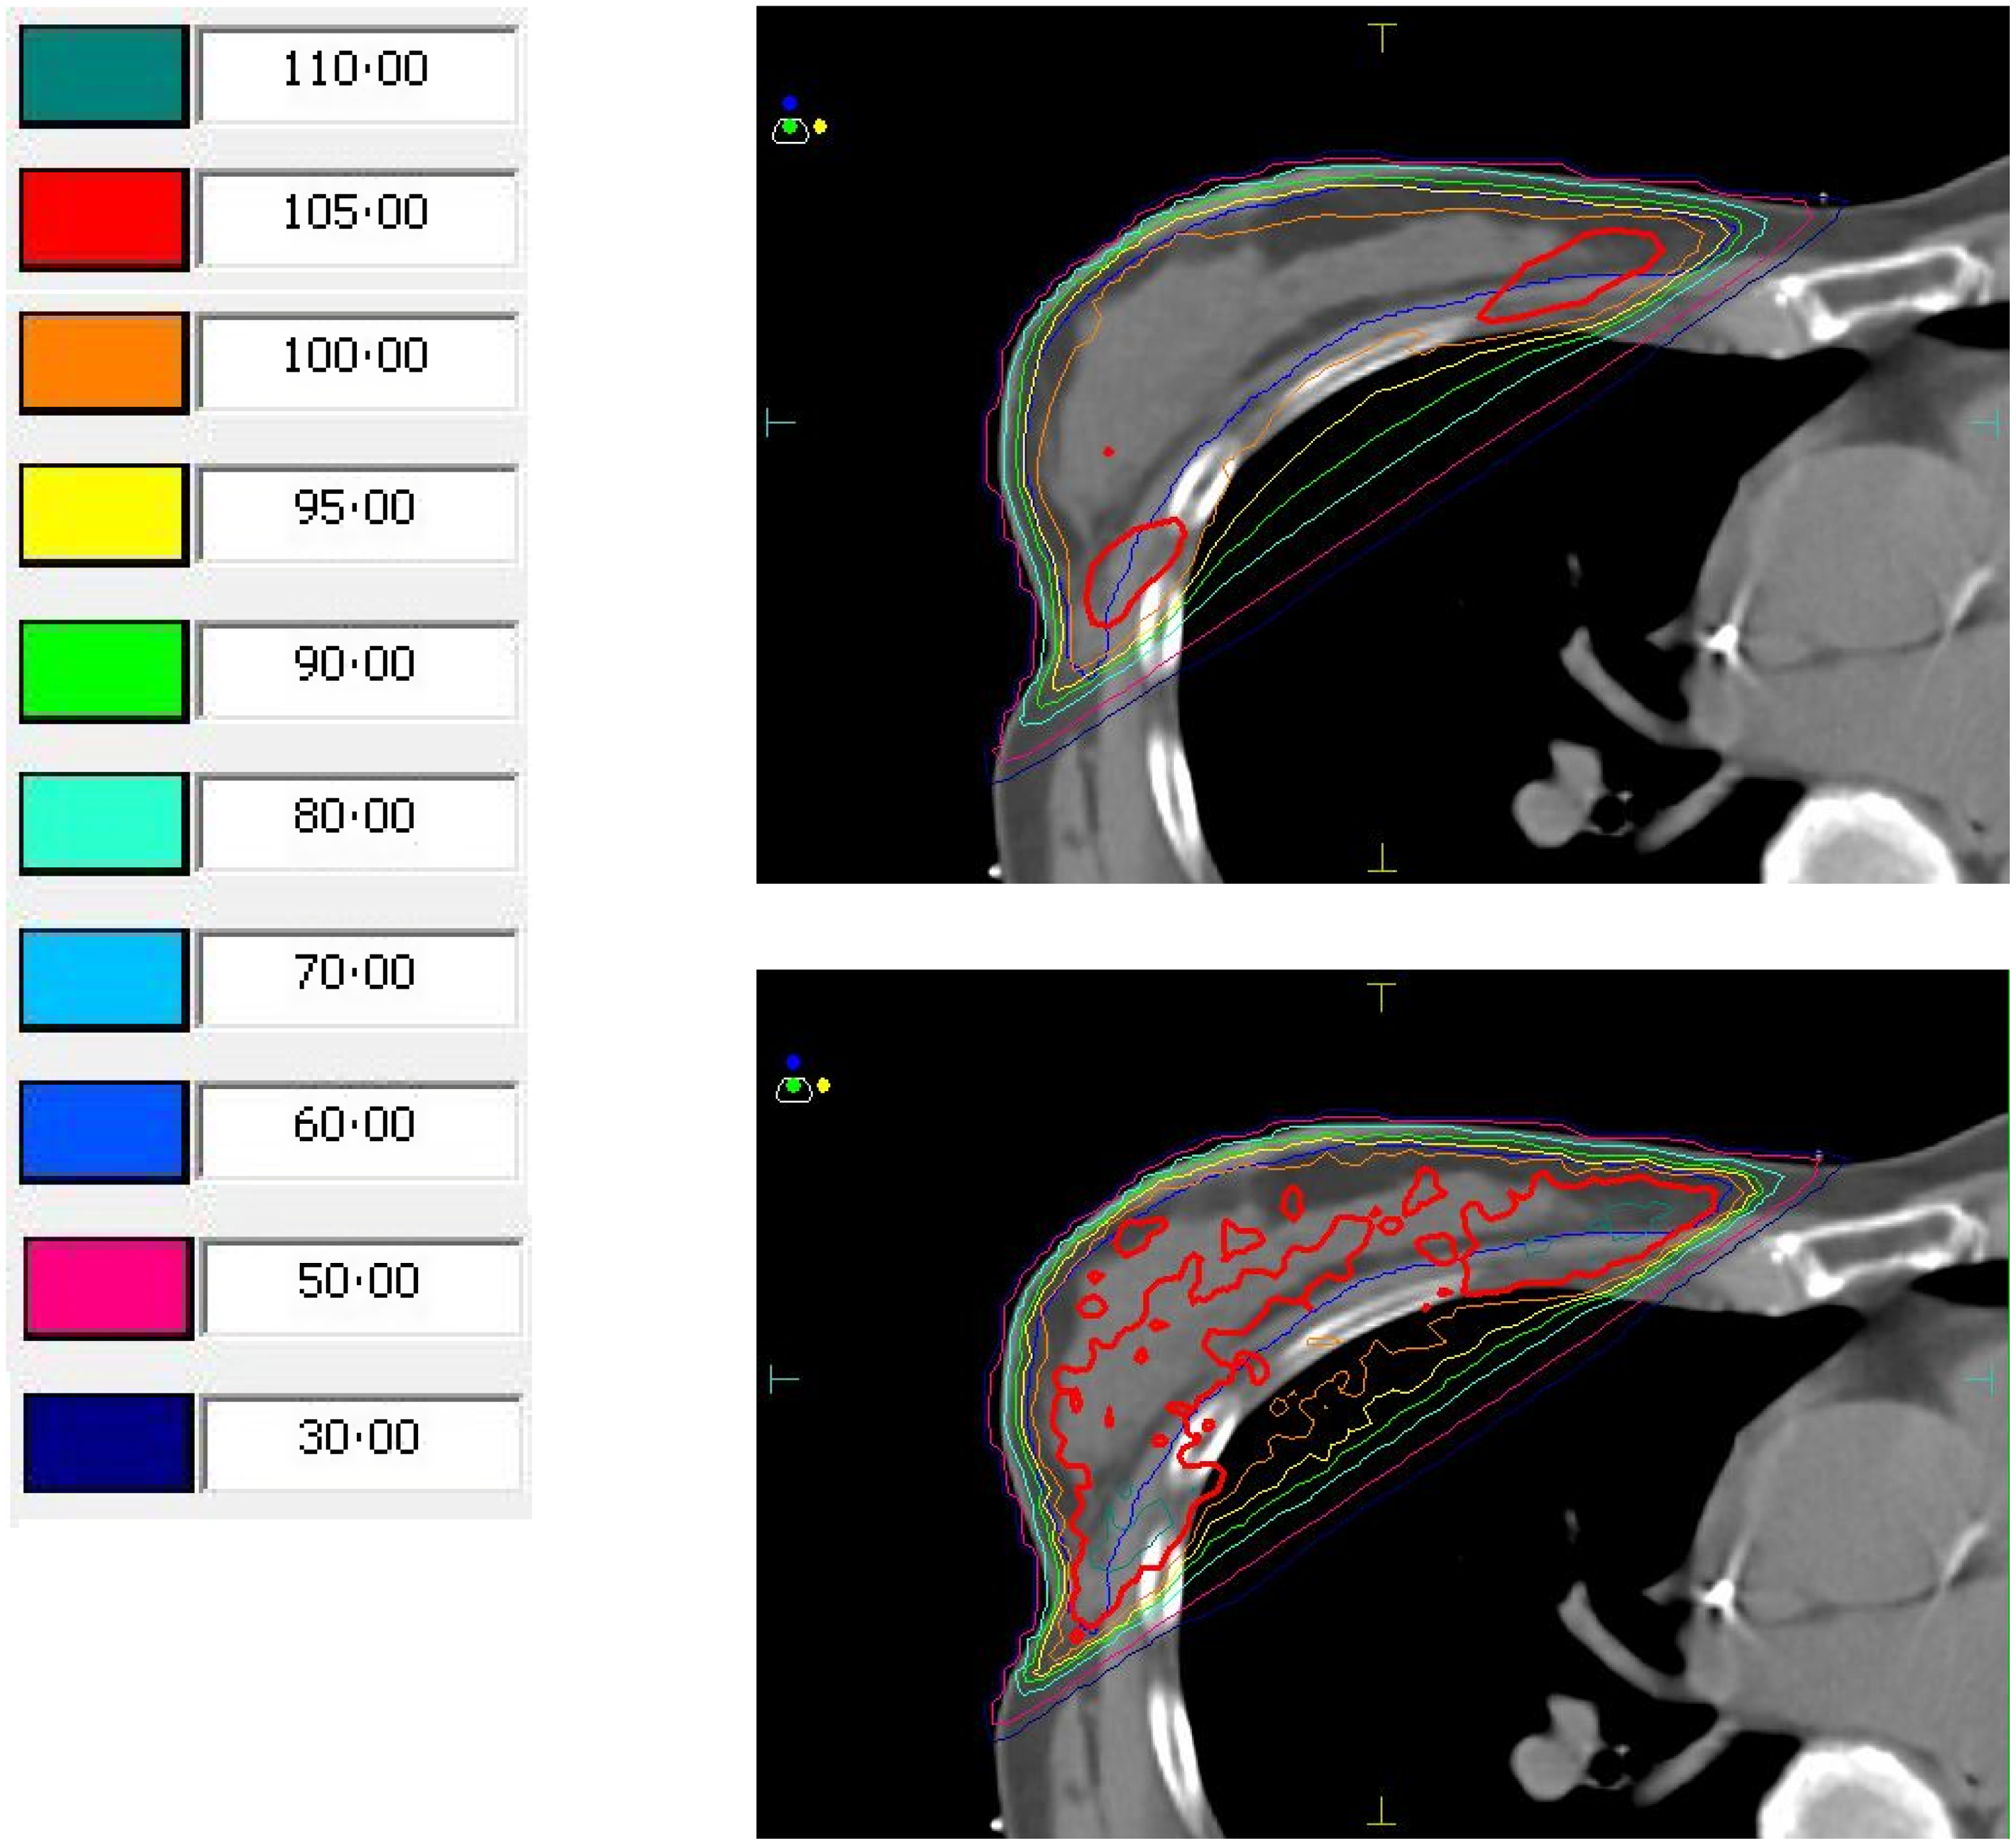
V95 and D95%, on average, showed no increase or decrease when recalculated with MC, but there was a variation of up to 6% for V95 and 3% for D95. The PTVeval V100% showed a slightly higher variation from a decrease of 6% to an increase of 20%, with an average increase of 4%. The considerably higher amount of 105% prescribed dose (shown in red in Figure 1) was apparent when visually inspecting the isodose distribution.
Isodose distributions and relative isodose values for a plan calculated using collapsed cone (CC; top) and the same plan recalculated using Monte Carlo (MC; bottom). Regions in red reflect 105% of the prescribed dose, shown to be much greater than predicted by CC when calculated using MC.
Of the changes in PTVeval V95%, all of those with a change of greater than 1% (−2·35%, 1·14% and 6·41%) corresponded to an absolute change of less than 1cc (0·41cc, 0·89cc and 0·59cc, respectively). The largest difference, corresponding to a 6·41% increase in PTVeval V95% after recalculation with MC, was observed in a case with the lowest overall V95% coverage in the beginning (74·6%). The difference observed for PTVeval V100% was a 4·2% increase and showed a wide variability.
Next, we evaluated the change in PTVevalV105% values for all cases between those calculated with CC and the same plans recalculated with MC. Apart from one case, all plans recalculated with MC showed a relative increase in the value for PTVevalV105% between 73·5% to 593·5%, with an average of 235·7% over all cases (Table 1). The range for V105 was 2·33–33·15 calculated with CC and 15·90–53·21 calculated with MC. The confidence interval was 7·26 to 16·39 for CC and 25·34 to 40·16 for MC.
PTVeval dose metrics (%) for both collapsed cone (CC) and Monte Carlo (MC) plans for each patient

*The D95% values are normalised to 100% of the target volume.
The t-test and p values for PTVeval V95, D95, V100 and V105 are summarised in Table 2. As noted above, we recorded the time to completion for each calculation; our results show that the time to calculate MC plans tends to be lower than that for CC by a factor of 1·75 (Table 3).
T-test values for change in average dose evaluation metrics between the collapsed cone (CC) and Monte Carlo (MC) algorithms

Time for calculation of collapsed cone (CC) and Monte Carlo (MC) plans for 13 patients in seconds (s)

Breast PTVeval and D95% values are normalised to 100% of the target volume (PTVeval D95 (norm))
The values for the CC V105% values, the recalculated MC V105% values and ratio of those values to each other were recorded for each patient against their acute skin toxicity grade. This is summarised in Table 4. Late-effect toxicity was not evaluated due to the reasons cited in Patel. Reference Patel, Ling, Richman and Champ3
Acute skin toxicity grade versus V105 values for collapsed cone (CC) and Monte Carlo (MC).

*PTV Planning target volume.
Finally, the QA pass rate for each of the 4 cases was evaluated using the 2%2mm and 3%3mm gamma criteria outlined above. In each individual case, the passing rate (numbers of points that agreed within a certain dose and distance) increased, with the average 3%3mm pass rate increasing 5·5%. Notably, the average 2%2mm criteria increased by 19·2%, which is clinically important because the 2%2mm criteria is a more rigorous indicator of plan quality than the 3%3mm criteria (Table 5).
Quality assurance (QA) pass rate for collapsed cone (CC) and Monte Carlo (MC) plans using 2%2mm and 3%3mm gamma criteria in 4 patients with treatments planned using beams with the same energy.

Discussion
This study showed that the standard-of-care dose calculation algorithm, CC, is not only clinically inaccurate, but that the metrics derived from the CC algorithm, which are routinely used for judging clinical acceptability, are also inaccurate (The PTVeval V105 is of specific concern, since this value correlates with acute skin toxicity Reference Patel, Ling, Richman and Champ3,Reference Adnani, Beyer, David, Butters, Johnson Axtell and Augustein9 and cosmesis). We demonstrated that by using a more accurate dose calculation algorithm, MC, and measuring the clinically delivered dose. Plans originally thought to be adhering to the PTVeval V105 < 10% guideline actually delivered doses far in excess of this limit. The PTVeval V105 results highlight the need to re-evaluate the fundamental criteria used to determine acceptable plan quality. Despite V105 numbers increasing with the addition of a 3rd or 4th field matched superiorly to the whole breast tangents, 3- and 4-field techniques were not investigated because our associated study by Patel et al Reference Patel, Ling, Richman and Champ3 lacked additional fields. Although other metrics have been used to evaluate V105 using absolute volume, this study used a percent volume in accordance with Patel et al. Reference Patel, Ling, Richman and Champ3
Because this research is intended as a pilot study, the relatively low number of patients in this cohort is acceptable for demonstrating clear trends and the proof of the study concept. The results suggest a follow-up study with a larger cohort is warranted.
Although the differences observed for PTVeval V95% and D95% were less than 0·5% and considered statistically insignificant, these values are often used to normalise target coverage and thus affect metrics of global maximum dose and how much of the intended prescribed dose is treating the disease. Therefore, these doses need to be fully understood and reported appropriately. Additionally, the amount of variation between the CC and MC doses within the same plan metrics suggests a more accurate algorithm is needed regardless of clinical criteria. This agrees with the findings of T Knöös et al., Reference Knöös, Wieslander and Cozzi6 who found that the average PTV doses between CC and MC plans showed less than 1% variability at lower energies and up to 1·2% variability for 15/18MV beams.
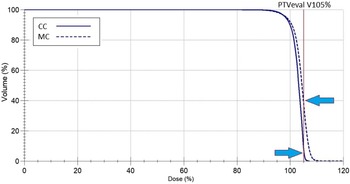
The average increase in dose to PTVeval V105% can be explained by examining the dose-volume histogram curve for the PTVeval itself. A point at 105% of the prescribed dose may fall on an area of this curve with a very steep gradient, meaning that a marginal increase in dose may lead to a substantial increase in the volume of tissue receiving that dose (Figure 2).
Dose-volume histogram (DVH) for a plan calculated using collapsed cone (CC) and the same plan recalculated using Monte Carlo (MC). Note the lower arrow representing the volume receiving 105% of the prescribed dose when calculated with CC, and the higher arrow representing the volume receiving 105% of the prescribed dose when recalculated with MC. The MC plans that implement a small increase in dose increase the volume receiving those doses more than the CC plans that implement a small increase in dose. (Arrows were added with MS Paint software.).

When comparing acute skin toxicity grade versus initial MC V105% values, we found no correlation between acute toxicity grade and change in V105% after recalculation with MC. This is expected, given the attempted adherence to the V105% <10% criteria in the original (CC) plan and the understanding that this original V105 criteria was based on doses originally calculated with non-statistical algorithms.
The consistently higher QA pass rate for mono-energetic plans within this study shows that the clinically delivered dose distribution more accurately represents that of the plan calculated with the MC algorithm than that calculated with CC. This is true even when more rigorous acceptability criteria are applied (2%2mm) than those required by our institutional clinical standard for dynamic plans (3%3mm). The relatively low passing rates using these criteria may be due to the heterogeneity in the lower-density lung tissue, the higher density in the ribs and the transition at the lung-chest wall interface.
While using MC for all breast plans is tempting because of its accuracy and shorter time to calculation, there are practical barriers to adopting this practice. For example, plans created using a PBI technique frequently use wedges which are currently incompatible with the Monaco MC algorithm. This will be corrected in future versions of this software, but in the meantime, recommendations to use MC may be limited to tangent plans only. Also, the availability of photon MC as a standard algorithm with a given treatment planning software is still limited to Monaco® (Elekta, Stockholm, Sweden) and RayStation® (RaySearch Laboratories, Stockholm, Sweden). In addition, because V105% is often used as a benchmark for the acceptability of plan quality and may correlate with higher incidents of grades 2 and 3 skin toxicity; Reference Low, Harms, Mutic and Purdy8 more investigation is needed to validate or make any formal recommendations that MC be used in all tangential breast cases. One important area of interest is determining if this trend is consistent while decreasing the statistical uncertainty of the calculation. Until then, the FiF planning technique can be used.
The goal of this dosimetric evaluation study was to show that although the endpoint of acceptable toxicity was achieved with a V105% of <10% for target volumes for tangential breast plans created with CC, the actual value of V105 was considerably higher when measured with a more accurate algorithm. We do not expect higher toxicities in cases planned this way; the intent is to demonstrate that a higher acceptable V105% value may be advisable when evaluating plans that are created using MC and even necessary to achieve the same levels of toxicity in a given patient.
Conclusion
Our pilot study showed that the volume of breast tissue receiving 105% of the prescribed dose in tangential breast plans created using the CC algorithm is significantly higher when recalculated with a more accurate algorithm (MC). Because V105% has routinely been used to evaluate the clinical quality of tangential breast plans and as a metric correlating with treatment-related complications such as lymphedema, swelling, tenderness and skin toxicity, 10 our results may lead to the ability to further reduce the incidence of these adverse effects. Because this metric is often used as a benchmark for acceptability of plan quality and a predictor of toxicity, the values accepted may need to be revisited and redefined using MC-based calculations. Lower calculation times and higher QA pass rates when using MC indicate the possibility of a shift in the paradigm for planning breast cancer treatment cases. Further study is needed to investigate the relationship between the severities (grade) of these effects with a potentially more accurate measure of the PTVeval V105%.
Acknowledgements
Special thanks to Jason Sohn, PhD and Lori Slack, CMD for scheduling and resource support. The authors thank Sarah Carey, MS, Jade Chang, and Jacalyn Newman, PhD, of Allegheny Health Network’s Health System Publication Support Office (HSPSO) for their assistance in editing and formatting the manuscript. The HSPSO is funded by Highmark Health (Pittsburgh, PA, USA) and all work was done in accordance with Good Publication Practice (GPP3) guidelines (http://www.ismpp.org/gpp3).
Financial Support
This research received no specific grant from any funding agency, commercial, or not-for-profit sectors.
Conflict of Interest
The authors have no conflicts of interest to disclose.