While the difference in auditory perception is highly salient when comparing deaf and hearing readers, the two groups also experience the visual environment differently in ways that may affect reading processes. When visual information is in the periphery, deaf individuals outperform hearing individuals in a variety of tasks, (e.g., Bosworth & Dobkins, Reference Bosworth and Dobkins2002; Dye, Baril, & Bavelier, Reference Dye, Baril and Bavelier2007; Parasnis & Samar, Reference Parasnis and Samar1985; Seymour et al., Reference Seymour, Low, Maclin, Chiarelli, Mathewson, Fabiani and Dye2017). Parasnis and Samar conducted a timed visual target detection task, where the targets were in parafoveal vision. In some conditions distracting, task-irrelevant visual information was presented in the fovea. Deaf participants showed greater ability to reorient attention to the parafovea in the face of distracting centrally presented stimuli. Bosworth and Dobkins similarly found that deaf participants were better able to detect peripheral visual motion in the face of central distractors. They also found that deaf participants had greater ability to orient attention toward the periphery in response to a prior cue, in that they showed lower thresholds for detecting visual motion when valid cues were presented compared to hearing participants. Seymour et al. employed a similar useful field of vision task, in which participants identified a centrally presented stimulus and the location of a peripherally presented stimulus in the presence of distracting visual information. As in the Bosworth and Dobkins study, deaf participants had lower thresholds for locating peripherally presented targets in the useful filed of vision task. Dye et al. conducted a flanker task, where a central target arrow was presented along with peripheral arrows that either pointed in the same direction or in the opposite directions. Participants pressed a key that indicated in which direction the arrow pointed. Typically, participants responded slower when the flankers pointed in the opposite direction from the target (incongruent flankers). The study showed that deaf participants were more affected by incongruent flankers in the periphery than were hearing participants.
Enhanced performance by deaf individuals on some visual tasks seems to be driven by an increased ability to allocate visual attention to peripheral space (e.g., Bavelier et al., Reference Bavelier, Tomann, Hutton, Mitchell, Corina, Liu and Neville2000; Bosworth, Petrich, & Dobkins, Reference Bosworth, Petrich and Dobkins2013; Neville & Lawson, Reference Neville and Lawson1987). Redistribution of attention toward the periphery may offset the absence of auditory cues in target detection (Bavelier, Dye, & Hauser, Reference Bavelier, Dye and Hauser2006). Note that the full scope of the interaction between auditory deprivation and visual perception is likely more complicated (see Samar & Berger, Reference Samar and Berger2017). Nonetheless, deafness appears to affect visual attention in ways that confer an advantage relative to hearing individuals for stimuli outside of the fovea.
It is still unclear how, or to what extent, differences in the allocation of visual attention may affect reading in deaf and hearing individuals. One possibility is that deaf individuals’ perceptual spans differ from their hearing peers (Belanger & Rayner, Reference Belanger and Rayner2015). Perceptual span is the area of visual space around a fixation from which useful information can be gleaned. For English, the perceptual span is asymmetrical, spanning from roughly 3–4 characters to the left of fixation to 14–15 characters to the right of fixation (reviewed in Rayner Reference Rayner2009). This asymmetry is reversed for languages that are read from right to left, such as Hebrew (Pollatsek, Bolozky, Well, & Rayner, Reference Pollatsek, Bolozky, Well and Rayner1981), providing evidence that the shape of the perceptual span is developed through the practice of reading. Note that the change in the perceptual span in skilled readers of two scripts happens immediately when they change scripts. Pollatsek et al. interpret this result as implicating attention as the cause. Learning Hebrew first does not seem to affect the shape of the perceptual span when native Hebrew speakers are reading English. In addition, the size of the perceptual span decreases as the difficulty of foveal processing increases (Henderson & Ferreira, Reference Henderson and Ferreira1990), further suggesting that perceptual span is subject to attentional constraints. Thus, attention and perceptual span are related such that the extent of the perceptual span is determined by attentional demands placed on the reading system.
Given the evidence that deaf individuals have relatively greater sensitivity to peripheral visual information and that attentional capabilities play a role in this effect, one might expect deaf readers to have larger perceptual spans than hearing readers. However, it should be noted that the stimuli for which deaf individuals show a processing advantage are usually presented at much greater eccentricities than the extent of a typical reader’s perceptual span. Nonetheless, Belanger and colleagues have shown using the moving window paradigm that deaf adults do have larger perceptual spans during reading than hearing readers (Belanger, Slattery, Mayberry, & Rayner, Reference Bélanger, Slattery, Mayberry and Rayner2012), and this increased perceptual span was present for both less proficient and more skilled deaf readers (Belanger, Mayberry, & Rayner, Reference Bélanger, Mayberry and Rayner2013). Belanger and colleagues report that less skilled deaf readers’ perceptual spans are as large as more skilled hearing readers’ spans. They have also shown that this increased span is present in 7- to 15-year-old deaf children (Belanger, Lee, & Schotter, Reference Belanger, Lee and Schotter2018), complementing earlier results suggesting that the enhanced peripheral attention capabilities of deaf individuals develop at least this early (Dye, Hauser, & Bavelier, Reference Dye, Hauser and Bavelier2009).Footnote 1
This larger perceptual span is hypothesized to affect reading behavior. For example, one study demonstrated that deaf readers are affected by syntactic cues while fixating on words to the left of words carrying those syntactic cues (Anible et al., Reference Anible, Twitchell, Waters, Dussias, Piñar and Morford2015). By contrast, hearing readers react to the syntactic cues only after fixating directly on the words that carry those cues. These results indicated that deaf readers were better able to use parafoveal information to guide reading behavior. In general, a larger perceptual span might allow readers to skip words more frequently, as they would be more likely to identify words during prior fixations. This pattern has been reported by Belanger et al. (Reference Bélanger, Slattery, Mayberry and Rayner2012), and on the basis of that pattern they formulated the word processing efficiency hypothesis. According to the word processing efficiency hypothesis, deaf individuals are more efficient readers than their hearing peers, in the sense that they can read accurately while making fewer and shorter fixations (Belanger & Rayner, Reference Belanger and Rayner2015). This could be attributed to a stronger connection between a word’s orthographic and semantic representations (as in the direct route account of semantic activation from print; Coltheart, Rastle, Perry, Langdon, & Ziegler, Reference Coltheart, Rastle, Perry, Langdon and Ziegler2001; see also Zevin & Seidenberg, Reference Zevin and Seidenberg2006), but likely also involves differences in the visual abilities of deaf readers, perhaps due to differences in how they allocate visual attention. The logic flows from models of reading in which fixating characters in print leads to the activation of both stored phonological (sound) and semantic (meaning) codes, with either route being capable of triggering access to syntactic and semantic information associated with individual words. Hypothetically, if one could more quickly and more rapidly access meaning (and syntactic) information from print, or if one could extract and process more visual information during a given fixation, this would allow a reader to gain the same understanding of a text with fewer and shorter fixations. Briefly, Belanger posits two factors that could contribute independently or jointly to efficiency, a larger perceptual span and more rapid activation of stored lexical representations from visual information (print).
Alternatively, differences in reading strategies might contribute to different outcomes in deaf and hearing readers. When readers adopt different reading strategies, their eye-movement and fixation patterns change. For instance, research with hearing participants suggests that readers may skip more often if they are processing information to a lesser depth (Rayner & Pollatsek, Reference Rayner and Pollatsek1989). Readers who skim texts are typically only able to answer comprehension questions about the details of a passage that they have directly fixated, but a representation of gist information can be generated even when only a small proportion of the text is fixated directly (Rayner, Reference Rayner1978). Hence, increased skipping among deaf readers may come at the cost of comprehension. Although prior studies reporting increased skip rates have suggested that this is not the case (e.g., Belanger et al., Reference Bélanger, Slattery, Mayberry and Rayner2012), comprehension rates are not often directly analyzed.
The current study further investigates how reading behavior differs between hearing and deaf individuals. Different implemented models of eye movement control make different claims with regard to the precise details of information uptake and decision processes during reading (see, e.g., Engbert, Nuthmann, Richter, & Kliegl, Reference Engbert, Nuthmann, Richter and Kliegl2005; Rayner, Reichle, & Pollatsek, Reference Rayner, Reichle and Pollatsek2010). Cognitive control models posit that eye-movement behavior is directly linked to ongoing cognitive processing during reading. As a result, the processes involved in word identification, syntactic parsing, and semantic interpretation can affect patterns of eye movements. By contrast, oculomotor accounts assume no or minimal influence of cognitive or linguistic processes on eye movements during reading. Examining aspects of eye movements for deaf readers can help us determine whether greater skipping rates lead to a decoupling of eye movements from interpretive processing (as posited by oculomotor accounts), or whether eye-movement behavior remains under cognitive control (i.e., influenced by linguistic/interpretive processes). If eye movements are carried out independent of language interpretation processes, language (linguistic) variables will not be correlated with patterns of fixations and saccades.
Interpreting patterns of eye movements during reading depends on the model of eye-movement control that one adopts. Although we did not design the study to test general models of eye-movement control like E-Z Reader and Swift, a quick overview can help explain the focus on word-skipping behavior as an indicator of perceptual span (Engbert et al., Reference Engbert, Nuthmann, Richter and Kliegl2005; Rayner & Pollatsek, Reference Rayner and Pollatsek1989). As readers process text, their eye movements are characterized by stable fixations of about 250 to 400 ms followed by rapid eye movements called saccades. Normative models of eye movement control indicate that readers typically fixate about 85% of content words and about 35% of function words during a first pass through a text (some of these words will be fixated on a second or subsequent pass; Rayner, Reference Rayner1998). Readers will skip a word when enough visual information has been extracted on a prior fixation (in English, a fixation to the left of the word in question) so that the word can be identified without a direct fixation. At a finer grain, the E-Z reader model assumes that readers process one word at a time. When a fixated word has been identified, attention is (covertly) shifted to the next word in the string. If enough visual information is extracted during that covert attention period, the saccade planning mechanism will target a landing position for the saccade beyond the word that will end up being skipped. For our purposes, a finding of greater skipping in deaf readers would indicate that they are extracting more visual information more quickly from words that they are not directly fixating. According to E-Z reader, greater skipping should happen if deaf readers have a larger perceptual span (as per Belanger and colleagues’ findings) or if they are more efficient at extracting and using parafoveal visual information and therefore are more likely to identify a word to the right of the fixation.Footnote 2
Prior studies comparing reading behaviors of deaf and hearing subjects typically use hearing native English speakers as the sole comparison group for deaf readers (e.g., Belanger & Rayner, Reference Belanger and Rayner2015; Belanger et al., Reference Bélanger, Slattery, Mayberry and Rayner2012). While some variables such as reading skill can be controlled across groups, using native English speakers as the hearing comparison group complicates the interpretation of results. Observed differences in behavior across groups may be attributable to reading in a first versus second or nondominant language (e.g., Frenck-Mestre, Reference Frenck-Mestre2005). Thus, it is beneficial for research comparing reading behavior between deaf and hearing individuals to include a bilingual hearing comparison group. In this study, we included a hearing Chinese–English bilingual group as well as a native English group. To our knowledge, this is the first eye-tracking study of deaf readers that has included a hearing bilingual comparison group. Moreover, we assessed how individual characteristics in intelligence, vocabulary skills, and reading experience related to each other within the three groups.
In addition, this study gathered information as to which factors may guide skipping behavior by examining the degree to which the different groups of readers responded to lexical frequency information. Higher frequency words are easier to identify than lower frequency words and this has been shown to affect many measures of word processing (Rayner & Pollatsek, Reference Rayner and Pollatsek1989; White, Reference White2008). Of interest to the current study, frequent words are skipped more often than infrequent words (Rayner, Reichle, Stroud, Williams, & Pollatsek, Reference Rayner, Reichle, Stroud, Williams and Pollatsek2006), likely because high frequency words can be identified more rapidly from parafoveal information before a saccade is executed to fixate that word. Given the word processing efficiency hypothesis, deaf readers may show increased sensitivity to parafoveal word frequency information and better use this information to skip higher frequency words.
The two experiments reported below were designed to answer the following research questions: (a) How does deaf readers’ skipping behavior while reading sentences compare to native English readers and Chinese–English bilinguals? (b) To the extent that groups differ from one another in overall skip rate, can that be explained by group differences in nonverbal IQ, reading experience, and/or English vocabulary knowledge? (c) Are deaf readers’ eye movements compatible with between-group differences in sensitivity to linguistic variables (e.g., word frequency) or differences in reading strategy?
Hypotheses and Predictions
The main hypothesis tested in this study could be expressed as follows: deaf readers have larger perceptual spans than hearing readers. (a) Given prior results in studies that investigated perceptual spans in hearing and deaf readers, we predicted that deaf readers would skip parts of sentences more frequently than hearing readers. (b) If skipping behavior is truly driven by perceptual processing (larger perceptual spans), group membership (deaf vs. hearing bilingual vs. native English) should account for unique variance over and above the variability that is captured by individual difference variables. (c) If deaf readers have larger perceptual spans, and this accounts for greater skipping rates, eye movements in deaf readers should be predictable from linguistic variables in texts, such as lexical frequency. If deaf readers skip more because they adopt “riskier” reading strategies or merely “skim” texts for gist, then linguistic variables should correlate more weakly with skipping or fixation times in deaf readers than in the other two groups.
Experiment 1
Experiment 1 evaluated deaf, native English, and Chinese–English bilingual readers’ eye movements to a set of semantically unrelated sentences. The test sentences were drawn from a separate study of syntactic effects on reading behavior. Our main measures of interest were proportion of regions skipped and comprehension performance. We also analyzed how word frequency affected skip rates and first-pass fixation times. According to the word processing efficiency hypothesis, we should see fewer fixations (more skipping) and shorter fixations within the deaf readers than the other two groups, without substantial loss of comprehension. In addition, if deaf readers are using similar reading strategies to determine which words to skip, we should see a similar effect of word frequency across groups.
Method
Participants
A sample of 48 native English speakers from the University of California at Davis (UC Davis), 48 Chinese–English bilinguals from UC Davis, and 80 deaf individuals from Gallaudet University participated in this experiment. One native English speaker was excluded from the analysis due to high degrees of missing data. UC Davis students received course credit in return for their participation. Gallaudet University students received $25 in cash as compensation. Summary statistics for the participants appear in Table 1.
Experiment 1 means and standard deviations for Nelson–Denny vocabulary, author recognition, KBIT test scores, gender, and age by group (standard deviations appear in parentheses)

The deaf readers had a hearing loss of 85 db or greater, were born deaf (72 of the 80 participants), or became deaf before the age of 3. They acquired American Sign Language (ASL) as their main communication mode starting at birth (40 participants), between 0 and 2 years old (14 participants), and between 2 and 6 years old (26 participants). We did not include deaf readers with cochlear implants. The ages of the deaf participants ranged from 18 to 44 months.
The Chinese–English bilinguals learned English as a second language. These hearing bilingual readers served as a comparison group, which enables us to better differentiate between effects of being deaf and effects of reading in a second language. Observed differences in performance between deaf readers and native English readers could be due to differences in age of exposure to English, hearing ability, or both. Differences based on age-of-onset of second-language learning have been documented, even when second-language exposure occurs very early in development (e.g., Weber-Fox & Neville, Reference Weber-Fox and Neville1996). Because deaf readers and Chinese–English readers are both operating in a nonnative language, observed differences in outcomes may not be attributed to one group operating in a first language and the other in a second.
Chinese–English bilinguals also offer an interesting contrast to the native English comparison group by virtue of reading a logographic script, one in which there are no clear mappings between individual characters and individual phonemes, unlike English, which is an alphabetic script. Thus, our hearing bilinguals, like our deaf readers, have little or no experience with alphabetic script before learning to read English. At UC Davis, about 4% of Chinese–English bilinguals begin to learn English before the age of 5 (Cates, Traxler, & Corina, Reference Cates, Traxler and Corina2020). With the Chinese–English comparison group we can infer that differences found between the deaf and native English readers were not just effects of differing first-language experience. The ages of the Chinese–English (hearing) bilingual readers ranged from 18 to 34. The ages of the native English readers ranged from 18 to 23.
Individual difference measures
To further aid between-group comparisons, we measured three types of individual differences: nonverbal intelligence, English vocabulary, and experience reading English. The Kaufman Brief Intelligence Test (KBIT) was used to assess nonverbal intelligence of the participants (Kaufman, Reference Kaufman1990). Nonverbal intelligence has been shown to correlate with comprehension outcomes, although other literacy skills can account for additional variance (e.g., Oakhill, Cain, & Bryant, Reference Oakhill, Cain and Bryant2003). The KBIT is a visual matrices test. Participants view an array of visual stimuli and choose from a set of options which additional stimulus best completes the set. The Nelson–Denny vocabulary test was used to assess the vocabulary of the participants (Brown, Foshco, & Hanna, 1983). The vocabulary test has 80 multiple-choice items. A given word is paired with four possible meanings. Test participants choose the correct meaning from the four options. Each participant receives a score of 0 to 80, depending on how many correct responses they produce. An author recognition test was administered as a way of assessing English reading experience (Stanovich & West, Reference Stanovich and West1989). The author recognition test consists of a list of 50 names, half of which are actual famous authors and half of which are not. Participants respond by circling the names of actual famous authors. Participants’ scores are the sum of correctly identified authors minus the sum of nonfamous names incorrectly categorized as authors. Prior studies of literacy skill differences in college-aged readers have used these two measures of reading ability/reading experience (Chateau & Jared, Reference Chateau and Jared2000; Jared, Levy, & Rayner, Reference Jared, Levy and Rayner1999; Unsworth & Pexman, Reference Unsworth and Pexman2003).
Sentence stimuli
Sentences used in this experiment were taken from a separate study that evaluated how deaf readers respond to syntactic ambiguity. The 84 sentences chosen to analyze for skip rate were selected due to their syntactic form. The interest areas for each sentence were drawn based on syntactic constituents (consisting of one or more words), allowing the comparison of the same interest areas across sentences. The syntactic constituents of each interest area were ordered within each sentence so that, for example, Interest Area 5 contained similar syntactic constituents in sentence one as in Sentence 2. The sentences were divided into interest areas in a way that was comparable to prior studies of the same types of sentences (Traxler & Pickering, Reference Traxler and Pickering1996; Traxler, Pickering, & Clifton, Reference Traxler, Pickering and Clifton1998). Here is an example of one of the sentences separated into interest areas: “The tomatoes/near/the melon/that/ripen/in the/sun improved the garden.” In this case, number cues indicate that the relative clause should attach to the first noun tomatoes, rather than the second noun melon (see, e.g., Traxler et al., Reference Traxler, Pickering and Clifton1998). Note that the sentences were displayed to participants without the “/” marks.
Apparatus and procedure
At UC Davis and Gallaudet University, an Sentence Repetition Research EyeLink 1000 Plus eye tracker was used to monitor participants’ gaze locations to within a single character. Participants were given instructions on eye-tracking procedures, but remained blind to the specific aims of the experiment. In all of the experiments, eye movements were monitored from the right eye, with a sampling rate of 1000 Hz. At the beginning of each session, the eye tracker was calibrated using a 9-point grid, and tracker accuracy was monitored throughout the experiment. Recalibrations were performed whenever calibration error exceeded 0.3 degrees of visual angle. Sentences were presented on a Viewsonic P220f monitor with a resolution of 1024 × 768 and a refresh rate of 132 Hz. Participants were seated approximately 80 cm from the monitor, and their heads were stabilized using a chin and forehead rest. At this viewing distance, three characters corresponded to approximately 1 degree of visual angle. All sentences were presented on a single line in Consolas font. During the experiment, participants were asked to read each sentence carefully for comprehension, and press a button once they had finished each sentence. On about one-quarter of the trials, participants answered a comprehension question about the preceding sentence.
Data analysis
We used the R package lme4 for most of the analyses (Bates, Maechler, Bolker, & Walker, Reference Bates, Maechler, Bolker, Walker, Christensen, Singmann and Bolker2015; R Core Team, 2017). The glmer() function was used for logistic mixed effects regression models and the lmer() function was used for mixed effects regression. The anova() function was used for log-likelihood ratio tests (LRTs) between full and reduced models. For data without random effects, the lm() function was used to run multiple regressions and the Anova() function from the car package (Fox & Weisberg, Reference Fox and Weisberg2011) was used to conduct type-2 analyses of variance (ANOVAs) on these models. Differences between the groups in regard to individual difference measures were analyzed using one-way ANOVAs on each of the measures, and the relationships between the measures per group were analyzed using multiple regression.
Mixed-effects models account for the dependencies due to the influence of unit characteristics in the data by allowing each individual to have their own estimated trajectory (Baayen, Reference Baayen2008; Baayen, Davidson, & Bates, Reference Baayen, Davidson and Bates2008). Inappropriate application of common statistical methods (e.g., ANOVA and ordinary least-squares regression) to clustered data can lead to underestimated standard errors, resulting in an increased risk of a type I error (Aarts, Verhage, Veenvliet, Dolan, & Slius, Reference Aarts, Verhage, Veenvliet, Dolan and Sluis2014). Our data had a cross-classified random effect structure with all data being nested in both subject and experimental item (sentence). To address this, all mixed models had random intercepts for subjects and items. Further, by-subject random slopes (uncorrelated with the random intercept) were included for any fixed effect for which it would be permissible. In the case of convergence failures, models were refit with different optimizers, and if convergence problems persisted, the random slope was removed from the model. The exclusion of the random slope was rare and limited to a few follow-up analyses, which used smaller amounts of data.
Initial logistic regression analyses predicted skipping from group (deaf ASL–English bilinguals vs. native English monolinguals vs. Chinese–English bilinguals) and interest area. Multiple regression analyses predicted subjects’ comprehension accuracy from group and average skip rate. Follow-up analyses were conducted to gain further information about what factors might explain the observed differences between the skipping patterns of the three groups. Further analyses investigated frequency effects on skipping behavior and first-pass fixation duration. We chose Region 5 for this analysis because it contained a single content-word, occurred in the middle of the sentence, and had sufficient variability in lexical frequency (0.1 to 544.78 uses per million; M = 49.56, SD = 93.70; based on the SUBTLEX database; van Heuven, Mondera, Keuleers, & Brysbaert, Reference van Heuven, Mandera, Keuleers and Brysbaert2014).
Results and Discussion of Experiment 1
Vocabulary
A one-way ANOVA compared the vocabulary test scores of deaf readers, hearing Chinese–English bilingual readers, and native English readers. Results showed a significant effect of group, F (2, 172) = 34.43, p < .001, MSE = 182.25. On average, native English readers scored significantly higher on the vocabulary test than both deaf readers (p < .001) and Chinese–English bilingual readers (p < .001); and deaf readers scored significantly higher than Chinese–English bilingual readers (p = .044).
Author recognition test
An ANOVA compared the author and magazine recognition test scores of deaf readers, hearing Chinese–English bilingual readers, and native English readers. Results showed a significant effect of group, F (2, 172) = 17.52, MSE = 90.52, p < .001. On average, Chinese–English bilingual readers scored significantly lower than both deaf readers (p < .001) and native English readers (p < .001). The difference between the means of deaf and native English readers was not significant.
KBIT
An ANOVA compared the nonverbal intelligence of deaf readers, hearing Chinese–English bilingual readers, and native English readers. Results showed a significant effect of group, F (2, 172) = 5.45, MSE = 16.01, p = .005. On average, Chinese–English bilingual readers scored significantly higher than deaf readers (p = .0035). The difference between the means of deaf and native English readers was not significant, nor was the difference between the means of Chinese–English bilingual and native English readers.
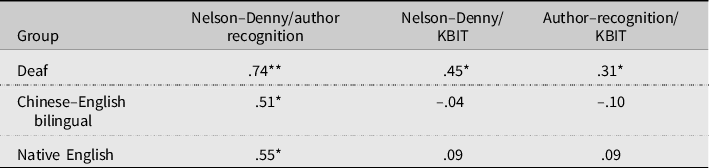
As shown in Table 2, different patterns of correlations between the individual difference measures appeared in the three groups of readers. In the two hearing groups (Chinese–English bilingual and native English readers), the two language experience measures (Nelson–Denny and author recognition) correlated at a moderate level (r ~ .5), but neither test correlated with the KBIT performance IQ measure. A different pattern emerged in the deaf readers. Here, all three measures correlated significantly (p < .05). As in the hearing readers, the two language experience measures correlated with one another. In addition, the two language experience measures correlated with the KBIT scores among the deaf readers. Thus, nonverbal cognitive and verbal ability scores correlated among the deaf readers, but verbal and visual ability test scores did not correlate among the hearing native English and bilingual participants. While some caution is warranted in interpreting these outcomes, it makes intuitive sense that deaf readers, who are operating more intensively in the visual domain, would show a closer association between visuospatial skill and other aspects of performance.
Pearson r values for Nelson–Denny vocabulary, author recognition, and KBIT test scores by group

*p < .01. **p < .001.
Skip rate
A scoring region was considered to be skipped if a following region was fixated prior to a fixation on the scoring region, or if the scoring region was not fixated at all during the trial. A series of logistic generalized linear mixed effects regression (GLMER) models were fit to predict interest area skipping behavior from group (deaf, Chinese–English bilingual, native English, and with native English speakers as the reference group), interest area (Areas 2 through 6), and the interaction between these two factors. We excluded the first and last regions of the sentence (Regions 1 and 7) in the analysis of skipping behavior. A trial could not begin without a fixation on the first region, and Region 7 was sentence-final, which complicates interpretation of skipping behavior (e.g., Green, Mitchell, & Hammond, Reference Green, Mitchell and Hammond1981), and skip rates in Region 7 were relatively low in all groups.
The first GLMER model we fit (the full model) predicted interest area skipping (0 = fixate, 1 = skip) as a function of group, interest area, and their interaction. Both group and interest area were categorical with 2 and 4 levels, respectively, meaning there were 8 interactions. We then fit a reduced model without group and no interaction, meaning that interest area skipping was only predicted by interest area. A LRT between these two models was significant, indicating a main effect of group, χ2 (10) = 247.96, p < .001, Another GLMER model was fit using interest area as the sole predictor of skipping. A second LRT was conducted between this model and the full model. This test was significant, indicating a main effect of interest area, χ2 (12) = 12146, p < .001. Finally, we fit a model with no interaction effect and compared this model to the full model. This LRT was also highly significant, meaning the full model with an interaction effect fit the data better.
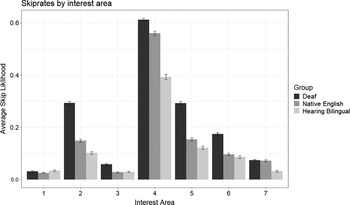
Follow-up analyses included group as a dummy-coded predictor of skipping behavior (with native English readers as the comparison group) as well as including interest area and the interaction between the two predictors. This allowed for a comparison of individual groups to each other, revealing that the deaf group skipped scoring regions more often than native English readers (β = 0.957, z = 6.98, p < .001), who skipped more often than Chinese–English bilinguals (β = –0.538, z = –2.83, p < .001; deaf vs. Chinese–English bilingual: β = 1.515, z = 9.64, p < .001). Overall, there were differences in the likelihood of skipping between interest areas, and this interacted with group, showing that the pattern of skipping across the different regions of the sentence varied among monolingual, hearing bilingual, and deaf readers (see Figure 1). Deaf readers skipped more than native English readers, who skipped more often than Chinese–English bilinguals.
Experiment 1 skip rate for Interest Areas 1–7 by group (deaf vs. Chinese–English bilingual vs. native English).

Comprehension accuracy and skip rate
Given the differences in overall skip rates, we tested whether accuracy rates on comprehension questions also differed among the three groups, and if skipping rate predicted comprehension accuracy. To do this, average skip rate (across Areas 2–6) and comprehension accuracy were calculated for each subject. Then, a multiple regression model was fit predicting accuracy from skip rate, group, and the interaction. Analysis of this model indicated main effects of skip rate, F (1, 169) = 10.30, p = .002, and group, F (2, 169) = 5.96, p = .003, but no interaction (p = .30). The effect of group on accuracy was due to a higher accuracy rate for the native English readers compared to both the deaf readers and the Chinese–English bilinguals (see Table 3). The main effect of skip rate indicated that, collapsing across groups, participants who skipped more had lower comprehension rates (β = –3.8%, r = –.23). However, there was no interaction between group and skip rate. These results do not indicate that the relationship between skipping and comprehension differs across the three groups (see Figure 2). To reiterate, readers who skipped more often comprehended the sentences to a lesser extent. The statistical results provide no evidence that the strength of this correlation differed across groups.
Average comprehension accuracy rate, average skip rate for Interest Areas 2–6, and the Pearson r correlation between skip rate and accuracy by group

*p < .05.
Experiment 1 average skip rate versus comprehension accuracy by group.

Word frequency and skipping
Typically, word skipping is predictable from lexical characteristics of words (e.g., word frequency and word class), as well as basic visual features of print (e.g., word length and the location of white space; Inhoff & Rayner, Reference Inhoff and Rayner1986; Rayner, Reference Rayner1998). As Rayner noted, lexical characteristics of words affect fixation and saccade timing, while basic visual properties of print affect saccade targeting, which in turn affects saccade length and landing positions. Readers can make saccades across texts even when little or no linguistic/semantic information is being extracted (as in mindless reading; Reichle, Reineberg, & Schooler, Reference Reichle, Reineberg and Schooler2010). Hence, it is important to determine whether readers are skipping more because they are processing less linguistic or semantic information or whether they are skipping more despite continuing to process texts for meaning. We assume that if lexical variables continue to affect eye movements and comprehension remains at a high level, then readers are extracting linguistic/semantic information, even if they are skipping significant portions of the text.
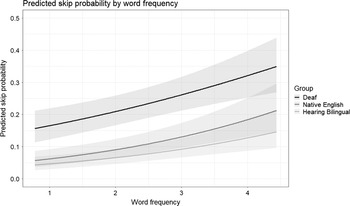
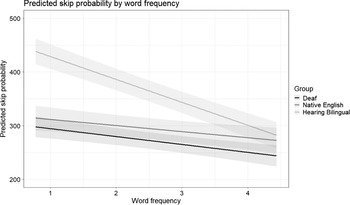
We analyzed the data to determine the extent to which word frequency predicted skipping behavior within each group of readers. To do so, a logistic mixed-effects regression model predicting skipping of Interest Area 5 was fit with group (native English reader, deaf, or Chinese–English bilingual) and lexical frequency as predictors. A LRT between the full model with group predicting skipping behavior and the reduced model without group predicting skipping behavior indicated a main effect of group, χ2 (4) = 44.891, p < .001. A LRT between the full model with frequency predicting skipping behavior and the reduced model without frequency predicting skipping behavior indicated a main effect of frequency, χ2 (3) = 23.679, p < .001. As predicted, across all groups, higher frequency content words were more likely to be skipped (β = 0.409; see Figure 3). There was no interaction between frequency and group (p = .116), suggesting that word frequency affected the different groups’ skipping behavior similarly.
Experiment 1 effects of frequency and group on probability of skipping Interest Area 5. Lexical frequency is represented on the Zipf scale, a logarithmically normed scale between 1 (low frequency) and 7 (high frequency). Shaded areas represent 95% prediction intervals from the full logistic mixed-effect regression model.

Frequency and first-pass time
First-pass time in a scoring region is the sum of all of the fixations within the region, starting with the first fixation and ending when the reader’s gaze crossed either the left or the right boundary of the scoring region. To further investigate possible interactions between group and frequency, models were fit predicting first-pass fixation duration on content words (Interest Area 5).Footnote 3 These linear mixed-effects regression models contained the same two predictors (group and frequency) and the same random effect structures as the models described above, with the only difference being that they predicted first-pass duration and thus used normal mixed-effects regression rather than logistic mixed-effects regression.
The models for first-pass duration revealed main effects of group, χ2 (4) = 127.07, p < .001, and frequency, χ2 (3) = 112.62, p < .001, and their interaction, χ2 (2) = 75.759 p < .001. The frequency main effect indicates that across groups, higher frequency words were fixated for a shorter time than low frequency words (β = –11.33). Group comparisons showed that the Chinese–English bilingual group had longer first-pass fixation durations than both the native English readers (β = 149.21, t = 7.66, p < .001) and deaf participants (β = –161.12, t = –10.44, p < .001), and showed an interaction between group and frequency for both comparisons (Chinese–English bilinguals vs. native English: β = –31.54, t = 6.95, p < .001; Chinese English bilinguals vs. deaf: β = 27.52, t = 7.47, p < .001). This interaction is due to a greater effect of frequency in the Chinese–English bilingual group compared to either of the other two groups (see Figure 4). The deaf group had significantly shorter first-pass fixation times than the native English group (β = –13.29, t = –1.05, p = .037) but group did not interact with frequency for this comparison (p = .21). As shown in Figure 4, the significant interaction is likely due to the Chinese–English bilingual group having a much larger effect of frequency than the other two groups.
Effects group and lexical frequency on first-pass time on Interest Area 5. Lexical frequency is represented on the Zipf scale, a logarithmically normed scale between 1 (low frequency) and 7 (high frequency). Shaded areas represent 95% prediction intervals from the full mixed-effects model.

Skipping results: Individual differences and group interact
Individual differences variables such as vocabulary knowledge, reading experience, and IQ have been shown previously to affect reading behavior and comprehension outcomes (e.g., Freed, Hamilton, & Long, Reference Freed, Hamilton and Long2017; Kuperman & van Dyke, Reference Kuperman and van Dyke2011). While we did not match across groups on our three individual differences variables, we can assess the degree to which those variables influenced reading behavior, and the degree to which the influence of English knowledge/experience is similar across the three groups. If deaf readers really have different perceptual spans (as per Belanger and colleagues), we might expect to see different relationships between English knowledge/experience, nonverbal intelligence, and skipping behavior in that group compared to the others. If deaf readers differ from the other groups only in terms of the individual difference variables, and that is all that matters in terms of skipping behavior, then group membership status should account for little or no variance in observed skipping behavior outcomes.
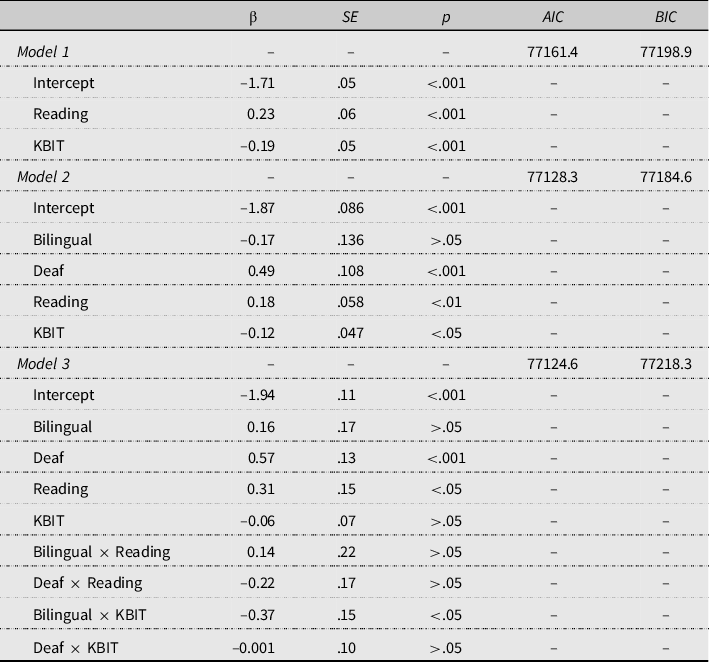
To evaluate these possibilities, we compared full models with group (deaf ASL–English bilinguals vs. native English monolinguals vs. Chinese–English bilinguals) and reduced models without group to answer the question of whether group explains the log-odds of skipping beyond what the control variables (KBIT, Nelson–Denny, and author recognition test scores) explain.
In preparation for model fitting, we took the mean of the Nelson–Denny and author recognition test scores for each person to create a single measure of reading ability since the two scores were highly and significantly correlated, r = .64, p < .001. We also standardized the reading ability and KBIT scores to facilitate convergence and interpretation. Thus, the intercept of a model with native English monolinguals as the reference for group represents the log-odds of skipping of an English monolingual who scored at the average on reading ability and KBIT scores.
We fit three GLMER models of increasing complexity to predict the log-odds of skipping. Results of the models are included in Table 4. Model 1 was specified as follows
 $$log\bigg({{P(skippin{g_{ij}})} \over {{\rm{1}}\;{\rm{ - }}\;P(skippin{g_{ij}})}}\bigg) = {\beta _{{\rm{0i}}}} + {\beta _{\rm{1}}}reading\,abilit{y_{\rm{i}}} + {\beta _{\rm{2}}}KBI{T_i} + {e_{ij}},$$
where an individual’s (i = 1, …, N) log-odds of skipping at interest area j = 1, …, 7 was predicted by their composite reading score as well as their KBIT score. Furthermore, the model in (1) allowed for a random effect in the intercept, denoted by an i subscript, which allows for individuals to differ from the average intercept so that the dependencies between repeated measures within individuals are accounted for. Model 2 subsumed (1) with the addition of an effect for Chinese–English bilinguals and an effect for deaf individuals (making the monolinguals the reference group):
 \[\begin{gathered}
{\text{log}}\left( {\frac{{{\text{P(skippin}}{{\text{g}}_{{\text{ij}}}}{\text{)}}}}{{{\text{1}}\;{\text{ - }}\;{\text{P(skippin}}{{\text{g}}_{{\text{ij}}}}{\text{)}}}}} \right) = {\beta _{0i}}\; + \;{\beta _1}reading\;abilit{y_i} + \;\;{\beta _2}KBI{T_i} \\
\; + \;{\beta _3}bilingua{l_i}\; + \;{\beta _4}dea{f_i}\; + \;{e_{ij}} \\
\end{gathered} \]
Parameters in mixed-effects logistic regression models predicting log-odds of skipping

Note: Reference group refers to monolingual individuals
Model 3 added to (2) an interaction term between the groups and reading ability scores and the groups and KBIT scores and was specified as
 \[\begin{gathered}
{\text{log}}\left( {\frac{{{\text{P}}({\text{skippin}}{{\text{g}}_{{\text{ij}}}})}}{{1\; - \;{\text{P}}({\text{skippin}}{{\text{g}}_{{\text{ij}}}})}}} \right){\text{ = }}{{\text{\beta }}_{0{\text{i}}}}\;{\text{ + }}\;{{\text{\beta }}_1}{\text{reading}}\;{\text{abilit}}{{\text{y}}_{\text{i}}}\;{\text{ + }}\;{{\text{\beta }}_2}{\text{KBI}}{{\text{T}}_{\text{i}}} \\
{\text{ + }}\;{{\text{\beta }}_3}{\text{bilingua}}{{\text{l}}_{\text{i}}}\;{\text{ + }}\;{{\text{\beta }}_4}{\text{dea}}{{\text{f}}_{\text{i}}}\;{\text{ + }}\;\;{{\text{\beta }}_5}{\text{reading}}\;{\text{abilit}}{{\text{y}}_{\text{i}}}\; \\
{\text{ \times }}\;{\text{bilingua}}{{\text{l}}_{\text{i}}}\;{\text{ + }}\;{{\text{\beta }}_6}{\text{reading}}\;{\text{abilit}}{{\text{y}}_{\text{i}}}\;{\text{ \times }}\;{\text{dea}}{{\text{f}}_{\text{i}}}\;{\text{ + + }}\;{{\text{\beta }}_7}{\text{KBI}}{{\text{T}}_{\text{i}}} \\
{\text{ \times }}\;{\text{bilingua}}{{\text{l}}_{\text{i}}}\;{\text{ + }}{{\text{\beta }}_8}{\text{KBI}}{{\text{T}}_{\text{i}}}\;{\text{ \times }}\;{\text{dea}}{{\text{f}}_{\text{i}}}\;{\text{ + }}\;{{\text{e}}_{{\text{ij}}}}{\text{.}} \\
\end{gathered} \]
A LRT between the models in (1) and (2) favored the latter model,
 $${{{\chi }}^{{2}}}$$
(2) = 37.07, p < .001, indicating the model with group as a predictor fit the data better than a model without group. A second LRT was conducted between the models in (2) and (3) to determine whether the addition of interaction effects was significant. This test was significant,
 $${{{\chi }}^{{2}}}\;$$
(4) = 11.74, p < .05, indicating that (3) was the superior model.
Finally, the Akaike information criteria (AIC) and Bayesian information criteria (BIC) are shown in Table 4. The AIC confirmed the results of the LRTs (favoring Model 3), but the BIC did not (favoring Model 2). This is not surprising as the BIC enforces a larger penalty for model complexity than does the AIC. Although the fit indices disagree, we believe there are substantive justifications for the interactions to be included in (3).
In short, the best fitting model for skipping behavior included group membership, both of the individual differences constructs (English knowledge/experience and nonverbal intelligence), and interactions of those factors. We interpret these results as indicating that individual differences alone do not account for the observed effects. Instead, and consistent with the analyses reported in the previous sections, deaf, hearing bilingual, and native English readers had different skipping outcomes that can not be straightforwardly attributed solely to the individual differences variables of nonverbal IQ and English experience/vocabulary knowledge.
To summarize, deaf readers skipped words more often than Chinese–English (hearing) bilinguals who achieved a comparable degree of text comprehension (according to comprehension question accuracy).Footnote 4 Despite greater skip rates and lower overall first-pass and total fixation time, deaf readers’ eye movements appeared to remain under cognitive control. That is, the timing and locations of fixations were affected by linguistic properties of the stimuli, not just basic visuospatial properties of the display (the location of letters and the white spaces between words), suggesting a linkage between ongoing interpretive processing and eye-movement planning and execution. Deaf readers’ skip rates, first-pass times, and total fixation times changed with lexical frequency to about the same degree as hearing readers. Like native English readers, deaf readers experienced lesser costs of declining word frequency than Chinese–English (hearing) bilingual readers. Hence, while skipping rates were higher in deaf than hearing readers, Experiment 1 indicated that deaf readers fixated less often and for less time overall than hearing native English and bilingual readers. Similar effects of word frequency on skipping and fixation time across the three groups suggest that differences between groups were quantitative rather than reflecting fundamentally different reading strategies.
Experiment 2
Experiment 2 provided further evidence about the nature of deaf and hearing readers’ eye movements during reading. The data for Experiment 2 were collected in a separate eye-tracking experiment that investigated effects of syntactic structure on reading behavior with a different set of participants and items. As in Experiment 1, three groups of readers participated: deaf ASL–English bilinguals, native English, and hearing Chinese–English bilinguals. As in the prior experiment, we divided the sentences into seven scoring regions. On the basis of Experiment 1 and prior studies, our chief hypotheses were that the deaf readers would skip more often than the other two groups, and that this pattern would not negatively affect their comprehension accuracy relative to the other groups. The main purpose of Experiment 2 was to determine whether the key findings from Experiment 1 regarding group differences in skipping rate would replicate in a different set of stimuli.
Method
Participants
A sample of 60 native English speakers from UC Davis (48 female, age 18–23), 60 Chinese–English bilinguals from UC Davis (40 female, age 18–25), and 80 deaf individuals from Gallaudet University participated in this experiment (53 female, age 18–47). A total of 45 of the deaf readers participated in both experiments. UC Davis students received course credit in return for their participation. Gallaudet University students received $25 in cash as compensation.
Stimuli
We evaluated readers’ response to 25 test sentences, again selected from a larger set of sentences based on their syntactic structure. As with Experiment 1, each sentence was divided into seven scoring regions based on syntactic constituents. An example of a sentence from experiment two is: “That was the/quote/that the celebrity/tweeted/to all of his fans/about last/night.” Such sentences are sometimes referred to as containing filler-gap dependencies because the word quote is considered part of the phrase tweeted to all of his fans about the quote in the underlying or “canonical” form of the sentence (Traxler & Pickering, Reference Traxler and Pickering1996). In syntactic parsing experiments, these sentences produce processing difficulty under certain conditions at and following the word about.
Apparatus and procedure
The eye-tracking apparatus and procedure were identical to Experiment 1.
Analyses
The logistic mixed effect regression models were identical to the sentence-wide models discussed in the beginning of the Experiment 1 results section. The models predicted skip rate by group (native English, Chinese–English, and deaf), interest area (Areas 2–6), and the interaction between these factors. The multiple regression models were also identical to those in Experiment 2, predicting accuracy rate from group and average skip rate.
Results and Discussion of Experiment 2
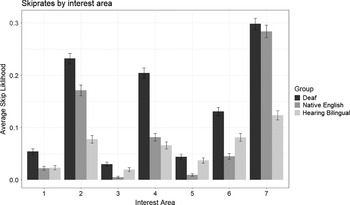
In the analysis of skipping behavior, the linear mixed-effects regression models indicated a main effect of group, χ2 (10) = 106.78, p < .001, interest area, χ2 (12) = 332.14, p < .001, and an interaction between the two, χ2 (10) = 51.34, p < .001. This indicates that again, the groups skipped at different rates, interest areas were skipped at different rates, and these factors interacted such that groups differed in which interest areas they were likely to skip (see Figure 5). Overall, deaf readers skipped most often, native English readers less often, and Chinese–English bilinguals least often.
Experiment 2 skip rates by group for Interest Areas 1–7. Bars represent standard errors of the mean.

Comprehension accuracy and Skip rate
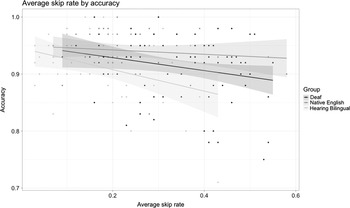
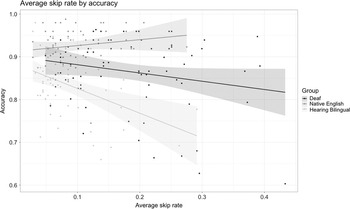
As with Experiment 1, we fit a multiple regression model predicting accuracy from skip rate and group, as well as the interaction. This model found a main effect of Skip rate, F (1, 193) = 6.31, p = .013, indicating that overall, participants who skipped more comprehended less. In addition, there was a main effect of group, F (2, 193) = 30.26, p < .001, and, contrary to Experiment 1, there was an interaction between group and skip rate, F (2, 193) = 4.58, p = .011. Follow-up comparisons showed that the accuracy rates differed significantly across all groups (all ps < .001), with the native English group having the highest accuracy, followed by the deaf group, and then the Chinese–English bilinguals (see Table 5). Follow-up analyses found that the group differences in the effect of skip rate was primarily between the native English group and the Chinese–English bilingual group, F (1, 117) = 13.22, p < .001, while the difference between the deaf group and the Chinese–English bilingual group was marginal, F (1, 134) = 3.46, p = .065, as was the difference between the deaf and native English group (p = .09). As shown in Figure 6, the native English group had a weak positive correlation between skip rates and accuracy (r = .16), while the deaf group had a weak negative correlation (r = –.21), and the Chinese–English bilingual group had a stronger negative correlation (r = –.43). Native English readers’ comprehension was not predicted by skip rate. Likewise, the deaf group showed a nonsignificant cost of greater skipping. Only in the Chinese–English bilingual group did readers who skipped more attain lower comprehension scores. Between the two bilingual groups, these data again suggest that, although deaf readers skipped much more often than hearing bilinguals, this affected their comprehension less. Further, the deaf readers in Experiment 2 also achieved better comprehension as a group than the hearing Chinese–English bilinguals, while still performing statistically worse than hearing native English readers.
Experiment 2 average comprehension accuracy rate, average skip rate for Interest Areas 2–6, and the Pearson r correlation between skip rate and accuracy by group for Experiment 2

*p < .05.
Experiment 2 average skip rate by comprehension accuracy by group. Shaded areas represent 95% confidence intervals.

General Discussion
We conducted these two experiments to test the hypothesis that deaf readers’ perceptual spans differ from native English and hearing Chinese–English bilinguals. Greater skipping with preserved comprehension among deaf readers was the chief prediction. To rule out alternative explanations for greater skipping among deaf readers, we tested whether the lexical variable of frequency could be used to predict skipping rates and first-pass fixation times. We determined that deaf readers did in fact skip more often than native English and Chinese–English bilinguals. While deaf readers’ comprehension was statistically lower than native English readers who were reading in their first language, it was equal to (Experiment 1) or statistically higher (Experiment 2) when compared to another group reading in their second language. All groups’ eye-movement patterns (skipping and first-pass time) were predictable from lexical frequency, indicating that language interpretation processes were engaged in all groups and had an effect on their eye movements. Finally, the individual differences analyses indicated that group membership could account for variance in skipping rates over and above nonverbal intelligence, vocabulary knowledge, and English language experience.
Experiment 1 showed that deaf readers were more likely to skip interest areas than hearing native English readers, who were more likely to skip interest areas than the hearing Chinese–English readers. This effect of group interacted with interest area indicating that the three groups skipped different parts of the sentence with varying likelihood (i.e., the tendencies of which areas were skipped differed between groups). All three groups responded similarly to lexical frequency in regard to skipping likelihood. However, for first-pass fixation time, the Chinese–English bilinguals were more affected by lexical frequency. In Experiment 1, higher skip rates led to lower accuracy across all groups. Experiment 2 replicated the finding that deaf readers skip interest areas more than their hearing counterparts, with Chinese–English bilinguals having an even lower skip rate than native English readers. The comprehension data again showed an overall negative relationship between skipping and accuracy, but also showed that the native English group was less affected by higher skip rates than the Chinese–English bilingual group, and marginally less so than the deaf group.
Across interest areas and in both experiments, deaf readers skipped more than hearing readers, replicating findings from Belanger et al. (Reference Bélanger, Slattery, Mayberry and Rayner2012, Reference Belanger, Lee and Schotter2018) and Belanger and Rayner (Reference Belanger and Rayner2015). In Experiment 1 this pattern was even more pronounced compared to the hearing Chinese–English bilingual control group, who were the least likely to skip interest areas. Average skip rates were higher in Experiment 1 (deaf: 34%, native English: 24%, Chinese–English bilinguals: 18%) than in Experiment 2 (deaf: 18%, native English: 10%, Chinese–English bilinguals: 9%), but in both experiments deaf readers had skip rates of about twice that of the hearing bilingual comparison group. This shows that the differences between deaf and hearing readers when it comes to skipping behavior is not likely due to the deaf group reading in their second language. All of the stimuli in the two experiments were in a nonnative language for both the Chinese–English bilinguals and the deaf readers. Hence, both deaf readers and Chinese–English bilinguals were reading in their second language. Because both groups were operating in their second language, it is difficult to see how differences in performance between the groups can be attributed to their bilingualism per se.
The consistency of the effect in both experiments provides evidence that the pattern of deaf readers making fewer fixations than hearing readers generalizes across different types of sentences. Further, the sentences analyzed in the two experiments were more syntactically complex than the sentence stimuli used in previous studies that reported skip rates for deaf readers (e.g., in Belanger et al., Reference Bélanger, Slattery, Mayberry and Rayner2012). Hence, the current study suggests that deaf readers are still more likely to skip words than hearing readers even in more complex syntactic contexts, where hearing bilinguals were less likely to skip words (see Anible et al., Reference Anible, Twitchell, Waters, Dussias, Piñar and Morford2015). Note, however, that further work needs to be done to isolate the effects of sentence (syntactic) complexity on deaf readers’ eye movements.
Word frequency was related to eye-movement behavior in all three groups of readers. As had been shown previously (e.g., Rayner et al., Reference Rayner, Reichle, Stroud, Williams and Pollatsek2006), higher frequency words were more likely to be skipped than lower frequency words, and this was true across the three groups. This probably reflects the increased likelihood of higher frequency words to be sufficiently processed using parafoveal information. Assuming a larger perceptual span, we predicted that deaf readers would be better able to use parafoveal information and thus have a larger effect of lexical frequency compared to the other groups. However, this was not the case. We saw no significant interaction between group and frequency for predicting skip rates. While this does not indicate the deaf readers are more sensitive to lexical frequency information, it does show that they are sensitive to this information in the parafovea, indicating that their skipping behavior is nonrandom and most likely linked to online lexical processing. Overall, this suggests that deaf readers’ skipping behavior is being guided by at least some of the same factors as hearing readers, but their increased skip rate cannot be accounted for by an increased sensitivity to lexical frequency.
First-pass fixation times and lexical frequency were also analyzed for Interest Area 5 in Experiment 1. If deaf readers were better able to process parafoveal information, a greater effect of lexical frequency might show up in an “early” processing measure like first-pass fixation time, as more information about the word could be processed in the previous fixation. First, across all three groups, higher frequency words were fixated on for less time than lower frequency words, as higher frequency words are more easily recognized. Second, deaf readers had shorter fixation times than the hearing readers, a pattern reported by Belanger et al. and interpreted as supporting the notion that deaf individuals are more efficient readers. There was an interaction between group and lexical frequency for first-pass fixation times, however. This was driven by an increased effect of frequency for the hearing bilingual group, who also had the longest overall fixation times. Hence again, we did not observe that deaf readers were more affected by lexical frequency than either of the hearing groups for first-pass fixation duration.
In both experiments, greater skipping negatively affected comprehension, in that readers who skipped more often scored lower on the comprehension questions. This is the typical pattern observed among hearing readers and is usually understood as marking riskier reading strategies (e.g., Rayner, Reference Rayner1978). In Experiment 1, this skipping cost was not observably different across groups, suggesting that “risky” reading came at a cost regardless of group. In Experiment 2, there was an indication that skipping costs on comprehension were greater in the Chinese–English bilinguals compared to the native English group, possibly suggesting that deaf and native English readers are better able to judge when it is safe to skip by virtue of greater experience reading English. The word processing efficiency hypothesis implies that deaf readers’ comprehension may be more resilient than hearing readers who skip at the same rate, because larger perceptual spans allow them to better extract parafoveal information, which has not been fixated, and skip words more strategically. Yet in both experiments, the skipping effect on accuracy did not differ between the deaf and native English readers. Thus, these data do not show that deaf readers are immune to the overall relationship between skipping and comprehension. That said, the deaf readers did skip considerably more than the other two groups, and achieved accuracy rates at least as high as the hearing bilingual comparison group (Experiment 1), and possibly higher (Experiment 2). Thus, deaf readers are able to fixate on a sentence fewer times than hearing bilingual readers while still extracting comparable amounts of information. Deaf readers did score lower on comprehension questions than native English readers in both experiments. Looking at all three groups together, one might attribute comprehension differences between deaf and native English participants to the first- versus second-language status of the readers.
One difference between the two experiments relates to the greater likelihood overall of skipping in Experiment 1 compared to Experiment 2. We did not design the study with specific between-experiment manipulations derived from a theory of eye-movement control, including skipping behavior, or a theory of sentence complexity. Subjectively, object-extractions seem more taxing than relative clause attachment ambiguities, and studies contrasting different types of extractions indicate that object-movement is relatively difficult (e.g., Wanner & Maratsos, Reference Wanner, Maratsos, Halle, Bresnan and Miller1978; see Traxler, Morris, & Seely, Reference Traxler, Morris and Seely2002, for a summary of accounts). It is tempting to attribute cross-experiment differences in skipping to stimulus complexity, but we are not able to rule out plausible alternatives, including uncontrolled differences between the participants across the two experiments. Very few studies to date involving deaf readers have included factorial manipulations of syntax or other linguistic variables. Such studies, in addition to psychometric studies of reading, will be necessary in the development of a model that faithfully depicts how deaf readers control their eyes during reading.
While these results are not enough to make strong claims about which model of reading eye movement control best fits deaf readers, there are some interesting takeaways. In the EZ reader model (Reichle, Warren, & McConnell, Reference Reichle, Warren and McConnell2009), attention is allocated serially, and the word following fixation (n+1) is covertly attended only after a familiarity check, or initial lexical processing stage is completed on the fixated word (n). In this framework, words are skipped if a familiarity check is completed on word n+1 before the saccade to that word is programmed. Thus in EZ reader, the increased size of the perceptual span of deaf readers would not necessarily be expected to affect skipping behavior (since word n+1 is in readers’ span regardless), but rather the speed at which the n+1 familiarity check is completed. Under the word processing efficiency hypothesis this would still be reasonable to expect, on the assumption that deaf readers may have some enhanced ability to extract or encode visual information. However, this would likely depend on the assumption that deaf readers skip more not because of the size of their perceptual span, but because of the quality of their perceptual spans, allowing for an increased ability to gather useful information from it or an ability to more quickly process information from it.
In a parallel-graded attention model of reading such as SWIFT (Engbert et al., Reference Engbert, Nuthmann, Richter and Kliegl2005), attention is allocated to all words in the perceptual span in parallel, biased toward the fovea. Because in this framework, word identification processes for multiple words can run simultaneously, words are skipped when subsequent words (e.g., n+1) are recognized in the parafovea. The findings of Belanger and others that deaf readers have larger perceptual spans would suggest that more words are being processed simultaneously within a fixation, leading to a greater likelihood that a nonfixated word gets recognized (assuming the reader has the attentional resources to allocate to it). Hence, in parallel-graded attention models like SWIFT, the increased skip rate of deaf readers could be accounted for by a larger or higher quality perceptual span (or some combination thereof).
Some of the current findings appear to be straightforwardly compatible to the main proposal of Belanger et al.’s word processing efficiency: deaf readers, compared to native English and hearing bilinguals, have fewer fixations overall, skip parts of the text more frequently, and fixate for less time, all without substantial loss of comprehension. In addition, because fixation and skipping behaviors are still coupled with linguistic aspects of the text, deaf readers’ eye movements appear to be directly connected to online lexical processing of the text in a way that is qualitatively similar to other readers. Thus, we can rule out an account under which deaf readers are “skimming” texts for gist, rather than reading them for meaning. If deaf readers had been skimming texts, we would expect them to have performed much worse on comprehension questions and to have shown lesser influence of variables like lexical frequency. Further, we can also rule out the possibility that the pattern of eye movement behavior that deaf readers exhibit is due to reading in a second language. Therefore, the present results are in line with Belanger’s hypothesis that deaf readers possess greater efficiency in visual information uptake, perhaps especially in the parafovea.
Finally, a brief note about the keyword strategy hypothesis (Dominguez & Alegria, Reference Dominguez and Alegria2010). According to this hypothesis, deaf readers achieve a good representation of sentence meaning on the basis of identifying a subset of the words in the sentence. Specifically, they rely on higher frequency content words. This strategy bears some resemblance to the good enough processing hypothesis for hearing readers, which proposes that lexical semantics provides a route to meaning independent of a more detailed syntactic analyses of a sentence (Ferreira, Reference Ferreira2003). We do not see any specific results in the current study that would be problematic for the key word strategy hypothesis, but the story is complex. Deaf readers in our study are skipping more often than hearing bilingual readers. This would be compatible with a key word strategy, assuming that the comprehension questions are answerable on the basis of gist information (possibly not true), and that hearing bilinguals are opting for a different reading strategy than the deaf readers. However, other studies, including our own prior published work, show that deaf readers respond to syntactic characteristics of sentences (e.g., Pinar, Carlson, Morkford, & Dussias, Reference Piñar, Carlson, Morford and Dussias2017; Traxler, Corina, Morford, Hafer, & Hoversten, Reference Traxler, Corina, Morford, Hafer and Hoversten2014). Those findings would indicate that deaf readers are taking in more than the lexical semantics of key words. In addition, it is not clear whether a key word strategy would or would not be consistent with Belanger et al.’s findings regarding perceptual span. If deaf readers are adopting a different reading strategy than other groups do, it is not clear why that would lead to a perceptual span of about 20 characters as opposed to about 15 characters to the right of fixation. Even when readers are skimming, if their perceptual spans are 15 characters, then their skimming speed should reach maximum when the window of available text is 15 characters wide. Another complication is the degree to which Dominguez and Alegria’s participants resemble the deaf readers in our two experiments and other prior sentence-processing studies on deaf readers. If the groups of participants had different proficiencies across the two studies, or different language exposure profiles, or different nonverbal intelligence, and so forth, those factors could affect reading strategy choice (and other outcomes as well). Perceptual span is not a fixed entity even within individuals. As reading proficiency increases, perceptual span increases. As text difficulty increases, perceptual span decreases. Hence, knowing more about the characteristics of the participants can help interpret outcomes across studies.
Potential limitations
There are a number of aspects of the current study that may warrant some caution. First, matching for relevant individual difference variables is difficult. For example, deaf readers, but not the other groups, vary in terms of the age at which they were exposed to their first language. Further, we did not measure some variables, like working memory, executive function, and processing speed, that have shown in other studies to have direct and indirect influences on reading and comprehension outcomes (Freed et al., Reference Freed, Hamilton and Long2017; Hamilton, Freed, & Long, Reference Hamilton, Freed and Long2013, Reference Hamilton, Freed and Long2016; Traxler et al., Reference Traxler, Long, Tooley, Johns, Zirnstein and Jonathan2012). Second, it is entirely possible that we missed some individual characteristics that are important in affecting reading behavior. While we have measures of vocabulary and knowledge of authors, we do not have a standardized measure that indicates at what grade level equivalent the participants are operating in English. Third, we tested readers on lists of unrelated sentences, as opposed to more naturalistic texts. It is possible that readers approach these kinds of materials differently. Fourth and finally, we did not experimentally manipulate some potentially critical text characteristics, such as lexical frequency, word type, length, and so on. Manipulating those variables more intentionally would allow for stronger causal conclusions.
A further word of caution applies to eye-movement experiments generally. Eye-trackers can output a multiplicity of dependent measures (e.g., first-pass time, first-fixation time, regression-path time, total time, saccade length, landing position, first-pass regressions, etc.). Sentence stimuli can be carved into a variety of scoring regions. This can lead to a perplexingly large number of dependent measure by scoring region combinations. Further, interpreting eye-movement results requires a model that links observed behaviors to underlying processes. Fortunately, we have a large body of psychometric studies and well-worked out formal models of eye-movement control, including models of skipping behavior (Brysbaert & Vitu, Reference Brysbaert and Vitu1998; Rayner, Reference Rayner1998). Further, by focusing in narrowly on skipping behavior as our main outcome of interest, we have avoided some of the complexity that arises in studies that analyze multiple dependent measures derived from the same eye-movement records (e.g., Traxler et al., Reference Traxler, Pickering and Clifton1998). With all that in mind, future studies should attempt to replicate our finding of increased skipping rates in deaf readers across a wider spectrum of stimulus types. Other eye-movement methods, including the boundary change technique (Brothers & Traxler, Reference Brothers and Traxler2016; Rayner, Well, Pollatsek, & Bertera, Reference Rayner, Well, Pollatsek and Bertera1982) could also be profitably applied to further evaluate the enhanced perceptual span and word-processing efficiency hypotheses.
With all that in mind, the finding of greater skipping behavior in deaf readers compared to the other groups replicated across the two sets of sentences. Combined with prior results from Belanger’s lab, there now appears to be substantial evidence that college-level deaf readers can comprehend English sentences about as well as their hearing peers, particularly other bilinguals reading in a second language, while directly fixating less of the actual text.
Conclusions
We examined reading behavior in deaf, native English, and Chinese–English bilingual readers. Consistent with the word processing efficiency hypothesis, deaf readers skipped over pieces of the text more often and fixated for less time than the other groups of readers, and they did so without experiencing disproportionate losses of understanding. Word frequency influenced deaf readers’ skip rates and fixation times similarly to both of the hearing groups. Further work is necessary to determine whether deaf readers are deploying a quantitatively different reading strategy than hearing readers, perhaps by virtue of a larger perceptual span driven by greater parafoveal attention and/or by greater efficiency in processing parafoveal information. Further work is also necessary to determine what factors differ between more and less proficient deaf readers.
Acknowledgments
This research was supported by an award from National Institutes of Health Grant R21-11601946, awarded to the first author.