Introduction
Depression occurs in 15–20% of general practice attendees (Goldberg & Huxley, Reference Goldberg and Huxley1992), relapse after first episode is common (Thornicroft & Sartorius, Reference Thornicroft and Sartorius1993) and residual impairment and premature death are relatively common consequences (Cassano & Fava, Reference Cassano and Fava2002). Estimating overall risk of major depression across a range of key risk factors is a key first priority in planning prevention. We recently developed predictD, a risk algorithm for the onset of major depression over 12 months in general practice attendees. The algorithm was developed in six European countries and externally validated in general practice attendees in Chile (King et al. Reference King, Weich, Torres, Svab, Maaroos, Neeleman, Xavier, Morris, Walker, Bellon, Moreno, Rotar, Rifel, Aluoja, Kalda, Geerlings, Carraca, Caldas de Almeida, Vicente, Saldivia, Rioseco and Nazareth2006, Reference King, Walker, Levy, Bottomley, Royston, Weich, Bellón-Saameño, Moreno, Svab, Rotar, Rifel, Maaroos, Aluoja, Kalda, Neeleman, Geerlings, Xavier, Carraça, Gonçalves-Pereira, Vicente, Saldivia, Melipillan, Torres-Gonzalez and Nazareth2008). We modelled our approach on indices used to predict risk of cardiovascular disease (Anderson et al. Reference Anderson, Wilson, Odell and Kannel1991), which provide a percentage risk estimate over a given time period. PredictD contains 10 factors: age; sex; educational level achieved; lifetime screen for depression; family history of psychological difficulties; physical health and mental health subscale scores on the Short Form 12 (Jenkinson et al. Reference Jenkinson, Layte, Jenkinson, Lawrence, Petersen, Paice and Stradling1997); unsupported difficulties in paid or unpaid work; and experiences of discrimination; country. The algorithm's precision (onset of major depression over 12 months) in terms of mean c-index for all six participating European countries was 0.790 [95% confidence interval (CI) 0.767–0.813]. Effect size for difference in predicted log odds of depression between those who became depressed and those who did not was 1.28 (95% CI 1.17–1.40). The external validation of the algorithm in Chilean general practice attendees resulted in a c-index of 0.710 (95% CI 0.670–0.749).
Following our first study, resources were available to enable us to follow up participants in the UK, Spain, Slovenia and Portugal for a further 12 months. Although prediction over 12 months is a pragmatic objective in terms of the day-to-day work of general practitioners (GPs), it is important to know whether the algorithm is accurate over longer periods. Given that a number of the risk variables are long term in their effect, risk prediction (and therefore prevention efforts) might be accurate over longer time courses. Our aim was to assess the precision of predictD over a further 12 months, or 24 months in all.
Method
Study setting and design
The original predictD study was conducted in six European centres:
(1) UK: 25 general practices in the Medical Research Council's General Practice Research Framework (MRC GPRF), in the UK. There were 40 GPs in eight rural practices and 58 GPs in 17 urban practices.
(2) Spain: 57 GPs in nine large primary care centres in Andalucía, Spain, in which seven were urban and two rural.
(3) Solvenia: 74 general practices nationwide in Slovenia.
(4) Estonia: 23 general practices nationwide in Estonia. Of these, 15 were urban and eight rural and all had single-handed GPs.
(5) The Netherlands: seven large general practice centres near Utrecht, The Netherlands. Of these, two were urban and five rural and there were 38 GPs working across the seven centres.
(6) Portugal: two large primary care centres in the Lisbon area of Portugal; one was urban and contained 18 GPs and the other rural and contained seven GPs.
Because the study required the cooperation of the GPs in each centre, they could not be selected randomly or comprehensively except in Slovenia where almost all the primary care centres in the country participated. Nevertheless, the general practices and health centres covered urban and rural populations with considerable socio-economic variation. The 24 months' follow-up of patients was conducted in a cohort of 4190 general practice attendees in the UK, Spain, Slovenia and Portugal who were not depressed at baseline. The study was approved by ethical committees in each country.
Study participants
Consecutive attendees aged 18–75 years were recruited to the predictD study in Europe between April 2003 and September 2004. Exclusion criteria were not being resident in the country, an inability to understand one of the main languages involved, psychosis, dementia and incapacitating physical illness. Recruitment differed slightly in each country because of local service preferences. In the UK researchers spoke to patients waiting to see practice staff. In the other three European countries doctors introduced the study before contact with researchers. Participants gave informed consent and undertook a research evaluation within 2 weeks. We followed up patients at 6, 12 and 24 months.
Major depression
A Diagnostic and Statistical Manual of Mental Disorders, fourth edition (DSM-IV) diagnosis of major depression in the preceding 6 months at recruitment, and at 6 and 12 months' follow-ups was made using the Depression Section of the Composite International Diagnostic Interview (CIDI) (Robins et al. Reference Robins, Wing, Wittchen, Helzer, Babor, Burke, Farmer, Jablenski, Pickens and Regier1988; WHO, 1997). However, at the 24-month follow-up the CIDI covered the preceding 12 months.
Known risk factors
We selected risk factors in order to cover key areas identified in a systematic review of the literature (Weich, Reference Weich2001). Where possible, we used standardized self-report measures. Each instrument or question not available in the relevant languages was translated from English and back-translated by professional translators. Questions adapted from standardized questionnaires or developed for the study were evaluated for test–retest reliability before the main study began. A total of 285 patients across the six European countries completed the battery of questions on two occasions, 2 weeks apart. The full range of risk factors tested is described elsewhere (King et al. Reference King, Weich, Torres, Svab, Maaroos, Neeleman, Xavier, Morris, Walker, Bellon, Moreno, Rotar, Rifel, Aluoja, Kalda, Geerlings, Carraca, Caldas de Almeida, Vicente, Saldivia, Rioseco and Nazareth2006, Reference King, Walker, Levy, Bottomley, Royston, Weich, Bellón-Saameño, Moreno, Svab, Rotar, Rifel, Maaroos, Aluoja, Kalda, Neeleman, Geerlings, Xavier, Carraça, Gonçalves-Pereira, Vicente, Saldivia, Melipillan, Torres-Gonzalez and Nazareth2008). Those factors that became a part of the predictD algorithm are as follows:
• Country of participation.
• Age, sex, educational level.
• Life-time depression was based on affirmative answers to the first two questions of the CIDI life-time depression section (Robins et al. Reference Robins, Wing, Wittchen, Helzer, Babor, Burke, Farmer, Jablenski, Pickens and Regier1988; WHO, 1997).
• Questions on history of serious psychological problems in first-degree relatives were based on those contained in a family history questionnaire developed for genetic research (Qureshi et al. Reference Qureshi, Bethea, Modell, Brennan, Papageorgiou, Raeburn, Hapgood and Modell2005). As described in our earlier paper, κ/intra-class correlations for test–retest reliability of these questions ranged from 0.70 to 1.0 (King et al. Reference King, Weich, Torres, Svab, Maaroos, Neeleman, Xavier, Morris, Walker, Bellon, Moreno, Rotar, Rifel, Aluoja, Kalda, Geerlings, Carraca, Caldas de Almeida, Vicente, Saldivia, Rioseco and Nazareth2006). One combined question was included in the predictD algorithm (see Appendix, available online).
• Unsupported difficulties in paid and/or unpaid work in the preceding 6 months using questions from the job content instrument (Karasek & Theorell, Reference Karasek and Theorell1990). This instrument focuses on paid work, so we adapted the questions to include unpaid work and subjected these to test–retest reliability (King et al. Reference King, Weich, Torres, Svab, Maaroos, Neeleman, Xavier, Morris, Walker, Bellon, Moreno, Rotar, Rifel, Aluoja, Kalda, Geerlings, Carraca, Caldas de Almeida, Vicente, Saldivia, Rioseco and Nazareth2006). The κ statistics for the two questions on the final predictD algorithm (for unpaid work) were 0.48 and 0.67.
• Self-rated physical and mental health was assessed by the Short Form 12 (Jenkinson et al. Reference Jenkinson, Layte, Jenkinson, Lawrence, Petersen, Paice and Stradling1997). This instrument has high validity and reliability and is used extensively in clinical and epidemiological research. The summary physical and mental health measures in the Short Form 12 have a high degree of correspondence with those in the parent instrument, the Short Form 36 (Gandek et al. Reference Gandek, Ware, Aaronson, Apolone, Bjorner, Brazier, Bullinger, Kaasa, Leplege, Prieto and Sullivan1998). The weights used to calculate scores are from version 1.
• Experiences of discrimination in the preceding 6 months on grounds of sex, age, ethnicity, appearance, disability or sexual orientation using questions from a European study (Janssen et al. Reference Janssen, Hanssen, Bak, Bijl, de Graaf, Vollebergh, McKenzie and van Os2003). Although these questions had been used in Europe previously, their reliability was unknown and thus they were included in our assessment of test–retest reliability. The κ statistics for these questions ranged from 0.53 to 1.0.
Statistical analysis
All analyses were performed using Stata release 11 (StataCorp LP, USA). We included only patients without major depression at baseline. Participants with missing depression diagnoses at any point were excluded, as these data were necessary for the validation. In our original analysis to derive the predictD algorithm (King et al. Reference King, Walker, Levy, Bottomley, Royston, Weich, Bellón-Saameño, Moreno, Svab, Rotar, Rifel, Maaroos, Aluoja, Kalda, Neeleman, Geerlings, Xavier, Carraça, Gonçalves-Pereira, Vicente, Saldivia, Melipillan, Torres-Gonzalez and Nazareth2008), and in our analysis of its extended function here, we calculated the c-index (Harrell, Reference Harrell2001) in each country and all countries combined. The c-index is equivalent to the area under a receiver operating characteristic curve (plot of sensitivity v. 1 – specificity), in that it measures the model's ability to discriminate between individuals who become depressed and those who do not. For example, a c-index of 0.8 means that if you randomly selected one of the individuals who became depressed and one who did not, then on 80% of occasions the individual who became depressed will have the higher risk as predicted by the model. We assessed the goodness of fit of the final risk model by grouping individuals into deciles of risk and comparing the observed probability of major depression within these groups with the average predicted risk.
Recalibration of predictD (logit) risk score to predict incidence in year 2
Recalibration is a simple method of adjusting an existing model to predict risk in a new setting. It involves estimating only two new parameters and as such is expected to produce reasonable predictions beyond the dataset used for recalibration (i.e. the model does not over-fit the data) (Steyerberg et al. Reference Steyerberg, Borsboom, van Houwelingen, Eijkemans and Habbema2004; Janssen et al. Reference Janssen, Moons, Kalkman, Grobbee and Vergouwe2008). Typically recalibration is used when a risk score is applied outside the population for which the original model was developed. Here we use the method to improve risk prediction when the model is applied over a different time period. The logit risk score, Z, is recalibrated to predict year 2 incidence by fitting a logistic model to data on incidence between month 12 and month 24 with Z as the predictor variable, i.e. the slope (a) and intercept (b) are estimated for the model logit (incidence year 2)=a+bZ. The logit risk score (Z) was calculated using imputed data that was created for the original predictD study (King et al. Reference King, Walker, Levy, Bottomley, Royston, Weich, Bellón-Saameño, Moreno, Svab, Rotar, Rifel, Maaroos, Aluoja, Kalda, Neeleman, Geerlings, Xavier, Carraça, Gonçalves-Pereira, Vicente, Saldivia, Melipillan, Torres-Gonzalez and Nazareth2008).
Predicting incidence over 24 months
To predict incidence over the whole 24 months we used the following relationship between the 24-month incidence and the incidence in each year:
 $$\eqalign{ \tab {\rm Overall}\;{\rm incidence} \equals \cr \quad 1 \minus \lsqb \lpar 1 \minus {\rm incidence}\;{\rm year}\;1\rpar \times \lpar 1 \minus {\rm incidence}\;{\rm year}\;2\rpar \rsqb, \cr} $$
where the predicted incidence during year 1 is simply the original 12-month risk score, and the predicted incidence in year 2 comes from the recalibrated score.
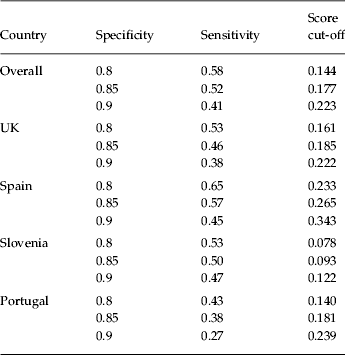
Finally we report the threshold values of risk score, and the associated sensitivity, for a range of specificity that would be practical (minimizing false positives) when using the instrument in a clinical setting.
Results
Numbers and missing data
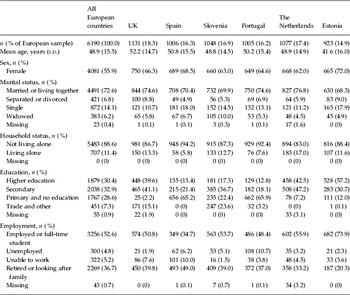
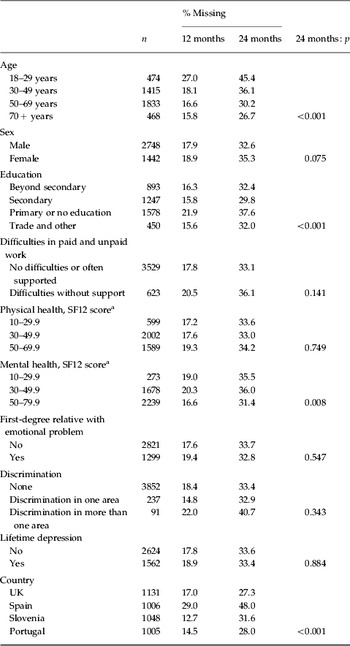
Response to recruitment was high in Portugal (76%), Estonia (80%), Slovenia (80%) and Chile (97%) but lower in the UK (44%) and The Netherlands (45%). Ethical considerations prevented the collection of data on non-responders at baseline. A total of 4190 general practice attendees from the UK, Spain, Slovenia and Portugal were not depressed at baseline and were followed up for 24 months (Table 1). Within this cohort 3427 (81.7%) had data on their depression status at 12 months and 2670 (63.7%) had data at 12 months and 24 months. The pattern of missing depression data at each outcome is shown in Table 2. Attrition over 24 months was highest in Spain and lowest in Slovenia. It was also higher in 18- to 20-year-olds than in the other age groups.
Demographic characteristics

s.d., Standard deviation.
Percentage missing 12-month and 24-month depression data by baseline characteristics

a Short Form 12 score (Jenkinson et al. Reference Jenkinson, Layte, Jenkinson, Lawrence, Petersen, Paice and Stradling1997).
Incidence of major depression
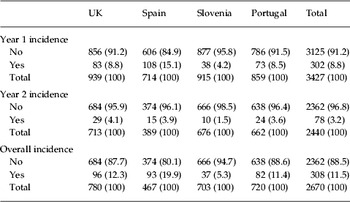
During the first 12 months the incidence of major depression had been 8.8% (302/3427). The incidence between 12 and 24 months was lower – of the 2440 participants who did not have an episode of major depression in the first 12 months and who had 24-month data, only 78 (3.2%) became depressed during the second year of follow-up. Incidence over the 24 months as a whole was 11.5% (308/2670), with the highest rate in Spain (19.9%) and the lowest in Slovenia (5.3%) (Table 3).
Incidence of major depression over 24 months

Data are given as number of participants (percentage).
Prediction from 12 to 24 months
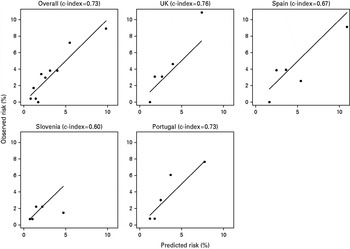
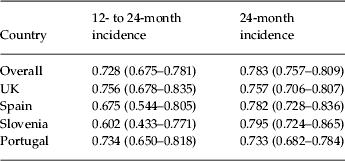
The logit risk score for incidence in year 2 was estimated to be –1.51 + (0.76×Z), where Z is the original logit risk score for depression in the first 12 months. The recalibrated risk score appears to predict incidence in year 2 well in the combined data from four countries (Fig. 1). The overall c-index was 0.728 (95% CI 0.675–0.781) (Table 3). When this new risk score was applied separately in each country, the predicted risks were in reasonable agreement with observed risk in all except Slovenia, where the model also performed poorly in terms of the c-index (i.e. the model was poor at discriminating between those who became depressed and those who did not).
Recalibrated risk score used to predict incidence between 12 and 24 months. Mean predicted risk versus observed risk for each decile (overall) or quintile (within countries) of predicted risk. Overall (c-index = 0.73); UK (c-index = 0.76); Spain (c-index = 0.67); Slovenia (c-index = 0.60); Portugal (c-index = 0.73). The c-index is equivalent to the area under a receiver operating characteristic curve (plot of sensitivity v. 1 – specificity), in that it measures the model's ability to discriminate between individuals who become depressed and those who do not.

Prediction over the full 24 months
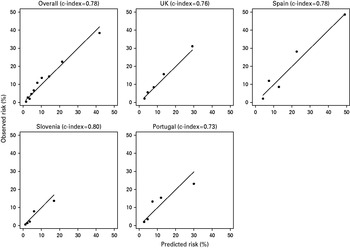
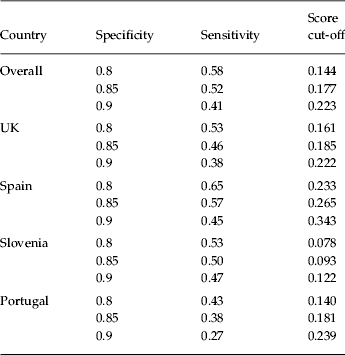
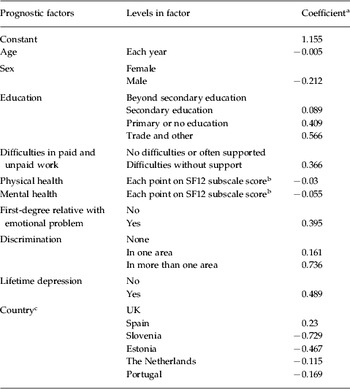
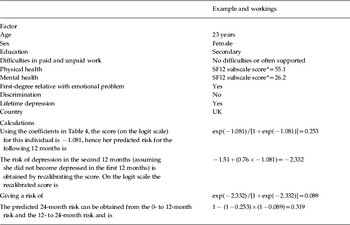
We also predicted incidence of major depression over 24 months (Fig. 2). The model was a good predictor of incidence over this period but this is partly because most events occurred within the first year and these data were used to build the original model. The overall c-index is 0.783 (95% CI 0.757–0.809) (Table 4). Sensitivity and specificities for different thresholds of risk over 24 months are given in Table 5. Risk factors and their coefficients are given in Table 6 and a worked example of how to calculate a risk score in an individual is shown in Table 7.
Recalibrated risk score used to predict incidence over 24 months. Mean predicted risk versus observed risk for each decile (overall) or quintile (within countries) of predicted risk. Overall (c-index = 0.78); UK (c-index = 0.76); Spain (c-index = 0.78); Slovenia (c-index = 0.80); Portugal (c-index = 0.73). The c-index is equivalent to the area under a receiver operating characteristic curve (plot of sensitivity v. 1 – specificity), in that it measures the model's ability to discriminate between individuals who become depressed and those who do not.

c-Indicesa by country
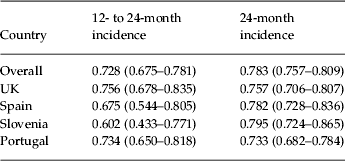
Data are given as c-index (95% confidence interval).
a The c-index is equivalent to the area under a receiver operating characteristic curve (plot of sensitivity v. 1 – specificity), in that it measures the model's ability to discriminate between individuals who become depressed and those who do not.
Sensitivity and specificity at different score cut-offs for use of predictD over 24 months
Risk factors in the predictD algorithm and their regression coefficients

a Regression coefficients after shrinkage for over-fitting. See King et al. (Reference King, Walker, Levy, Bottomley, Royston, Weich, Bellón-Saameño, Moreno, Svab, Rotar, Rifel, Maaroos, Aluoja, Kalda, Neeleman, Geerlings, Xavier, Carraça, Gonçalves-Pereira, Vicente, Saldivia, Melipillan, Torres-Gonzalez and Nazareth2008).
b Short Form 12 score (Jenkinson et al. Reference Jenkinson, Layte, Jenkinson, Lawrence, Petersen, Paice and Stradling1997).
c We include all countries in the original predictD study here because the algorithm for 24 months can in principle be used in Estonia and The Netherlands even though it has not been validated over 24 months in these countries.
Worked example of use of predictD

a Short Form 12 score (Jenkinson et al. Reference Jenkinson, Layte, Jenkinson, Lawrence, Petersen, Paice and Stradling1997).
Discussion
Our aim in developing the predictD algorithm was to select key risk factors from the many reported in the literature in a simple and yet valid risk equation for prediction of major depression over 12 months. We have now demonstrated that predictD also predicts risk over 24 months but at slightly lower levels of precision. The c-index provides a standardized way of comparing the discriminative power of tests that use different measurement units in different settings (Pepe et al. Reference Pepe, Janes, Longton, Leisenring and Newcomb2004). The 24-month predictD risk score (c-index = 0.783) compares favourably with a risk index for cardiovascular events developed in 12 European cohorts (Conroy et al. Reference Conroy, Pyorala, Fitzgerald, Sans, Menotti, De Backer, De Bacquer, Ducimetiere, Jousilahti, Keil, Njolstad, Oganov, Thomsen, Tunstall-Pedoe, Tverdal, Wedel, Whincup, Wilhelmsen and Graham2003), which reported c-indices between 0.71 and 0.82. Although developed in general practice attendees, it is likely to have validity in general populations, as most people in the UK and other European countries attend their GP at least once per year.
Strengths and limitations
The main strength is that use of predictD was extended to 24 months in a large population in four European countries. Lower recruitment rates occurred in the UK and The Netherlands, possibly because the study was not so obviously endorsed by doctors. Although this was compensated for by high follow-up rates at 6 and 12 months, the rate was lower at 24 months for the people in this four-country cohort who were not depressed at baseline. There were differences in the geographical distribution of general practices in each country, which reflected the varying networks available to the centres. Although our risk factors are based on self-report, in the main we used standardized instruments and where unstandardized questions were used, all were tested for reliability (King et al. Reference King, Weich, Torres, Svab, Maaroos, Neeleman, Xavier, Morris, Walker, Bellon, Moreno, Rotar, Rifel, Aluoja, Kalda, Geerlings, Carraca, Caldas de Almeida, Vicente, Saldivia, Rioseco and Nazareth2006). Assessing the occurrence of major depression on the CIDI over 12 months at the 24 months follow-up (instead of over 6 months as at baseline, 6 and 12 months outcomes) potentially introduces a degree of imprecision in that recall may have been less accurate over this longer period.
Implementation
Our study does not address how predictD might best be used in general practice. However, the questions making up the algorithm are short and easy to complete and thus it has potential as a clinical tool for prediction of future episodes of depression in this setting. In reporting a range of thresholds for sensitivity and specificity (Table 5), we would maximize specificity at the cost of reduced sensitivity in order to limit the workload for family doctors engaging with false positives. For example, if a primary care doctor were to apply a European threshold for risk of 22.3% (i.e. specificity of 0.9 and sensitivity of 0.41) they could be sure that the numbers of patients wrongly identified as people at risk of major depression (false positives) would be kept to a minimum. Although this would be at the cost of missing some of those who would go on to develop major depression over 24 months, use of a high cut-off ensures that prevention efforts are less likely to be wasted on those not at risk. On the other hand, if the prevention interventions require little input by way of physician time and effort (e.g. a web-based depression self-help prevention package), a lower cut-off, say 14.4% (i.e. specificity of 0.8 and sensitivity of 0.58), might be considered, as the larger number of positives caught in the net could be offered the intervention without substantially increasing costs to the health service. These threshold values at the same specificity (i.e. 0.9 and 0.8) levels using the 12-month algorithm were 16.5% and 10.6%, respectively (King et al. Reference King, Walker, Levy, Bottomley, Royston, Weich, Bellón-Saameño, Moreno, Svab, Rotar, Rifel, Maaroos, Aluoja, Kalda, Neeleman, Geerlings, Xavier, Carraça, Gonçalves-Pereira, Vicente, Saldivia, Melipillan, Torres-Gonzalez and Nazareth2008). It appears that in general a higher cut-off can be considered if an overall 24-month perspective were to be considered rather than 12 months. This would result in delivery of the preventive intervention to fewer patients.
Application in the general population
PredictD was developed in general practice attendees, as that setting was considered to be appropriate both for discussing risk with people and for prevention efforts. We cannot be sure that it will function similarly in general populations. However, in the countries in which predictD was developed and validated there are national health services that are free at the point of delivery. Thus, in these countries we suspect the algorithm will function just as it does in general practice attendees. However, this needs confirmation in further research.
Prevention
Even though a number of predictD risk factors are immutable, advising patients on the nature of depression, or on brief cognitive behaviour strategies they might undertake to reduce their risk, might be helpful. The same might be true for starting or re-starting antidepressant medication. We are currently undertaking two randomized clinical trials in which we are evaluating predictD as part of brief prevention strategies in general practice for people at high risk. One is an ongoing evaluation of the effectiveness of a brief GP intervention in a large number of general practices in Spain, while the second is a feasibility trial in the UK of the effectiveness of a web-based package of education and information for patients at risk.
Conclusions
The predictD risk algorithm is an accurate indicator of the risk of major depression over 24 months but performs slightly less well over the second 12 months. It may be useful as a strategy to identify those at risk in prevention efforts in general medical settings.
Supplementary material
For supplementary material accompanying this paper visit http://dx.doi.org/10.1017/S0033291712002693.
Acknowledgements
The research in Europe was funded by a grant from The European Commission (grant no. PREDICT-QL4-CT2002-00683). We are also grateful for part support in Europe from: the Slovenian Ministry for Research (grant no. 4369-1027); the Spanish Ministry of Health (grant FIS references no. PI041980, PI041771 and PI042450) and the Spanish Network of Primary Care Research, redIAPP (ISCIII-RETIC RD06/0018) and SAMSERAP group; and the UK National Health Service (NHS) Research and Development office for providing service support costs in the UK. The funders had no direct role in the design or conduct of the study, interpretation of the data or review of the manuscript.
M.K. had full access to all of the data in the study and takes responsibility for the integrity of the data and the accuracy of the data analysis. We thank all patients and general practice staff who took part; the European Office at University College London for their administrative assistance at the coordinating centre; Mr Kevin McCarthy, the project's scientific officer in the European Commission, Brussels, for his helpful support and guidance; the UK MRC GPRF; Ms Louise Letley, from the MRC GPRF; and the Camden and Islington NHS Foundation Trust, London, UK.
Declaration of Interest
None.