





1. Introduction
Pressure fluctuations in a compressible turbulent boundary layer (TBL) are a fundamental topic in both turbulence modelling and engineering applications. On the one hand, fluctuating pressure plays an essential role in redistributing the turbulent kinetic energy (Pope Reference Pope2000) and exchanging between internal and kinetic energy (Zhao, Liu & Lu Reference Zhao, Liu and Lu2020). On the other hand, pressure fluctuations within subsonic TBLs are the major excitation sources of cabin noise during the cruise stage for aeroplanes, while within supersonic and hypersonic TBLs, they are associated with the cause of acoustic fatigue that structural elements of an aircraft are exposed to (Bull Reference Bull1996). Accordingly, pressure fluctuations in TBLs have been the subject of extensive investigations in recent decades (Willmarth Reference Willmarth1975; Bull Reference Bull1996; Beresh et al. Reference Beresh, Henfling, Spillers and Pruett2011; Bernardini & Pirozzoli Reference Bernardini and Pirozzoli2011; Gloerfelt & Berland Reference Gloerfelt and Berland2013; Ritos, Drikakis & Kokkinakis Reference Ritos, Drikakis and Kokkinakis2019a; Gerolymos & Vallet Reference Gerolymos and Vallet2023), where one of the most important control parameters is the free stream Mach number  $M$. With
 $M$ increasing, the acoustic mode and entropy mode can be further excited (Zhang, Duan & Choudhari Reference Zhang, Duan and Choudhari2017) and coupled with various flow modes to induce complex flow structures, which are closely related to the generation and evolution of pressure fluctuations. Additionally, increasing
 $M$ enhances the Mach wave radiation and the Doppler effect to modulate the characteristics of the intensity and sound-radiation directivity. The quantitative assessment of the influence of Mach number on pressure fluctuations is highly advantageous for turbulence modelling and structural design.
The Mach number level can reflect the strength of compressibility effects, which give rise to mean density gradients in addition to mean velocity gradients, and to the turbulent field consisting of pressure, density and velocity fluctuations (Smits Reference Smits1991). The role of pressure fluctuations in compressible flows becomes more significant due to the additional energy transport mechanisms, such as pressure–dilatation and pressure–strain correlations (Lele Reference Lele1994). In addition, wall-cooling effects can also strengthen compressibility effects (Yu, Xu & Pirozzoli Reference Yu, Xu and Pirozzoli2020). Zhang et al. (Reference Zhang, Duan and Choudhari2017) found that the intensity of near-wall pressure fluctuations is dramatically enhanced by wall-cooling effects in hypersonic TBLs. Zhang et al. (Reference Zhang, Wan, Liu, Sun and Lu2022) reported that this enhancement originates from the generation of near-wall travelling-wave-like dilatational structures. To explore the features of wall pressure fluctuations beneath supersonic TBLs, Kistler & Chen (Reference Kistler and Chen1963) performed the first measurement in the range of  $1.33\leq M \leq 5$. They reported that increasing
 $M$ has the main effect of decreasing the characteristic length scale of the pressure-carrying eddies. Beresh et al. (Reference Beresh, Henfling, Spillers and Pruett2011) obtained fluctuating wall pressure signals up to
 $M=3$ and compared the root-mean-square (r.m.s.) levels with a cluster of data from high-speed measurements. However, a large scatter was found in the data, primarily due to limitations in the frequency response of pressure sensors. Due to the advantage of being able to provide accurate three-dimensional global flow data, high-fidelity numerical simulations have been employed to study the characteristics of pressure fluctuations more recently. Duan, Beekman & Martín (Reference Duan, Beekman and Martín2011) performed systematic direct numerical simulations (DNS) of TBLs with
 $M$ ranging from 0.3 to 12, and reported that the compressibility effects are reflected by the increase in fluctuations of thermodynamic quantities and turbulent Mach numbers. Bernardini & Pirozzoli (Reference Bernardini and Pirozzoli2011) analysed the intensity, frequency spectrum, space–time correlation and convection velocity of pressure fluctuations by means of DNS at
 $M=2,3,4$. The results showed that the increased intensities are mainly present near the wall and in the free stream, which are associated with enhanced genuine compressibility effects (reflected by dilatation fluctuations) and acoustic radiation, respectively. Focusing on comparing the characteristics of the free stream and wall pressure fluctuations, Duan, Choudhari & Wu (Reference Duan, Choudhari and Wu2014) observed important differences in aspects of amplitude, frequency content and convection speeds. Subsequently, they continuously carried out a series of DNS on the corresponding situations in hypersonic TBLs. Based on the implicit large-eddy simulation (iLES), Ritos et al. (Reference Ritos, Drikakis and Kokkinakis2019a); Ritos, Drikakis & Kokkinakis (Reference Ritos, Drikakis and Kokkinakis2019b) investigated the wall pressure fluctuations beneath supersonic and hypersonic TBLs and proposed a modified spectrum model by introducing compressibility corrections. Gerolymos & Vallet (Reference Gerolymos and Vallet2023) constructed a
 $(Re,M)$-matrix database of compressible turbulent channel flow and summarized Mach number effects on pressure fluctuations based on turbulent statistics. Nonetheless, the underlying scaling relation between pressure fluctuations and Mach number from the perspective of flow physics, such as the generation mechanism of pressure fluctuations, necessitates further exploration.
The well-known classic spectrum model of wall pressure fluctuations, the Chase–Howe model (Chase Reference Chase1980, Reference Chase1987; Howe Reference Howe1998), was developed to characterize the pressure fluctuations in weakly compressible flow, based on their generation mechanisms: mean flow–turbulence and turbulence–turbulence interactions. According to the terms specified in the governing Poisson equation for pressure fluctuations, as outlined in Pope (Reference Pope2000), these fluctuations can be theoretically decomposed into two primary components: rapid pressure ( $p_r$) and slow pressure (
 $p_s$). These components are associated with the generation mechanisms of mean flow–turbulence and turbulence–turbulence interactions, respectively. In the context of arbitrary compressible flows, Sarkar (Reference Sarkar1992) derived the equation for pressure fluctuations and introduced a compressible pressure component (
 $p_c$) to account for compressibility effects. This component is utilized to estimate pressure–dilatation correlations by isolating a single contributing factor. Following this approach, Foysi, Sarkar & Friedrich (Reference Foysi, Sarkar and Friedrich2004) extended the Poisson-equation-based pressure decomposition method to compressible channel flow, enabling the study of pressure–strain correlations in different components. Tang et al. (Reference Tang, Zhao, Wan and Liu2020) and Yu et al. (Reference Yu, Xu and Pirozzoli2020) split the pressure fluctuations in compressible channel flow with relatively high Mach numbers and highlighted the significance of the genuine compressibility effects and compressible pressure component. Recently, Zhang et al. (Reference Zhang, Wan, Liu, Sun and Lu2022) extended the pressure decomposition method and applied it to compressible TBLs to illustrate wall-cooling effects on pressure fluctuations from the perspective of generation mechanisms. Generally, the pressure decomposition method has been widely used to investigate the mechanism of pressure fluctuations, including the characteristics of pressure fluctuation sources (Chang, Piomelli & Blake Reference Chang, III, Piomelli and Blake1999; Anantharamu & Mahesh Reference Anantharamu and Mahesh2020), pressure–strain correlation (Foysi et al. Reference Foysi, Sarkar and Friedrich2004), wall echo effects (Gerolymos, Sénéchal & Vallet Reference Gerolymos, Sénéchal and Vallet2013) and wall pressure spectrum (Hu, Reiche & Ewert Reference Hu, Reiche and Ewert2017; Grasso et al. Reference Grasso, Jaiswal, Wu, Moreau and Roger2019; Yang & Yang Reference Yang and Yang2022), and it becomes a viable approach to provide fruitful physical insight originating from the generation mechanisms of pressure fluctuations.
To correlate the distribution profiles of turbulent statistics properties scaled by wall units in incompressible and compressible wall-bounded turbulence, Morkovin (Reference Morkovin1962) hypothesized that when the turbulent Mach number is sufficiently small, compressible wall-bounded flows can be mapped onto the incompressible counterparts by taking the variation of mean properties (density, viscosity, etc.) into account. The Van Driest transform (Van Driest Reference Van Driest1951) for mean velocity  $\bar {u}$ and the resulting Morkovin scaling for velocity fluctuation
 $\boldsymbol{u}_{rms}^\prime$ are widely used and even serve as a ‘standard’ when analysing compressible adiabatic wall-bounded turbulence. Concerning the diabatic one, especially with wall cooling, the Van Driest transform becomes less accurate. Recently, several improved transformations have been developed, such as the transformation of Trettel & Larsson (Reference Trettel and Larsson2016) in the semilocal scaling, the data-driven-based transformation of Volpiani et al. (Reference Volpiani, Iyer, Pirozzoli and Larsson2020) and the total-stress-based transformation of Griffin, Fu & Moin (Reference Griffin, Fu and Moin2021). These relations are not only of theoretical interest but also play an essential role in reduced-order turbulence modelling (Griffin, Fu & Moin Reference Griffin, Fu and Moin2023). However, the mapping onto incompressible flow becomes significantly distinct when considering pressure fields. Unlike the velocity field, which is primarily associated with the vorticity mode, the pressure field is intrinsically influenced by multiple modes, especially the vorticity and acoustic modes. As a result, establishing a mapping relation for pressure fluctuations inevitably poses greater challenges.
The scope of this study is to analyse DNS data of compressible TBLs in a relatively wide range of free stream Mach numbers from 0.5 to 8.0 and to investigate the relationship between pressure fluctuations and Mach numbers. In particular, the intrinsic scaling relation of pressure fluctuations is explored by analysing the components of pressure fluctuations from the perspective of generation mechanisms. Additionally, inspired by this intrinsic scaling relation, a semiempirical model predicting the dependence of pressure fluctuations on Mach number is proposed. The remainder of the paper is organized as follows. The numerical methods and simulation details are illustrated in § 2. The analysis of the components of pressure fluctuations and the scaling relation are discussed in § 3. The semiempirical model of pressure fluctuations is presented in § 3.4. The main findings and discussions are summarized in § 4.
2. The DNS of compressible TBL
Building on the insights gained from our prior studies (Zhang et al. Reference Zhang, Wan, Liu, Sun and Lu2022, Reference Zhang, Wan, Dong, Liu, Sun and Lu2023), DNS of five TBLs with a free stream Mach number range of  $0.5\leq M \leq 8.0$ are performed by solving the fully compressible Navier–Stokes equations for the compressible, viscous and ideal gas. The simulations are conducted based on the open-source code STREAmS (Bernardini et al. Reference Bernardini, Modesti, Salvadore and Pirozzoli2021), which can be efficiently accelerated by graphics processing units. The coefficient of viscosity
 $\mu$ is set as a function of temperature according to Sutherland's law. The equations are solved in a stretched Cartesian coordinate system and discretized by high-order finite-difference methods. The spatial discretization of the convective term adopts a hybrid energy-preserving–shock-capturing scheme in a locally conservative form. The convective flux is calculated by the eighth-order energy-preserving scheme (Pirozzoli Reference Pirozzoli2010) in smooth (shock-free) regions of the flow. Otherwise, in discontinuous regions, the Lax–Friedrichs flux vector splitting ensures robust shock-capturing capabilities with the characteristic fluxes at interfaces reconstructed by the seventh-order weighted essentially non-oscillatory scheme (Jiang & Shu Reference Jiang and Shu1996). To avoid odd–even decoupling phenomena, the viscous terms are expanded to Laplacian form and approximated by the sixth-order central finite-difference formula. The assembled semidiscrete system is advanced in time by a three-stage, third-order Runge–Kutta scheme (Spalart, Moser & Rogers Reference Spalart, Moser and Rogers1991). More details of the numerical methods can be found in the original paper introducing this solver (Bernardini et al. Reference Bernardini, Modesti, Salvadore and Pirozzoli2021).
The schematic of the computational model used for a plate TBL is illustrated in figure 1. The inflow condition is established through the recycling–rescaling scheme (Pirozzoli, Bernardini & Grasso Reference Pirozzoli, Bernardini and Grasso2010) to attain a fully developed turbulent state. This approach introduces less numerical noise into the flow field than a synthetic inflow like the conventional digital filtering method (Ceci et al. Reference Ceci, Palumbo, Larsson and Pirozzoli2022). At the upper and outflow boundaries, non-reflecting boundary conditions (Poinsot & Lele Reference Poinsot and Lele1992) are imposed according to the characteristic decomposition in the direction normal to the boundary. At the no-slip isothermal wall boundary, the wall temperature is set equal to the recovery temperature  $T_{r}=T_{\infty }(1+r(\gamma -1) M^{2} / 2)$ based on a recovery factor of
 $r=0.89$, and a similar characteristic wave treatment is also applied. Hyperbolic sine stretching is applied in the wall-normal direction to ensure sufficient resolution near the wall, and uniform grid spacing is adopted in the wall-parallel directions except in the sponge zone (Adams Reference Adams1998), which is added surrounding the computational physical domain at the top and tail to further eliminate non-physical reflections. For the spanwise direction, a periodic boundary condition is applied. Table 1 shows the DNS parameters of the present computational cases. Five compressible TBLs with free stream Mach numbers
 $M$ ranging from 0.5 to 8 are solved. Compared with other reliable DNS of compressible TBLs (Zhang et al. Reference Zhang, Duan and Choudhari2017; Bernardini et al. Reference Bernardini, Modesti, Salvadore and Pirozzoli2021; Huang, Duan & Choudhari Reference Huang, Duan and Choudhari2022; Xu, Wang & Chen Reference Xu, Wang and Chen2022), the grid resolutions used have met the requirements of DNS, with the current grid size of each case exceeding
 $460\times 10^6$. Moreover, higher grid resolutions are achieved in the two hypersonic TBLs to capture finer turbulent structures. The typical first- and second-order flow statistics have been validated by matching reference data in our previous work (Zhang et al. Reference Zhang, Wan, Liu, Sun and Lu2022), verifying the reliability of current data.
Schematic of the computational model (not in scale). The computational physical domain is surrounded by the sponge zones at the top and tail.

The simulation parameters for different cases:  $M$ is the free stream Mach number;
 $N$ and
 $L$ are the number of grid points and the length of the physical computational domain, respectively;
 $\Delta x^+$ and
 $\Delta z^+$ represent the non-dimensional grid spacings in the wall unit of streamwise and spanwise directions;
 $\Delta y^+_w$ and
 $\Delta y^+_e$ represent the wall-normal grid spacings at the wall and at the boundary edge, respectively;
 $\Delta y^\star _e$ represents the wall-normal grid spacings at the boundary edge in the semilocal scale;
 $N_f$ is the number of flow fields for statistics;
 $t_su_\infty /\delta _i$ is the time period for statistics.

Table 2 illustrates the statistical properties of TBLs at the station selected for analysis. All cases are analysed under approximately the same friction Reynolds numbers of  ${{Re}}_\tau \approx 630$, while the Reynolds numbers based on boundary layer thickness
 ${{Re}}_\delta$ and based on momentum thickness
 ${{Re}}_\theta$ and
 ${{Re}}_{\delta _{2}}$ increase monotonically with increasing
 $M$. In the case of adiabatic-wall TBLs, previous studies (Bernardini & Pirozzoli Reference Bernardini and Pirozzoli2011; Zhang et al. Reference Zhang, Duan and Choudhari2017; Gerolymos & Vallet Reference Gerolymos and Vallet2023) have demonstrated that standard wall units perform quite well in scaling pressure fluctuations, and thus we here attempt to find the potential scaling relationship between pressure fluctuations and
 $M$ by fixing
 ${{Re}}_\tau$. Similarly, friction factor
 $C_f$ and wall pressure fluctuation intensity in wall-unit
 $p^{\prime }_{rms,w}/\tau _w$ are also of monotonic behaviour with increasing
 $M$, where the monotonic increase of
 $p^{\prime }_{rms,w}/\tau _w$ is attributed to the enhancement of compressibility. In this study, thermodynamics variables are decomposed using the standard Reynolds decomposition
 $f=\bar {f}+f^\prime$ and the velocity variables are decomposed using density-weighted (Favre) representation
 $f=\tilde {f}+f^{\prime \prime }$, where
 $\tilde {f}=\bar {\rho f}/\bar {\rho }$. The superscript
 $(\bullet )^+$ denotes the variable normalized by the wall unit. The subscripts
 $(\bullet )_w$ and
 $(\bullet )_\infty$ denote the variables at the wall and in free stream, respectively.
Parameters of the TBL:  $x_a$ denotes the streamwise location for analysis. The friction Reynolds number and semilocal friction Reynolds number are
 ${{Re}}_\tau ={\rho }_w u_\tau \delta / {\mu }_{w}$ and
 ${{Re}}_\tau ^\star =({\rho }_\infty \tau _w)^{1/2} \delta / {\mu }_{\infty }$, where
 $\delta$ is the boundary layer thickness. The Reynolds number based on boundary layer thickness is
 ${{Re}}_{\delta }=\rho _{\infty } u_{\infty } \delta / \mu _{\infty }$. The Reynolds numbers based on momentum thickness are
 ${{Re}}_{\theta }=\rho _{\infty } u_{\infty } \theta / \mu _{\infty }$ and
 ${{Re}}_{\delta _{2}}=\rho _{\infty } u_{\infty } \theta / {\mu }_{w}$. Here
 $T_\infty$ is the free stream temperature;
 $C_f=2\tau _w/\rho _\infty u_\infty ^2$ is the friction factor;
 $p^{\prime }_{rms,w}/\tau _w$ means the non-dimensional wall pressure fluctuation intensity in the wall unit.

3. Scaling relations of pressure fluctuations with Mach number
In this section, some inspiring insights into vorticity and acoustic modes are obtained from the statistical characteristics of representative quantities. Then, the direct scaling relations of original pressure fluctuations with  $M$ are examined. Lastly, we investigate the intrinsic scaling relations embedded within the generation mechanisms of pressure fluctuations, employing the pressure decomposition method.
3.1. The turbulent statistics for vorticity and acoustic modes
For velocity fields dominated by the vorticity mode, figure 2 presents the first- and second-moment statistics of the streamwise velocity. As shown in figure 2(a), the profiles of mean velocity  $\bar {u}^+$ for all cases reasonably agree with the wall law in the range of
 $y^+<5$, but only the distribution for case M0 exhibits a good agreement with the log law where compressibility is negligibly weak. With increasing
 $M$, the profiles gradually deviate from the log law. After considering variations in mean density in figure 2(b), it is observed that the profiles of Van Driest transformed (Van Driest Reference Van Driest1951) mean velocity
 $\bar {u}_{vd}$ for all cases agree well with each other in both near-wall and log-law regions. Similarly, for velocity fluctuations intensities
 $u^{\prime +}_{rms}$ in figure 2(c), only the profile of case M0 collapses with the incompressible profile (Jiménez et al. Reference Jiménez, Hoyas, Simens and Mizuno2010), while the profiles of other cases with higher
 $M$ gradually deviate from the incompressible profile. Following the relations of strong Reynolds analogy (Morkovin Reference Morkovin1962), when the variation of mean density is taken into account, it can be seen in figure 2(d) that the profiles of density-scaled fluctuation intensities exhibit superior clustering and collapse compared with those of
 $u^{\prime +}_{rms}$. The obtained results not only validate the accuracy of the present data but also demonstrate the efficacy of utilizing Morkovin's hypothesis to map the statistics of compressible velocity fields onto their incompressible counterparts.
Statistical properties of streamwise velocity: (a) mean velocity  $\bar {u}^+$; (b) Van Driest transformed mean velocity
 $\bar{u}_{vd}^+$; (c) fluctuation intensity; (d) density scaled fluctuation intensity. The dot–dashed and dashed lines denote the wall law
 $u^+=y^+$ and the log law
 $u^+=\log {(y^+)}/0.41+5.2$, respectively. The circles indicate the reference data of an incompressible TBL with
 ${{Re}}_\tau =580$ from Jiménez et al. (Reference Jiménez, Hoyas, Simens and Mizuno2010). The diamonds denote a
 $M=8$ TBL with
 ${{Re}}_\tau =398$ from Duan et al. (Reference Duan, Beekman and Martín2011).

Considering that pressure fluctuations in compressible TBLs are mainly influenced by both the vorticity mode and acoustic mode (Phillips Reference Phillips1960; Lilley Reference Lilley1963), figure 3 presents the profiles of vorticity fluctuation intensities  $\omega _{rms}^{\prime +}$ and dilatation fluctuation intensities
 $\theta _{rms}^{\prime +}$, which can characterize the vorticity mode and acoustic mode to a certain extent, respectively. As shown in figure 3(a), the profiles of
 $\omega _{rms}^{\prime +}$ for all cases collapse well with each other at the fixed
 ${{Re}}_\tau$, indicating that the profiles of
 $\omega _{rms}^{\prime +}$ are almost not affected by increasing
 $M$. The magnitude of the vorticity mode seems to be controlled only by the parameter of
 ${{Re}}_\tau$. For dilatation fluctuations, the increase in
 $M$ monotonically enhances
 $\theta _{rms}^{\prime +}$ especially near the wall, as shown in figure 3(b). The magnitude of
 $\theta _{rms}^{\prime +}$ gradually weakens as the wall-normal position moves away from the wall. The distribution trends of
 $\omega _{rms}^{\prime +}$ and
 $\theta _{rms}^{\prime +}$ are consistent with the DNS data reported by Bernardini & Pirozzoli (Reference Bernardini and Pirozzoli2011). These findings imply the presence of intrinsic scaling relations, particularly when the vorticity and acoustic modes are properly isolated. Specifically, the contribution of the vorticity mode to pressure fluctuations is independent of
 $M$, while the contribution of the acoustic mode exhibits a monotonic increase with
 $M$.
(a) Vorticity fluctuation intensities  $\omega _{rms}^{\prime +}$ and (b) dilatation fluctuation intensities
 $\theta _{rms}^{\prime +}$.

3.2. The direct scaling relations of pressure fluctuations
To illustrate the scaling relations between pressure fluctuations and  $M$ directly, figure 4 shows the profiles of pressure fluctuation intensities
 $p_{rms}^{\prime +}$ in both the outer and inner scales, respectively. The profiles of all cases exhibit a similar trend that
 $p_{rms}^{\prime +}$ increases from its value at the wall and reaches the global maximum at
 $y^+\approx 12$ and then gradually decays to a plateau value out of the boundary layer where acoustic radiations dominate. As indicated by the black arrow in figure 4(a), the increase in
 $M$ overall enhances
 $p_{rms}^{\prime +}$ monotonically, corresponding to stronger acoustic modes in cases of higher
 $M$. The profile of the M0 case closely aligns with the reference data of an incompressible TBL (Jiménez et al. Reference Jiménez, Hoyas, Simens and Mizuno2010). Within the boundary layer, the near-wall enhancement clearly shown in figure 4(b) is a consequence of the stronger genuine compressibility in higher-
 $M$ cases, as demonstrated by
 $\theta _{rms}^{\prime +}$ in figure 3(b). In the far field, the enhancement in supersonic and hypersonic cases should be attributed to the Mach-wave radiation, which is induced by the supersonic convection eddies within TBLs. Because of the comprehensive contributions from the vorticity and acoustic modes, considering the variations in mean quantities may not be a viable solution when mapping the compressible profile of pressure fluctuations to the incompressible counterpart. Instead, removing the contribution of acoustic modes to pressure fluctuations is expected to work.
Intensities of pressure fluctuations  $p_{rms}^{\prime +}$ shown in (a) the outer scale and (b) the inner scale. The circles indicate the reference data of an incompressible TBL with
 ${{Re}}_\tau =690$ from Jiménez et al. (Reference Jiménez, Hoyas, Simens and Mizuno2010). The squares and diamonds denote
 $M=2$ and 4 TBLs with
 ${{Re}}_\tau =508$ and 506, respectively, from Bernardini & Pirozzoli (Reference Bernardini and Pirozzoli2011).

For evaluating the scaling relations of wall and far-field pressure fluctuations, the variations of pressure fluctuation intensities versus  $M$ are shown in figure 5. For wall pressure fluctuation intensities normalized by the free stream dynamic pressure
 $p_{rms}^{\prime }/q_\infty$, the data from measurements (grey square), simulations (red symbols) and prediction models (dashed lines) are collected in figure 5(a). Due to the limitations of pressure sensors in experiments, from light to dark colours, the grey squares indicate the uncorrected raw data, the corrected data by Corcos corrections (Corcos Reference Corcos1963) and the extended data further corrected based on an estimation of high-frequency spectra. It is shown that the corrected experimental data agree much better with simulation data than the original data. For compressible flows, Laganelli, Martellucci & Shaw (Reference Laganelli, Martellucci and Shaw1983) proposed an empirical model by extending an incompressible theory to compressible states, written as
 \begin{equation} p_{rms,w}^{\prime}/q_{\infty}=\frac{\sigma}{\left[0.5+\left(T_{w} / T_{r}\right)\left(0.5+0.09 M^{2}\right)+0.04 M^{2}\right]^{\phi}}, \end{equation}
where the two parameters  $\sigma$ and
 $\phi$ are determined by fitting experimental data. Their original values are
 $\sigma =0.006$ and
 $\phi =0.64$. Considering the potential bias in historical experimental data, the predictions of the original Laganelli model exhibit an overall underestimation compared with the numerical data. Therefore, Ritos et al. (Reference Ritos, Drikakis and Kokkinakis2019a) improved the model by introducing a modified
 $\sigma =0.008$ based on fitting their iLES data in a range of
 $2.25\le M\le 8$, but significant deviations still occur at the relatively lower Mach number range of
 $M<2$. By optimizing both two parameters, the modified model with
 $\sigma =0.01$ and
 $\phi =0.75$ proposed by Zhang et al. (Reference Zhang, Wan, Liu, Sun and Lu2022) shows good performances in a wide Mach number range of
 $0\le M\le 8$. Pressure fluctuation intensities normalized by the wall unit (
 $p_{rms,\infty }^{\prime +}$) in the far-field are also presented in figure 5(b), where grey diamonds indicate experimental data, red and blue symbols indicate numerical data with quasiadiabatic and cooled walls, respectively. The distributions of
 $p_{rms,\infty }^{\prime +}$ show approximately monotonic linear growths with increasing
 $M$. Consequently, a simple linear relation expressed as
 $p_{rms,\infty }^{\prime +}=0.12M+0.08$, can be obtained by fitting these data.
Pressure fluctuation intensities with scaling models (a) at the wall and (b) in the far-field.

3.3. The intrinsic scaling relations of decomposed pressure components
In an effort to discern the respective contributions of vorticity and acoustic modes from the perspective of the generation mechanism of pressure fluctuations, we employ a decomposition method based on the governing equation of pressure fluctuations. This approach enables us to investigate the intrinsic scaling relations. Starting from the governing equations for mass and momentum in a Cartesian coordinate system written as
 \begin{gather} \frac{\partial \rho}{\partial t}+\frac{\partial \rho u_{j}}{\partial x_{j}}=0, \end{gather}
 \begin{gather} \frac{\partial \rho u_{i}}{\partial t}+\frac{\partial \rho u_{i} u_{j}}{\partial x_{j}}=-\frac{\partial p}{\partial x_{i}}+\frac{\partial \tau_{i j}}{\partial x_{j}}, \end{gather}
where  $\tau _{i j}$ is the viscous stress tensor, take the divergence of the momentum equations (3.3) yielding
 \begin{equation} \frac{\partial^{2} p}{\partial x_{i} \partial x_{i}}=-\frac{\partial^{2}}{\partial x_{i} \partial x_{j}}\left(\rho u_{i} u_{j}-\tau_{i j}\right)-\frac{\partial}{\partial x_{i}} \frac{\partial \rho u_{i}}{\partial t} . \end{equation}
By subtracting the average of (3.4) from itself and combining the continuity equation (equation (3.2)), the governing equation of pressure fluctuations can be written as (Gerolymos, Sénéchal & Vallet Reference Gerolymos, Sénéchal and Vallet2007)
 \begin{align} \frac{\partial^{2} p^{\prime}}{\partial x_{i} \partial x_{i}}=\frac{\partial^{2}}{\partial x_{i} \partial x_{j}} \tau_{i j}^{\prime}-\frac{\partial^{2}}{\partial x_{i} \partial x_{j}}\left(2 \rho \tilde{u}_{i} u_{j}^{\prime \prime}+\rho^{\prime} \tilde{u}_{i} \tilde{u}_{j}\right)-\frac{\partial^{2}}{\partial x_{i} \partial x_{j}}\left(\rho u_{i}^{\prime \prime} u_{j}^{\prime \prime}-\overline{\rho u_{i}^{\prime \prime} u_{j}^{\prime \prime}}\right)+\frac{\partial^{2} \rho^{\prime}}{\partial t^{2}}. \end{align}
According to characteristics of the source terms on the right-hand side of (3.5), the pressure fluctuation can be decomposed into several components (Yu et al. Reference Yu, Xu and Pirozzoli2020; Zhang et al. Reference Zhang, Wan, Liu, Sun and Lu2022),  $p^\prime =p_r+p_s+p_\tau +p_c+p_h$. These components individually satisfy
 $$\begin{gather} \frac{\partial^{2} p_{r}}{\partial x_{i} \partial x_{i}}=-2 \frac{\partial \tilde{u}_{i}}{\partial x_{j}} \frac{\partial \rho u_{j}^{\prime \prime}}{\partial x_{i}}, \end{gather}$$
 $$\begin{gather}\frac{\partial^{2} p_{s}}{\partial x_{i} \partial x_{i}}=-\frac{\partial^{2}}{\partial x_{i} \partial x_{j}}\left(\rho u_{i}^{\prime \prime} u_{j}^{\prime \prime}-\overline{\rho u_{i}^{\prime \prime} u_{j}^{\prime \prime}}\right), \end{gather}$$
 $$\begin{gather}\frac{\partial^{2} p_{\tau}}{\partial x_{i} \partial x_{i}}=\frac{\partial^{2} \tau_{i j}^{\prime}}{\partial x_{i} \partial x_{j}}, \end{gather}$$
 $$\begin{gather}\frac{\partial^{2} p_{c}}{\partial x_{i} \partial x_{i}}=\frac{\partial^{2} \rho^{\prime}}{\partial t^{2}}-\frac{\partial^{2}}{\partial x_{i} \partial x_{j}}\left(2 \rho \tilde{u}_{i} u_{j}^{\prime \prime}+\rho^{\prime} \tilde{u}_{i} \tilde{u}_{j}\right)+2 \frac{\partial \tilde{u}_{i}}{\partial x_{j}} \frac{\partial \rho u_{j}^{\prime \prime}}{\partial x_{i}}, \end{gather}$$
 $$\begin{gather}\frac{\partial^{2} p_{h}}{\partial x_{i} \partial x_{i}}=0, \end{gather}$$
where the first two components  $p_r$ and
 $p_s$ are so-called rapid and slow pressures similar to those in incompressible flow, caused by linear mean flow–turbulence interactions and nonlinear turbulence–turbulence interactions, respectively; the viscous pressure
 $p_\tau$ corresponds to the contribution of the viscous stress; the compressible pressure
 $p_c$ accounts for contributions of compressibility which is the principal representation of the essential nature of compressibility effects on the pressure statistics (Sarkar Reference Sarkar1992; Foysi et al. Reference Foysi, Sarkar and Friedrich2004; Tang et al. Reference Tang, Zhao, Wan and Liu2020); and the harmonic pressure
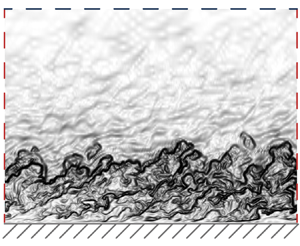
 $p_h$ is introduced to denote the contribution of streamwise boundary conditions (Pope Reference Pope2000). All the right-hand side source terms are obtained by discretization based on the DNS data. The Poisson equations of pressure components are solved by the Fourier–Galerkin scheme in a subdomain of the computational domain as shown in figure 6 with the specific boundary conditions given in table 3. The grid of the subdomain is the same as that of the DNS computation but truncated in the streamwise and wall-normal directions. In the streamwise direction, the subdomain spans over 800 points for all cases except case M8, which increases to 1200 points due to its smaller grid spacing. The location for analysis is at the streamwise midpoint of the subdomain. In the wall-normal direction, the subdomain spans over 280 points starting from the wall, and the wall-normal location of the upper boundary exceeds
 $3\delta$ ensuring acoustic radiation dominants here. Note that due to the evanescent nature of vortex waves and entropy waves out of boundary layers, other pressure components except
 $p_c$ are set to 0 at the far-field boundary, while the propagation nature of acoustic waves is mainly reflected in the compressible pressure
 $p_c$, so that
 $p_c=p^\prime$ is imposed at the far-field.
Schematic for the pressure decomposition. The subdomain of the numerical schlieren of the M8 case is drawn.

Boundary conditions of the pressure fluctuation equations for each pressure component.

According to generation mechanisms of pressure fluctuations from the characteristics of the source terms, the compressible pressure  $p_c$ is used to represent the contributions from the acoustic mode. Meanwhile, the sum of the remaining components,
 $p_i=p_r+p_s+p_\tau +p_h$, is nominally defined as the hydrodynamic pressure (quasi-incompressible component) denoting the contributions from the vorticity mode, resulting in
 $p^\prime =p_i+p_c$. The instantaneous fields of the original pressure fluctuations
 $p^{\prime +}$ as well as the compressible pressure
 $p_c^+$ and hydrodynamic pressure
 $p_i^+$ in wall scaling are depicted in figure 7, taking the M0, M2 and M8 cases as examples for brevity. For
 $p^{\prime +}$ fields in figure 7(a,b), pressure fluctuations are mainly associated with vortex structures within the boundary layer. In the far field, pressure fluctuations radiate as acoustic waves, which are relatively weak in case M0. As the Mach number increases, the amplitudes of radiating pressure fluctuations in the far field become higher. In case M8 depicted in figure 7(c), radiating pressure fluctuations are comparable to those within the boundary layer. For
 $p^+_i$ shown in figure 7(d–f), the same feature of all cases is that all fluctuations seem to be bounded within the boundary layer and rapidly decay to zero out of the boundary layer. The amplitudes of
 $p^+_i$ are comparable to those of
 $p^{\prime +}$ fields for each case. The distributions of
 $p^+_i$ within boundary layers are very similar to those of
 $p^{\prime +}$, except for case M8, in which the acoustic mode becomes much stronger. It can be noted that there are no discernible distinctions in the
 $p^+_i$ field among these three cases. The patterns observed in the spanwise planes are reminiscent of the inclined convective vortex structures depicted in figure 6. For
 $p^+_c$ fields in figure 7(g,h), the characteristics are quite different in that the fluctuations occupy the whole domain, and the acoustic radiations out of the boundary layers are well captured. As
 $M$ increases, the amplitude and characteristic length scales of
 $p^+_c$ gradually become higher and finer, respectively. For case M0, the fluctuation of
 $p^+_c$ is quite weak, and its amplitude is an order lower than that of
 $p^+_i$. The acoustic waves in the streamwise and spanwise planes are shown to be of large wavelengths, aligning with the large-scale patchy patterns at the wall. For case M2, the patchy patterns at the wall become finer, and the acoustic waves out of the boundary layer are inclined due to the Doppler effect. In case M8, the amplitudes of
 $p^+_c$ are much higher and comparable to those of
 $p^{\prime +}$, and the distributions are very similar to those of
 $p^{\prime +}$, suggesting the critical role of
 $p^+_c$ in both the near and far fields for high Mach number cases.
The instantaneous fields of (a–c) the pressure fluctuation  $p^{\prime +}$ (d–f) the hydrodynamic pressure
 $p^+_i$ and (g–i) the compressible pressure
 $p^+_c$. The spanwise, streamwise and wall planes are shown.

Given the distinct convection velocities of vorticity and acoustic modes, space–time correlation functions are computed to assess and quantify this characteristic feature, written as
 \begin{equation} R_{p}(\Delta \boldsymbol{x}, \Delta t)=\left\langle \,p(\boldsymbol{x}, t) p(\boldsymbol{x}+\Delta \boldsymbol{x}, t+\Delta t)\right\rangle. \end{equation}
For the boundary layer growing slowly in the limited analysis domain, the field can be treated as a homogeneous field. Thus, the function  $R_p$ is independent of
 $\boldsymbol {x}$ and
 $t$ at the wall. Here, only the streamwise separation
 $\Delta x$ is considered. As shown in figure 8(a), the normalized correlation functions of original wall pressure
 $R_{p^\prime }$ gradually decay to zero with
 $\Delta x$ and
 $\Delta t$ increasing, forming contours with elongated shapes. The convection velocity
 $u_c$ can be approximated by the slope of the line along which
 $R_{p^\prime }$ decay most slowly. Across all cases,
 $u_c\approx 0.6u_\infty$ at small time delay
 $\Delta t$, and
 $u_c$ slightly increases when
 $\Delta t$ becomes larger, aligning with the findings of Bernardini & Pirozzoli (Reference Bernardini and Pirozzoli2011) and Gloerfelt & Berland (Reference Gloerfelt and Berland2013). This behaviour is attributed to the slower movement of small-scale turbulent structures near the wall and vice versa for larger-scale structures. In figure 8(b), the distributions of
 $R_{p_i}$ closely resemble those of
 $R_{p^\prime }$ with almost identical
 $u_c$, indicating the dominant role of the vorticity mode. For correlation functions of compressible pressure
 $R_{p_c}$, the convection velocity differs significantly, with an increase in the acoustic velocity at the wall, denoted as
 $a_w$, resulting in
 $u_c=0.6u_\infty +a_w$. Moreover, the contour shape also becomes parallel strips with two negative strips flanking both sides. These features are reminiscent of wavefronts and are quite consistent with the propagation nature of acoustic waves. The narrow streak with a small value around
 $\Delta t=0$ results from the harmonic pressure
 $p_h$ for
 $M=8$ case. Although the flow is highly nonlinear and the modes are strongly coupled with each other, the contributions from the acoustic mode and vorticity mode can be reasonably distinguished by utilizing the pressure decomposition method, based on the distinct characteristics of the
 $p^+_i$ and
 $p^+_c$ fields.
The normalized space–time correlation functions of wall pressure fluctuations for the (a) original pressure  $p^\prime _w$, (b) hydrodynamic pressure
 $p_{i,w}$ and (c) compressible pressure
 $p_{c,w}$. Slopes of the reference lines:
 $---$,
 $0.6u_\infty$;
 $-{\cdot }-{\cdot }-$,
 $0.6u_\infty +a_w$ with
 $a_w$ denoting the acoustic velocity at the wall.

Drawing inspiration from the observed scaled relationships of vorticity and dilatation fluctuations in figure 3, it is anticipated that similar scaling laws may exist for pressure fluctuations concerning the vorticity and acoustic modes, which are nominally denoted by hydrodynamic pressure  $p^+_i$ and compressible pressure
 $p^+_c$, respectively. As shown in figure 9(a,b), the profiles of fluctuation intensities of hydrodynamic pressure
 $p_{i,rms}^+$ exhibit uniform behaviour and collapse well with each other, including the profile of the incompressible TBL with a similar Reynolds number
 ${{Re}}_\tau =690$ (Jiménez et al. Reference Jiménez, Hoyas, Simens and Mizuno2010). These profiles share the same evolution trend along the wall-normal direction as the original pressure fluctuations depicted in figure 4, but they gradually diminish towards zero beyond the boundary layer, rather than reaching a plateau. This suggests that there exists a uniform intrinsic scaling wherein the distributions of
 $p_{i,rms}^+$ are in agreement with those of incompressible TBLs and are independent of Mach numbers without taking into account the possible effects of Reynolds number.
Pressure component fluctuation intensities in (a,c) the outer scale and (b,d) the inner scale: (a,b) hydrodynamic pressure  $p_{i,rms}^+$, (c,d) compressible pressure
 $p_{c,rms}^+$. The circles indicate the reference data of an incompressible TBL with
 ${{Re}}_\tau =690$ from Jiménez et al. (Reference Jiménez, Hoyas, Simens and Mizuno2010).

For compressible pressure  $p_{c,rms}^+$ shown in figure 9(c,d), it is also found that the profiles exhibit a clear trend. With increasing
 $M$,
 $p_{c,rms}^+$ is monotonically enhanced and then decays to plateau values as the distance to the wall increases. The plateau values are also proportional to
 $M$. This relationship is in qualitative agreement with that of dilatation fluctuation intensities
 $\theta _{rms}^{\prime +}$ in figure 3(b), implying that the enhancement of
 $p_{rms}^{\prime +}$ near the wall is mainly attributed to the increased genuine compressibility denoted by
 $\theta _{rms}^{\prime +}$. In short, the profiles of pressure fluctuation intensities in compressible TBLs can be mapped onto their counterparts in incompressible TBLs if we physically remove the contribution from the acoustic mode.
To examine the characteristics of pressure components in the wavenumber space, the premultiplied streamwise wavenumber spectra are calculated. As  $M$ increases, the spectra of original pressure
 $k_xE^+_{p^\prime }$ shown in figure 10(a) are overall enhanced. Notably, this enhancement is more pronounced in both the lower left-hand region (near the wall and short wavelength) and the upper right-hand region (outside the boundary layer and long wavelength). These enhancements are attributed to the presence of stronger near-wall small-scale structures and increased acoustic radiation, respectively. For the spectra of hydrodynamic pressure
 $k_xE^+_{p_i}$ in figure 10(b), the distributions are very similar for all cases including the contour shape and peak position. Due to the feature of the vorticity mode, there is no amplitude out of the boundary layer. The variations in
 $k_xE^+_{p^\prime }$ can be clearly reflected by the contours of
 $k_xE^+_{p_c}$ in figure 10(c). For the three subsonic and supersonic cases,
 $k_xE^+_{p_c}$ manifests a dominant wavelength of
 $\lambda _x\sim \delta$, which persists up to the log layer. For the two hypersonic cases, the dominant wavelength shifts to be shorter
 $\lambda _x^+ \sim 100$, confined primarily within the buffer layer. This is because the near-wall small-scale dilatational structures are induced by strong compressibility (Zhang et al. Reference Zhang, Wan, Liu, Sun and Lu2022). Hence, the intrinsic behaviour of
 $p_i$ and monotonic enhancing feature of
 $p_c$ also exist in the wavenumber space.
Premultiplied streamwise wavenumber spectra  $k_xE^+_p$ of the (a) original pressure
 $p^\prime$, (b) hydrodynamic pressure
 $p_i$ and (c) compressible pressure
 $p_c$.

3.4. A potential modelling strategy for pressure fluctuations
Modelling pressure fluctuations in compressible turbulent flows is a challenging task due to the strong coupling of different modes and inherent nonlinearity (Danish, Suman & Srinivasan Reference Danish, Suman and Srinivasan2014). However, with the scaling relations for pressure components found in § 3.3, there is a potential modelling strategy for pressure fluctuation intensity  $p_{rms}^{\prime +}$ by, respectively, modelling pressure components as a function of
 $M$. Initially, due to the square relation
 $\overline {p^{\prime 2}}=\overline {p_i^2}+2\overline {p_ip_c}+\overline {p_c^2}$, the role of the interactions between hydrodynamic and compressible pressure
 $\overline {p_ip_c}$ is assessed, as shown in figure 11. When compared with the mean square of pressure fluctuations
 $\overline {p^{\prime 2}}$, the interactions
 $\overline {p_ip_c}$ are very weak and can be reasonably disregarded for all cases. This conclusion is also supported by our previous study (Zhang et al. Reference Zhang, Wan, Liu, Sun and Lu2022) that the interactions between each component are also very weak. As a result, only the two independent components
 $p_i$ and
 $p_c$ need to be considered for modelling, and then
 \begin{gather} p_{rms}^{\prime+}(M) \simeq \sqrt{(\,p_{i,rms}^+)^{2}+(\,p_{c,rms}^+(M))^{2}}. \end{gather}
The current data for  $p_{i,rms}^+$ and
 $p_{c,rms}^+$ presented in figure 9 are used to construct the model describing the relation between pressure fluctuation intensity and Mach number, denoted as
 $p_{rms}^{\prime +}(M)$. Due to the specific and approximately the same
 ${{Re}}_\tau$ of the DNS data, the
 ${{Re}}$ effects are not considered currently. To account for the multi-inflexion points present in the distribution of
 $p_{i,rms}^+$, a fifth-order rational polynomial is employed to approximate its uniform behaviour. This can be expressed mathematically as follows:
 \begin{gather} p_{i,rms}^+=\frac{\sum_{n=0}^5 a_n\left({y}/{\delta}\right)^n}{\sum_{n=0}^5 b_n\left({y}/{\delta}\right)^n}, \end{gather}
where the specific values of the two coefficients  $a_n$ and
 $b_n$ are listed in table 4. The distribution of
 $p_{c,rms}^+$ is dependent on
 $M$, and it gradually decays to a plateau value
 $C(M)$ outside of the boundary layer, which can be summarized by the linear relation
 $C(M)=0.12M+0.08$, as shown in figure 5(b). After subtracting the plateau value
 $C(M)$, the remaining part is modelled as a power function, resulting in
 \begin{equation} p_{c,rms}^+(M)=\frac{\phi(M)}{\left({y}/{\delta}\right)^{\psi(M)}+\theta(M)}+C(M). \end{equation}
Based on linear fittings, the assumed relations of these parameters can be determined as
 $$\begin{gather} \phi(M)=7.88\times10^{-3}M+3.13\times10^{-2}, \end{gather}$$
 $$\begin{gather}\psi(M)=-1.97\times10^{-1}M+2.10, \end{gather}$$
 $$\begin{gather}\theta(M)=7.56\times10^{-2}M^{-0.596}+7.03\times10^{-2}. \end{gather}$$
Comparisons of intensities of pressure fluctuations  $\overline{p^{\prime2}}$ and interactions between pressure components
 $\overline{p_i p_c}$ in (a) the outer scale and (b) the inner scale.

Coefficients of the rational polynomial for modelling the profile of hydrodynamic pressure.

By utilizing this modelling strategy, a reasonable, simple and semiempirical model has been obtained to predict the dependence of pressure fluctuation intensity on the Mach number  $p_{rms}^{\prime +}(M)$. The performance of this model is illustrated in figure 12. The fifth-order rational polynomial accurately replicates the distribution of hydrodynamic pressure. Furthermore, the model effectively captures the increasing features of compressible pressure both near the wall and out of the boundary layer. As a result, the model can successfully predict the distribution trend of pressure fluctuation intensity in a wide range Mach number, as demonstrated in figure 12(c). It can be seen that modelling pressure with the help of reasonable means of pressure decomposition is a very feasible way. When mapping the compressible profile of pressure fluctuations to the incompressible counterpart, the contribution of the acoustic mode, which needed to be removed, can also be conveniently given by the model (3.10). To quantitatively assess the performance of the current model, following Griffin et al. (Reference Griffin, Fu and Moin2021) the integral relative error is written as
 \begin{equation} \epsilon=100 \frac{\int_0^{1.5\delta}\left|P_{M}-P_{D}\right| \,{{\rm d} y}}{\int_0^{1.5\delta} P_{D}\,{{\rm d} y}}, \end{equation}
where  $P_M$ and
 $P_D$ denote the profiles obtained from the current model and DNS data, respectively. The integral range is chosen from the wall to slightly beyond the boundary
 $(y/\delta =1.5)$ to encompass the entire stages of both rapid change and reaching a steady level of pressure fluctuations. The reference data are obtained from Bernardini & Pirozzoli (Reference Bernardini and Pirozzoli2011) and Duan et al. (Reference Duan, Choudhari and Zhang2016) with a similar moderate Reynolds number
 ${{Re}}_\tau \approx 500$. Figure 12(d) demonstrates that our model performs well, whether based on our own data or the reference DNS data, with a maximum error of approximately
 $\epsilon \approx 7\,\%$. The relatively larger errors at
 $M=4$ and 6 are primarily attributed to the inaccuracies in the linear relationship of
 $p_{rms,\infty }^{\prime +}$ depicted in figure 5(b).
Semiempirical models of fluctuation intensities for (a) hydrodynamic pressure  $p_{i,rms}^+$; (b) compressible pressure
 $p_{c,rms}^+$ and (c) pressure
 $p^{\prime+}_{rms}$. The symbols denote DNS data, the lines denote the results of the model. (d) Integral relative errors with reference data from Bernardini & Pirozzoli (Reference Bernardini and Pirozzoli2011) and Duan, Choudhari & Zhang (Reference Duan, Choudhari and Zhang2016).

4. Summary and discussion
The study investigates the scaling relations between pressure fluctuations and Mach number  $M$ in compressible TBLs by examining their generation mechanisms. A comprehensive dataset of DNS with a broad range of
 $0.5\leq M \leq 8.0$ and comparable friction Reynolds numbers is analysed. By employing the Van Driest transform and Morkovin scaling, the turbulent statistics of velocity fields for different Mach numbers can be effectively mapped onto their incompressible counterparts. Concerning pressure fluctuation intensity, the profiles exhibit scattering, and the intensities generally increase with increasing
 $M$ due to the amplification of genuine compressibility effects and acoustic radiations. As indicators of the vorticity mode and acoustic mode, which contribute to the pressure fluctuations, vorticity fluctuation intensities are minimally affected by increasing
 $M$, while dilatation fluctuation intensities monotonically increase with increasing
 $M$.
Based on the governing equation of pressure fluctuations, these fluctuations are decomposed into distinct components, each corresponding to the characteristics of different source terms and representing different generation mechanisms. The compressible component denotes the contributions of compressibility effects capturing the physics of acoustic waves, and the sum of the rest components is defined as hydrodynamic pressure relating to the contributions of convective vortex structures. This decomposition achieves a reasonable distinction between the contributions to pressure fluctuations from acoustic and vorticity modes. The convection velocity of hydrodynamic pressure agrees with the typical value of convecting vortices  $(u_c\approx 0.6u_\infty )$, while for compressible pressure, it increases to the typical value of acoustic waves
 $(u_c\approx 0.6u_\infty +a_w)$. It is observed that the intensities of hydrodynamic pressure exhibit a uniform profile, collapsing with their incompressible counterpart. In contrast, the intensities of compressible pressure are monotonically enhanced with increasing
 $M$. These scaling relations agree with the observations on intensities of vorticity and dilatation fluctuations. Hence, the profiles of pressure fluctuation intensities in compressible TBLs can be mapped onto their incompressible counterparts by removing the contribution from the acoustic mode, as denoted by compressible pressure. In addition, the interactions between the hydrodynamic and compressible pressure are assessed to be negligibly weak compared with original pressure fluctuations. With the identified scaling relations of the hydrodynamic and compressible pressure, a potential modelling strategy for pressure fluctuations that, respectively, models the pressure components is proposed and applied by fitting the DNS data.
It is worth noting that although the present study is conducted by analysing compressible TBLs at the moderate friction Reynolds number  ${{Re}}_\tau \approx 630$, the explored scaling relations should be qualitatively general in fully developed compressible TBLs since increasing Reynolds numbers do not change the physical natures of the acoustic mode and vorticity mode. Future studies at higher
 ${{Re}}_\tau$ are necessary to explore the influence of Reynolds number effects on the characteristics of the two pressure components.
Acknowledgements
The numerical computations were performed at Hefei Advanced Computing Center.
Funding
This work was supported by the National Natural Science Foundation of China under grant nos. 12402258, 12322210, 92252202, 12172351 and 12388101; the Strategic Priority Research Program of Chinese Academy of Sciences, grant no. XDB0620201; and the Fundamental Research Funds for the Central Universities.
Declaration of interests
The authors report no conflict of interest.



