The financial management of not-for-profit organizations necessitates the use of a broad variety of tools under a set of constraints unique to the sector (Abraham, Reference Abraham2006; Tinkelman and Donabedian, Reference Tinkelman and Donabedian2007; Bowman, Reference Bowman2011; Mosley et al., Reference Mosley, Maronick and Katz2012). This study is the first longitudinal and national empirical analysis of not-for-profits’ defined benefit pension plans and how such plans are used toward the achievement of broader financial objectives. Aside from the importance of understanding pension funding behaviors from the human resources perspective – related to how not-for-profits compensate their workforce – this study provides insight into how such employee benefits are incorporated into the broader financial strategy of the organization. In order to capture the strategic element, rather than studying funding levels, this study incorporates the elements of pension funding that involve more managerial discretion: excess pension funding contributions, the discount rate used to calculate pension liabilities, and the expected rate of return on pension assets. Beyond the unique pension context, this study extends the not-for-profit financial management literature by incorporating and testing several different strategic managerial and financial objectives and extending the limited literature on earnings management in not-for-profits beyond the hospital sector.
Pension management has a robust literature in public finance, but studies in the not-for-profit sector are sparse; this is especially surprising in relation to the prevalence of plans and involved assets in the not-for-profit sector. Between 1990 and 2006, between 1.3 and 1.6 million not-for-profit employees were covered each year by a defined benefit pension plan, representing approximately 15–21% of the estimated national not-for-profit workforce during this period.Footnote 1 In the not-for-profit healthcare sector, approximately 21–30% of the workforce is covered by a defined benefit pension plan.Footnote 2 Understanding how not-for-profits manage these defined benefit pension plans, therefore, is relevant for a significant portion of the sector's labor force.
We draw on literature in both private and public finance and accounting to identify possible motivations for the manipulation of pension-related elements. Eldenburg et al. (Reference Eldenburg, Gunny, Hee and Soderstrom2011) found evidence of earnings management in not-for-profit hospitals; we would therefore expect to find evidence of earnings manipulation across the sector, both in terms of achieving earnings targets and in minimizing possible tax exposure. We would also expect evidence of consumption smoothing, despite difficulty accumulating net assets by not-for-profits (Calabrese, Reference Calabrese2013). Finally, the not-for-profit literature is filled with studies on the impacts of particular revenue sources on financial health and practice (Andreoni and Payne, Reference Andreoni and Payne2003; Tinkelman, Reference Tinkelman2010; Mayer et al., Reference Mayer, Wang, Egginton and Flint2014). We use information from both the 5500-CRR database compiled by the Center for Retirement Research (CRR, 1990–2007) at Boston College and from the Statistic of Income (SOI) data compiled by the National Center on Charitable Statistics (NCCS) to test hypotheses on each of these possible strategies articulated in extant literatures.
The empirical results indicate a variety of behaviors. Not-for-profit pension plan sponsors use excess pension contributions to manage reported profits downwards when they exceed profit targets; when these sponsors fail to meet profit targets, however, they minimize excess contributions to enhance reported profitability. In the latter case, we find evidence that alteration of actuarial assumptions is also used to buoy financial performance. Though revenue types are surprisingly irrelevant in the strategic use of excess pension contributions, we do find that not-for-profit pension plan sponsors use net assets to smooth consumption, with expected excess contributions increasing (or decreasing) with increasing (or decreasing) levels of net assets.
The paper first introduces the background and theoretical motivations of the study, relying on existing theory from accounting and finance. Hypotheses and expectations are then articulated based on these theories. The section ‘Data’ describes in detail the data used for the empirical analysis, and the section ‘Methodology, model specification, and variable definitions’ describes the methodology and variable definitions. The section ‘Descriptive findings’ presents summary statistics on the variables used, and also descriptive information on the sample of not-for-profits with pension plans from 1990 through 2006. The section ‘Empirical results’ presents the results of the empirical analyses, and the final section concludes and suggests future research on the topic.
Pension funding: required and discretionary contributions
We first briefly outline the basics of pension funding for private corporations so that we can subsequently discuss how pensions may be incorporated into the financial strategy of a not-for-profit entity. Defined benefit pension plans are established to segregate certain assets of a firm to fund retirement benefits earned by employees. The Department of Labor (DOL) regulates private (for-profit and not-for-profit) corporations’ pension plans under the Employee Retirement Income Security Act of 1974 (ERISA), which includes oversight of total annual required contributions to the pension plan by sponsors. Corporations with overfunded pension plans (i.e., plans with assets in excess of estimated liabilities) are not required to make annual contributions; corporations with underfunded pension plans (i.e., plans with estimated liabilities in excess of assets) are required to make contributions for the benefits accrued by current employees (the normal cost) plus some fraction of any accumulated underfunding (Rauh, Reference Rauh2006). This normal plus supplemental cost is termed the annual mandatory funding contribution (MFC). Hence, the annual MFC for an organization with a fully or overfunded pension plan is $0.
The Pension Protection Act of 1987 changed funding requirements for sponsors. The law increased sponsor contributions to more rapidly ‘catch-up’ on past shortfalls – termed the deficit reduction contribution (DRC) – so that the larger the underfunding, the larger the required funding from the sponsor (Rauh, Reference Rauh2006). The 1994 Retirement Protection Act exempted well-funded plans (those pension plans that were more than 90% funded) and further increased the lowest DRC rate. A pension sponsor's required contribution to its pension plan in any given year under ERISA, then, is the greater of the MFC or the DRC. Sponsors may choose to contribute more to their pension plans than the required contribution or not at their own discretion, and these excess contributions may serve particular management objectives.
Because these pension benefits are funded and then paid out over long periods of time, actuaries hired by pension plan sponsors make many assumptions that affect the normal cost, the value of pension assets and liabilities, and the supplemental cost. These actuarial assumptions include both demographic factors – related to changes in a pension plan's population such as mortality rates, retirement ages, etc. – and economic factors – such as inflation effects, rates of investment return, etc. (McGill et al., Reference McGill, Brown, Haley, Schieber and Warshawsky2010). One of the most critical economic actuarial assumptions is the discount rate used to calculate the accrued pension liability. A higher discount rate results in a smaller reported pension liability, and a lower discount rate with a larger liability. Having smaller pension liabilities with a higher discount rate translates into lower required annual pension contributions – either because the system is considered fully funded with fewer accumulated assets, or because the amortization of the unfunded portion of the pension liability is smaller; on the other hand, a lower discount rate works in the opposite direction to increase required annual pension contributions. An additional critical assumption is the long-term rate of return of pension assets, which is the average rate of earnings expected on current and future pension assets. Similar to the discount rate, a higher assumed long-term rate of return on assets reduces current required annual contributions and a lower rate increases current required annual contributions.
In addition to excess or minimal actual funding, plan sponsors might change these actuarial assumptions to increase or decrease required annual pension contributions. Similar to actual funding changes, this behavior may reflect certain strategic objectives of management (Chen and Matkin, Reference Chen and Matkin2017).
Incentives to strategically use pension contributions
Limited current literature examines the incentives not-for-profits face with respect to pension contributions. The for-profit corporate literature, however, finds that managers strategically minimize or contribute excess pension contributions to meet objectives beyond simply the funding of employee retirement benefits. Because pension plan sponsors have some degree of discretion about how pension contributions are calculated and funded, these contributions can be used to manage the reported earnings and financial information reported to external stakeholders. Here, testable hypotheses about how not-for-profits alter pension contributions to meet strategic objectives are developed.
Earnings management
The for-profit literature has examined earnings management behavior used to smooth reported profitability over time to avoid reporting operating losses. Managers might use discretionary accruals to achieve desired financial results (Dechow, Sloan, and Sweeney, Reference Dechow, Sloan and Sweeney1995), or they may make actual spending and activities changes (Roychowdhury, Reference Roychowdhury2006; Zang, Reference Zang2011). For-profit managers are concerned about meeting earnings benchmarks because their compensation, career paths, and reputations are critically affected by reported profitability (Graham et al., Reference Graham, Harvey and Rajgopal2005).
Several empirical studies focus on managing reported profitability in not-for-profit organizations. Whereas early theories about not-for-profit organizations assumed surpluses were mostly accidental and not a strategic goal,Footnote 3 empirical research since confirms that profits are in fact an objective for not-for-profit managers (Chang and Tuckman, Reference Chang and Tuckman1990; Calabrese, Reference Calabrese2012),Footnote 4 serving as reserves, seed money for programmatic expansion, or funds for personal benefit (such as increased compensation).
Despite the importance of surpluses to managers, disclosing profits in financial reports may increase the political costs to the organization through increased scrutiny from public regulators, donors, and other stakeholders. Leone and Van Horne (Reference Leone and Van Horne2005) note that hospital profitability deemed excessive has resulted in state Attorneys General actions. To reduce this probability, they find that not-for-profit hospitals increase charity care when profits increase, so that reported net income is lower. Eldenburg et al. (Reference Eldenburg, Gunny, Hee and Soderstrom2011) find that not-for-profit hospitals change spending on non-operating and non-revenue generating activities if profits or losses are outside some acceptable target range. These changes tend to be reversed in the subsequent fiscal year, suggesting earnings management rather than prudence. Hoerger (Reference Hoerger1991) finds less variability in reported profitability by not-for-profit hospitals relative to for-profits, which is consistent with the notion of earnings management. This finding is supported by Leone and Van Horn (Reference Leone and Van Horne2005) who find operating income after discretionary accruals is much smoother (i.e., has less variation) than earnings before.
Parsons (Reference Parsons2003) notes that donors prefer to contribute to not-for-profits that are going concerns, suggesting not-for-profits have an incentive to avoid reporting losses. Further, avoiding losses reduces a hospital's cost of debt (Trueman and Titman, Reference Trueman and Titman1988) – which is especially important for not-for-profits given the lack of equity investors in the sector. Overall, then, not-for-profits have an incentive to manage their reported earnings to avoid the costs associated with being deemed too profitable or not a going concern, and pension contributions are an obvious but unexamined mechanism for achieving this goal. Further, pension contributions can accomplish this goal either through actual funding decisions (such as increasing or minimizing contributions to pension plans) or through changing how the required contribution is calculated (such as changing the actuarial assumptions used to calculate the pension expense). Vermeer et al. (Reference Vermeer, Edmonds and Asthana2014) find evidence that not-for-profits in Maryland with defined benefit pension plans use actuarial assumptions to reduce reported pension liabilities.
H1A:
All else equal, not-for-profits will increase (minimize) pension contributions when profitability is above (below) target.
H1B:
All else equal, not-for-profits will change actuarial assumptions to increase (minimize) pension contributions when profitability is above (below) target.
Consumption smoothing
Because not-for-profit organizations can increase or minimize contributions as well as alter how required contributions are calculated, pensions also assist managers with smoothing consumption decisions over time. Modigliani and Brumberg (Reference Modigliani and Brumberg1954) theorize that current consumption is dependent upon current income and accumulated wealth from the past. Critically, it is this accumulated wealth that allows individuals to alter consumption up or down as income varies. In a similar vein, not-for-profit managers may want to smooth consumption over the organization's lifetime, and accumulated wealth permits this consumption. Such consistency makes financial planning easier, permits the organization to navigate the natural fluctuations in the business cycle, and allows a steady and predictable provision of goods and services to clients.
Consumption smoothing using pension contributions can be opaque because the plan sponsor cannot directly consume the pension assets. Prior research confirms that pension contributions by corporations do vary over time (see, e.g., Bodie et al., Reference Bodie, Light, Morck, Taggart, Bodie, Shoven and Wise1987). Pension contributions are increased and actuarial assumptions are made more conservative when firms have more wealth, leading to increased funding of the pension system. When the firm has deficient wealth, pension contributions can be minimized and actuarial assumptions made less conservative. While this does not result in funds being directly withdrawn, it allows the plan sponsor to reduce pension contributions and increase available wealth during these periods – so-called ‘slow withdrawals’ from the pension system (Thomas, Reference Thomas1989).
H2A:
All else equal, not-for-profits will increase (minimize) pension contributions as accumulated wealth increases (decreases).
H2B:
All else equal, not-for-profits will change actuarial assumptions to increase (minimize) pension contributions when accumulated wealth increases (decreases).
Revenue effects
Not-for-profits face different political costs for financial decisions depending upon the markets in which they earn revenues. Hansmann (Reference Hansmann1980) notes that the non-distribution constraint is essential for attracting voluntary contributions. In 2009, total contributions to public charities in the USA amounted to $304 billion, nearly 20% of sector revenues, with nearly 75% coming from individuals and households (Giving USA, 2010). Donors are frequently thought of as acting like investors in for-profit firms – by providing not-for-profits with necessary equity infusions to further mission services (Gentry, Reference Gentry2002). Unlike for-profit investors, though, donors to not-for-profit organizations cannot remove donated capital if they wish to invest it elsewhere. Fama and Jensen (Reference Fama and Jensen1983) note that despite this inability to remove past donations, donors making large contributions frequently serve on not-for-profit boards, effectively giving them control over how the donation is used. Even those that do not serve a governance role have an incentive to ensure that a not-for-profit uses donation revenue to carry out the organization's mission (Core et al., Reference Core, Guay and Verdi2006). Krishnan and Yetman (Reference Krishnan and Yetman2011) find that not-for-profit hospitals more dependent upon donations shift more costs to reported program services than those with more commercial revenues, suggesting that not-for-profits alter reported financial information to minimize the political costs from donors.
Not-for-profits reliant upon donations, then, have a strong incentive to manage reported earnings to ensure current and future donations are maintained. In addition to Parsons's (Reference Parsons2003) suggestion that donors prefer to fund going concerns, Yetman (Reference Yetman and Young2007) argues that donors prefer to fund current operations rather than prior obligations; this suggests that donors may also view operating deficits negatively, and would incentivize not-for-profits to avoid reporting losses. Not-for-profits dependent upon donations would be expected to alter pension contributions based on financial performance. Yetman and Yetman (Reference Yetman and Yetman2012) find average donors discount program spending ratios when the manipulation is obvious, while sophisticated donors are also able to discern even more complex manipulations. Altering pension contributions is complex, suggesting that most donors would not discern the change. This would be consistent with the for-profit literature as well, in which Picconi (Reference Picconi2006) and Franzoni and Marin (Reference Franzoni and Marin2006) find pension information is not fully absorbed by market participants.
H3A:
All else equal, not-for-profits will increase (minimize) pension contributions to reduce reported profits (losses) as donations increase.
H3B:
All else equal, not-for-profits will change actuarial assumptions to increase (minimize) pension contributions to reduce reported profits (losses) as donations increase.
While much of the existing literature focuses on the role of private donors to not-for-profits, governments are increasingly important funders for the sector as a whole (Salamon, Reference Salamon1987; Lipsky and Smith, Reference Lipsky and Smith1989), and accounted for nearly one-quarter of all revenues for the sector in 2008 (Wing et al., Reference Wing, Roeger and Pollak2010). These funding arrangements might be fee-for-service arrangements, grants, or contracts to provide specific public goods or services (Smith and Gronbjerg, Reference Smith, Gronbjerg, Powell and Steinberg2006).
A relatively robust public finance literature exists that documents how private individuals voluntarily contribute to public service provision (see Brunner and Sonstelie, Reference Brunner and Sonstelie2003). Donors frequently give to improve the provision of the public goods or to accrue some private benefit such as prestige (Nelson and Gazley, Reference Nelson and Gazley2014), implying that the government-provided amount is insufficient to these donors. Similarly, government funding to not-for-profits to provide public or collective goods frequently do not cover costs, or may result in service quality that the not-for-profit service provider finds substandard. According to one recent study, two-thirds of not-for-profits reported that government contracts do not cover the full costs of the services provided by the not-for-profit (Boris et al., Reference Boris, de Leon, Roeger and Nikolova2010); as a result, not-for-profits may contribute their own private resources to provide these public services (Marwell and Calabrese, Reference Marwell and Calabrese2015) and manage financial performance to appear viable to public funders. Similar to individuals, organizations might wish to improve the quality of the services they are providing for the government, or for the prestige of providing some public good. Not-for-profits, therefore, may minimize pension contributions or liberalize actuarial assumptions so that their contributions to these publicly-financed programs do not result in reporting operating deficits.
H4A:
All else equal, not-for-profits will minimize pension contributions to avoid losses as public funds increase.
H4B:
All else equal, not-for-profits will change actuarial assumptions to minimize pension contributions to avoid reported losses as public funds increase.
Tax incentive
Contributions to defined benefit pension funds are considered operating expenses that reduce the reported profitability – and related corporate tax liability – of the firm.Footnote 5 Therefore, pension contributions are able to earn a pre-tax rate of return on investments, suggesting that firms should fully fund pension plans to maximize tax benefits, and actuarial assumptions should be set to maximize contributions to the pension fund. Pension funds’ tax-advantaged position allows them to earn these higher returns with no corresponding tax liability. For firms that are unprofitable and risky, this tax shelter incentive is weak because there may be no tax liability from which to shelter income; on the other hand, firms that are profitable and stable have a strong reason to maximize contributions to their pension systems. Existing research finds strong support for this incentive.
Because not-for-profits are exempt from income and corporate taxation on profits and the non-distribution constraint requires not-for-profits to retain these profits for charitable purposes, the tax shelter incentive may seem unimportant to not-for-profits with pension systems. In general, this is accurate. However, Denison (Reference Denison2009) notes that not-for-profits with unrelated business income are subject to taxation on profits generated by these ventures, and Omer and Yetman (Reference Omer and Yetman2003) find that not-for-profits try to reduce such unrelated business income tax. Therefore, not-for-profits with significant unrelated business activity do potentially have an incentive to maximize pension contributions (directly or through conservative actuarial assumptions) to reduce tax liabilities.
H5A:
All else equal, not-for-profits will increase pension contributions as unrelated business income increases.
H5B:
All else equal, not-for-profits will change actuarial assumptions to maximize pension contributions as unrelated business income increases.
Data
Data on pension plans come from the 5500-CRR database compiled by the Center for Retirement Research (CRR, 1990–2007) at Boston College (CRR, multiple years). CRR compiled the data from the DOL Form 5500, which pension plan sponsors with more than 100 participants on the first day of the year are required to file annually for the years 1990 through 2007. Pension plans sponsored by religious organizations are exempt from the annual filing requirement. The Form 5500 contains pension plan-level information, the normal cost, the funding status, actuarial information (in schedule B), and financial information (in schedule H), among other information. The 1990 Form 5500 is the initial year for which each pension plan's funded status is standardized; further, legislation in the late 1980s and 1990 made termination of well-funded pension plans more difficult (Rauh, Reference Rauh2006), meaning that the time period captures the vast majority of the defined benefit pension plans possible. In 2006, President Bush signed the Pension Protection Act into law, with significant changes to defined pension reporting. In the same year, the Financial Accounting Standards Board (FASB) issued Statement No. 158, which also significantly altered the financial reporting requirements for defined benefit sponsors. As a result of these significant policy and reporting changes, the analysis ends with 2006.
To identify not-for-profit pension plan sponsors, the Form 5500 data were merged with the SOI database from the NCCS. This database is limited to 501(c)3 not-for-profits, and includes the Form 990 data for all large organizations (defined as having $10 million in assets or more) plus a sampling of smaller organizations. As such, the SOI data include the vast majority of not-for-profits likely to sponsor a pension plan. Further, the IRS verifies much of the SOI data, making it the most reliable Form 990 data available (Feng et al., Reference Feng, Ling, Neely and Roberts2014).
The SOI data contain the financial characteristics of the not-for-profit pension plan sponsors in the sample. Organizations with over $25,000 in annual revenues are required to file the Form 990; similar to the Form 5500, religious organizations are exempt from the filing requirement. Most importantly, the Form 990 databases maintained by the NCCS are the only available databases with standardized financial information on registered public charities across many years. Not-for-profit organizations are required to make their Form 990 information publicly available but are under no obligation to release their audited financial statements. All financial data are inflation-adjusted using the CPI (Consumer Price Index).
Following Rauh (Reference Rauh2006), not-for-profits with multiple pension plans with the same fiscal-year end dates are aggregated to the organizational level. However, because plans cannot be used to fund other plans within an organization, separate statistics are maintained for overfunded and underfunded pension plans.
In 1999, the federal government hired a private vendor to manage new electronic filing requirements for the Form 5500, and the 1999 and 2000 data have some missing filings resulting from this change (Buessing and Soto, Reference Buessing and Soto2006). In 1999, 350 individual files are missing, and 354 in 2000 are missing. Missing values for these two years are linearly interpolated rather than losing observations; in addition, 1,346 individual year gaps (or about 6% of the total sample) in other Form 5500 filings are also interpolated similarly. The sample consists of 19,611 observations covering 2,246 individual not-for-profit pension plan sponsors. All empirical estimations are tested with and without the imputed values to ensure robustness; results are unchanged with the inclusion of the interpolated data. Variables are winsorized at the 1% level to reduce the potential influence of outliers in the data.
Most of the not-for-profit pension plans are active during the 1990–2006 time period. Only 2% of the sample are identified as terminated, and an additional 2% as frozen during the time period. Therefore, of the 19,611 observations, 18,772 are active during the time period and used in the empirical analyses.
Methodology, model specification, and variable definitions
The intent of the analyses is to understand why not-for-profit pension plan sponsors vary their annual pension contributions, and whether these plan sponsors alter actual contributions or alter how required contributions are calculated to change contributions as desired. The theoretical framework motivates the following model:
 $$DV_{i,t} = \; \beta _0 + \; \beta _1 EM_{i,\; t} + \beta _2 CS_{i,\; t} + \; \beta _3 RE_{i,\; t} \; + \; \beta _4 TI_{i,\; t} + \; \alpha _t + \; \alpha _i + \; \varepsilon _{i,t} $$
where DVi,t measures annual excess pension contributions, the discount rate used for discounting pension liabilities, or the long-term rate of return on plan assets. By analyzing all three choice variables, equation (1) assesses the trade-offs not-for-profit managers consider with respect to pension contributions (directly, or in their computation). The vectors in equation (1) include measures for each of the hypothetical motivations outlined – earnings management, consumption smoothing, revenue effects, and tax incentives. Plan sponsor (α t) and year (α i) effects are included to control for other unobserved factors that might influence pension funding, such as governance structures of the sponsor, larger macroeconomic events, state regulatory regimes, etc.Footnote 6 The variation being analyzed in this strategy, therefore, is the variation within the same not-for-profit pension plan sponsor over time. Errors are clustered at the plan sponsor level to allow correlation within the sponsor while assuming zero correlation between sponsors.
Dependent variables
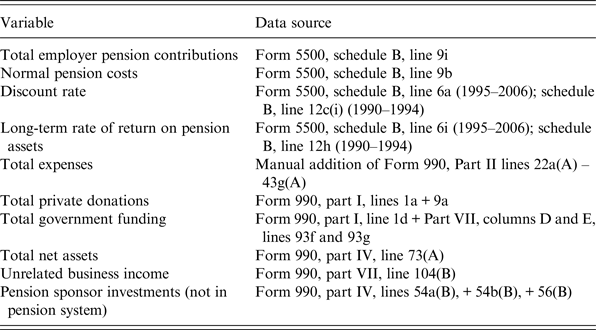
The statistical analyses use three dependent variables. Variable data sources are included in Table 1, and a summary of all measures is included in Table 3.
Variable data sources

Sources noted in the table.
Excess pension contributions
Following Rauh (Reference Rauh2006), the MFC in year t for not-for-profit i is calculated as the normal cost (found on schedule B of the Form 5500) plus 10% of beginning of year underfunding (calculated as the difference in beginning year assets and liabilities from the Form 5500). For significantly underfunded pension plans, the Pension Protection Act of 1987 set the DRC to min{0.30, [0.30 − 0.25*(funding status – 0.35)]} where the funding status is the ratio of pension assets to liabilities (Rauh, Reference Rauh2006). The 1994 Retirement Protection Act increased the lowest DRC rate to min{0.30, [0.30 − 0.40*(funding status – 0.60)]}.
As noted earlier, a not-for-profit pension sponsor's required contribution to its pension plan in any given year under ERISA is the greater of the MFC or the DRC. An organization may choose to contribute in excess of this required contribution, and this excess contribution is calculated as the difference between the not-for-profit's total contribution to the pension plan in year t less the required contribution (either the MFC or the DRC).Footnote 7 This measure of voluntary excess additional contributions by not-for-profits to their pension plans is the measure used in the empirical analyses. It captures the organizational choice to fund in excess of legal minimums.
Actuarial assumptions
A higher discount rate results in a smaller reported pension liability and smaller required contributions as a result, and a lower discount rate with a larger liability and larger required contributions. The discount rate comes from schedule B of the Form 5500. Because not-for-profits with multiple plans were combined into a single entity for analysis, the discount rate is calculated as the weighted average of the discount rate for each plan based on the ratio of pension liabilities of each plan to total combined pension liabilities.
In addition to the discount rate, the expected long-term rate of return on assets is also used as a dependent variable because Bergstresser et al. (Reference Bergstresser, Desai and Rauh2006) note that this actuarial assumption is more controllable by management.Footnote 8 In other words, the long-term rate of return on assets may reflect managerial discretion more directly than the discount rate. A higher expected rate of return results in smaller required contributions, and a lower expected rate of return results in larger required contributions. Like the discount rate, this variable comes from schedule B of the Form 5500, and is the weighted average for each plan based on the ratio of pension assets for those sponsors with multiple plans.
All three dependent variables are highly skewed, and so they are transformed into natural logs to normalize the data. Because some of the values were zero, a constant 0.01 was added to the data prior to transformation rather than losing these observations and producing gaps in the time series.
Independent variables
Hypothesis 1 related to earnings management is measured using two variables adapted from Eldenburg et al. (Reference Eldenburg, Gunny, Hee and Soderstrom2011). The expected net income of not-for-profit i in year t is measured as the annual change in net assets, except that the current year's discretionary excess pension contribution is removed and replaced with the previous year's discretionary excess pension contribution.Footnote 9 When this projected net income is between 0% and 4% of total revenues, these not-for-profits are deemed to have no incentive to manage earnings and are not expected to alter pension contributions as a result. Organizations with reported profits in excess of 4% have an incentive to increase excess pension contributions to reduce reported profitability, and the variable INCREASE is coded 1 for these entities and 0 for all others. Not-for-profits with an operating deficit have an incentive to minimize pension contributions to reduce this deficit, and the variable DECREASE is coded 1 for these entities and 0 for all others.Footnote 10
Hypothesis 2 related to not-for-profits increasing (minimizing) pension contributions as wealth increases (decreases), is measured using total net assets in year t for organization i. Net assets are the not-for-profit equivalent of owner's equity in for-profit companies. Total net assets measure the total accumulated wealth owned by a not-for-profit organization that might be added to the pension system; alternatively, inadequate net assets might lead to minimizing pension contributions to maintain another organizational spending. This variable, because of the distributional skew, is also transformed using the natural logarithm with a constant added to avoid zeroes.
Revenue effects are measured by including two variables. Private donations are measured as the sum of contributions from individuals (excluding from government sources) and gross revenue from special events (such as annual fundraising events) in year t for organization i. Government funding is measured as the sum of government grants and revenues from other public sources in year t for organization i. The measure includes contracting fees, fee-for-service arrangements, and grants. The data do not include Medicare and Medicaid revenues because the data fields included in Form 990 are not reliable.Footnote 11 The measure used here, therefore, is conservative and biased toward not finding an association with pension management. Both revenue effect variables are transformed using natural logs with a constant added to avoid zeroes.
The tax incentive is measured using the amount of unrelated business income reported by not-for-profit i in year t. As with other variables with a distributional skew, this variable is normalized using natural logs with a constant.
Control variables
Two additional control variables are included. Unlike for-profit entities, not-for-profits may own endowments, which are assets invested to produce revenues for organizations (Calabrese and Ely, Reference Calabrese and Ely2017). Bowman (Reference Bowman and Young2007) notes that the income generated from endowment ‘puts a floor under spending’ (p. 277–278), implying that it aids in smoothing consumption as well. The SOI data do not report on endowments until 2008, however. To infer the existence of endowment, Bowman et al. (Reference Bowman, Tuckman and Young2012) suggest that not-for-profits with total investments greater than annual spending be considered ‘presumptively endowed.’ We include a measure for presumptively endowed using this technique to capture if organization i becomes endowed in year t; if never endowed or always endowed, the organizational fixed effect acts as the control. Finally, size is controlled by including a measure of total expenses for organization i in year t. Total expenses are normalized using natural logs.Footnote 12 Table 1 identifies the data sources for variables.
Descriptive findings
Which not-for-profits sponsor defined benefit pension plans?
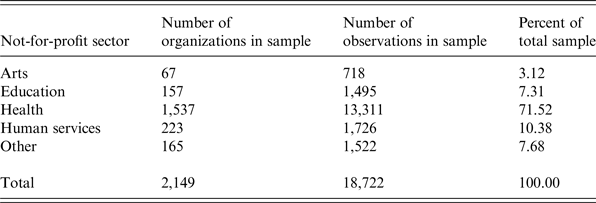
Because no existing research analyzes national not-for-profit pension plan sponsors across subsectors, the first analysis examines to which industries not-for-profit pension plan sponsors belong. Using the IRS's National Taxonomy of Exempt Entities (NTEE) five major codes, Table 2 identifies the types of not-for-profits that sponsor defined pension plans for employees. Table 2 shows that health not-for-profits make up the bulk of the plan sponsor sample (nearly 72%). Nearly 92% of this health sample is not-for-profit hospitals. Human service organizations make up more than 10% of the sample, education not-for-profits comprise 7% of the sample, and other not-for-profits (which is a composite category that includes international, public and societal benefit, religiously-affiliated, mutual and membership, and unknown not-for-profits) comprise nearly 8% of the sample. The remaining organizations are arts not-for-profits.
Description of not-for-profit pension plan sponsors

Source: Authors’ calculations.
Funding trends of pension plans sponsored by not-for-profits
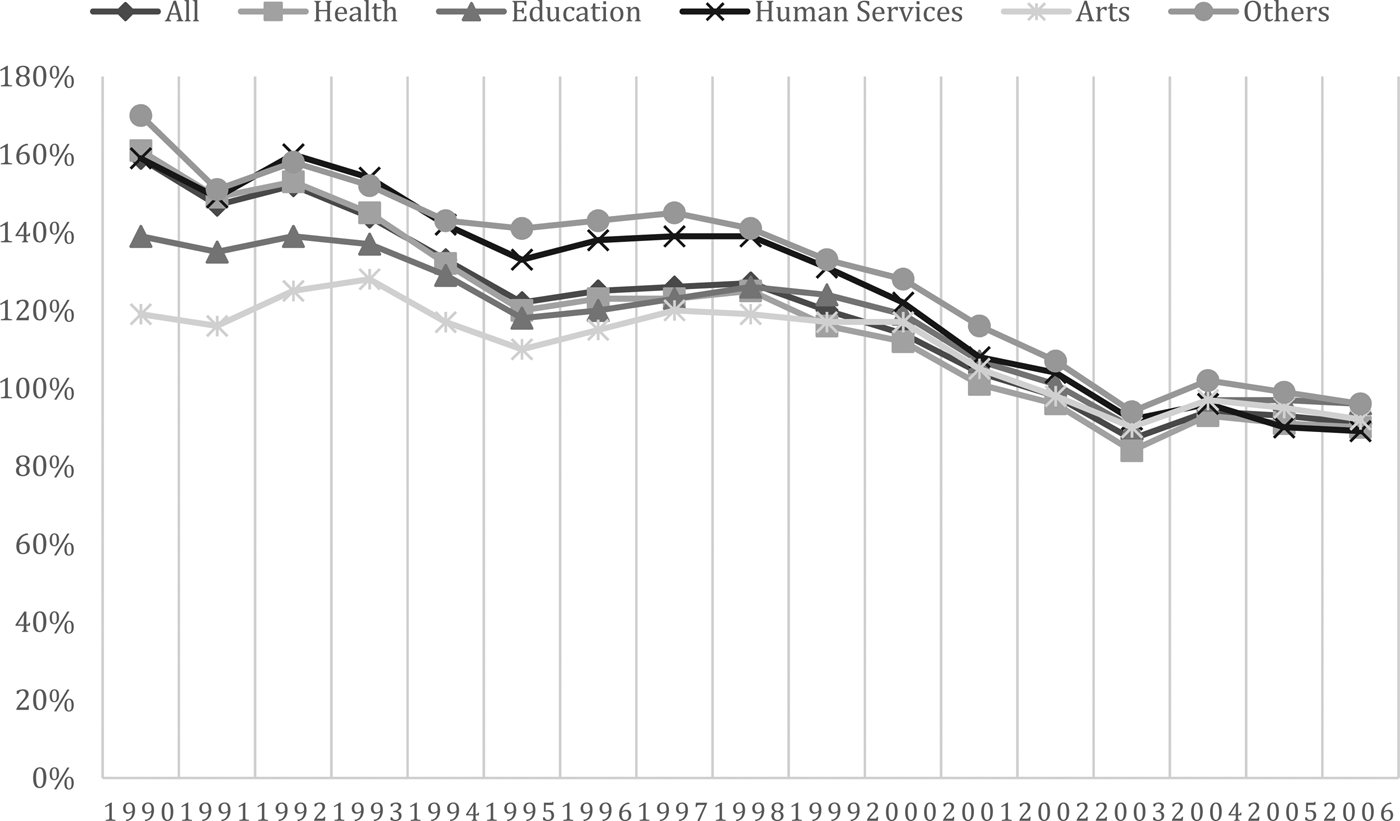
Figure 1 describes the average trend in the funded ratio (i.e., the comparison of plan assets to plan liabilities) for not-for-profit pension plans from 1990 through 2006. Figure 1 reports the average funded ratio for the sector as a whole, and also reports inter-sector variation. The 1990 mean funded ratio was 159%, meaning the average not-for-profit pension plan was overfunded and is comparable with the funded ratio of corporations presented in Bodie et al. (Reference Bodie, Light, Morck, Taggart, Bodie, Shoven and Wise1987).Footnote 13 Further, all the sectors were overfunded. The overall trend downwards is significant, with the overall funding ratio reaching 91% in 2006. Vermeer et al. (Reference Vermeer, Edmonds and Asthana2014) find average funding ratios in Maryland not-for-profits of 83% in 2009, which suggests that the fiscal health of these plans have continued to decline. Again, all sectors have seen significant declines, although the funded ratio is still relatively healthy when viewed at individual points in time. By 2006, however, nearly one-quarter of the pension systems sponsored by not-for-profits was funded at 80% or less. This suggests that a non-trivial portion of the not-for-profit sector with defined benefit pension plans may face either increasing pressure to better fund or to freeze or terminate plans.
Aggregate mean funding ratio for not-for-profit pension plans, 1990–2006. Source: Authors' calculations. The funding ratio is defined as the current value of pension assets at beginning of year/pension liability (OBRA87 liability for 1990–1994; RPA94 liability for 1995–2006).

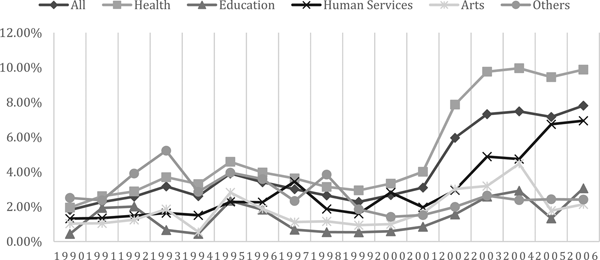
Figure 2 reports the average ratio of pension contributions to total expenses for not-for-profits from 1990 through 2006. Figure 2 shows the importance of pension contributions relative to total spending, and how this has changed over time. Like Figure 1, the data report the sector overall and also subsectors. Perhaps more importantly, total pension contributions as a percentage of total expenses have increased significantly between 1990 and 2006. Such contributions were less than 2% of total expenses in 1990, but increased to nearly 8% by 2006. Health organizations’ pension expenses grew to more than 7% of expenses, and nearly 10% between 2003 and 2006. Human service not-for-profits saw pension expenses increase to nearly 7% of expenses, up from less than 1.5% in 1990. Figure 2 shows that most not-for-profit organizations in all sectors experienced sharp increases in pension expenses relative to total expenses. Taken together, Figures 1 and 2 show declining funding ratios while pension demands for an increased share of total expenses sharply increased at the same time. These two trends are obviously related. Both also are suggestive that pensions have the potential to crowd-out other spending priorities for these organizations, similar to what governments are currently facing with their own pension systems.
Aggregate pension contributions to total expenses for not-for-profits, 1990–2006. Source: Authors' calculations. The ratio of pension contributions to total expenses is defined as total not-for-profit contributions to defined benefit pension plans/total annual expenses in that same year.

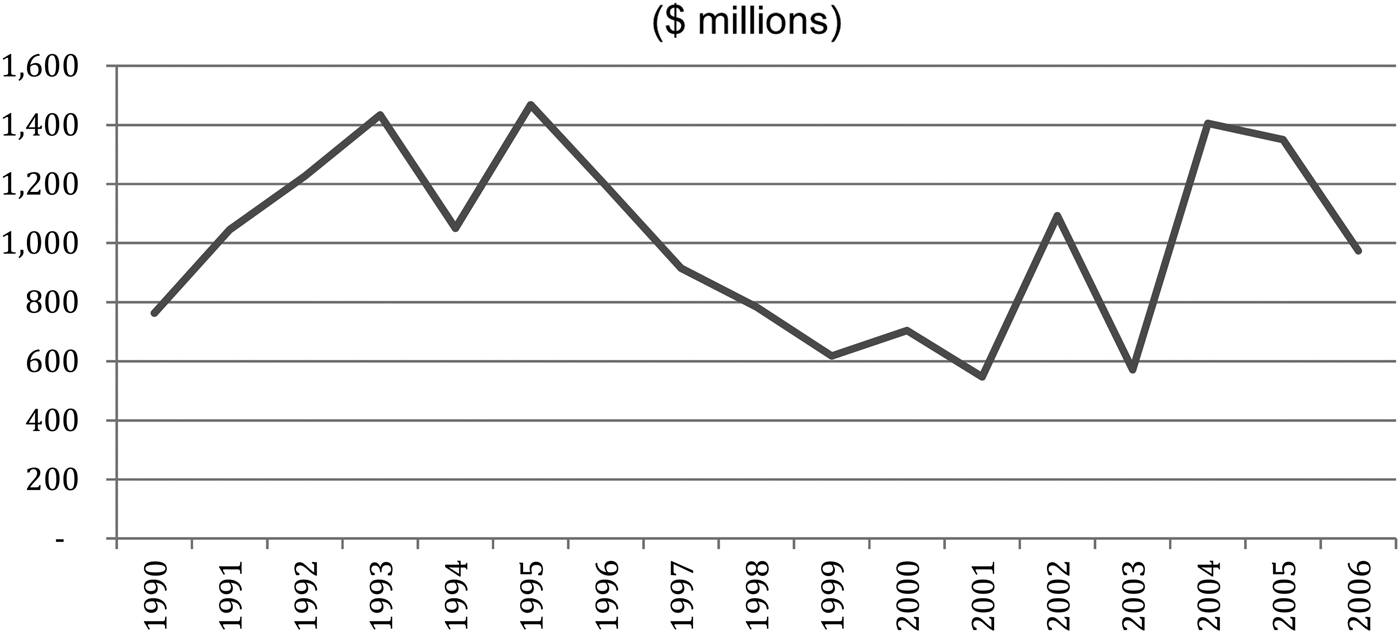
Not-for-profit organizations display variation in the amount of excess contributions annually devoted to defined benefit pension plans. Figure 3 graphically displays total annual excess contributions for not-for-profit organizations for 1990–2006. The figure shows a fairly steep decline from the mid-1990s through 2001 – spanning a time of robust economic growth for the nation. Unlike during the 1990s economic expansion when excess contributions declined, Figure 3 indicates that excess contributions actually increased sharply following 2003.
Total estimated pension excess contributions, 1990–2006. Source: Author's calculations.

Summary statistics
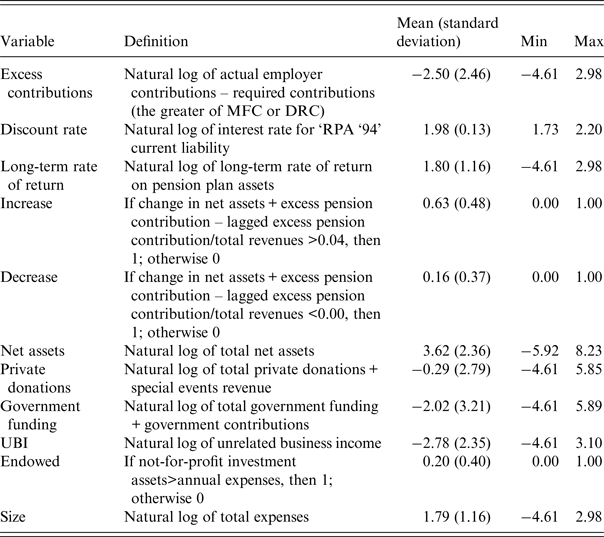
Table 3 defines each variable used in the empirical analysis and presents summary statistics (mean, standard deviation, minimum, and maximum) for each of the variables. The Excess Contribution variable indicates that not-for-profits contribute on average $82,000 (the antilog of −2.50) more than the minimally required contribution. Organizations show great heterogeneity in their behavior, however. One-half of the yearly observations report contributions in excess of the minimally required by ERISA regulations. Only 10% of organizations in the final sample never made an excess contribution to their pension systems.
Descriptive statistics of variables, 1990–2006

Source: Authors’ calculations.
The discount rate averages 7.2%, and the long-term rate of return averages nearly 6%, compared with 6.9% and 8.3% (respectively) in Vermeer et al. (Reference Vermeer, Edmonds and Asthana2014). The long-term rate of return has a much wider distribution compared with the discount rate, perhaps because managers are able to exercise more discretion, as identified in prior research and because the discount rate is highly regulated (Kisser et al., Reference Kisser, Kiff and Soto2017). Both variables also exhibit variation within each not-for-profit organization. Only 4% of the not-for-profit organizations in the sample never changed their discount rate during the sample period, and less than 2% never changed their assumed long-term rate of return. Therefore, in most years of the sample, almost all not-for-profit organizations adjust these actuarial assumptions. The average annual change in the discount rate is 0.98 percentage points for both actuarial assumptions. However, the intra-firm standard deviation is much larger for the long-term rate of return on assets (4.66) compared with the discount rate (1.05); these intra-firm measures of variation again likely reflect the greater managerial discretion afforded the return on assets assumption and the effects of regulation on the discount rate.
Approximately 63% of the sample reported a projected net income in excess of 4% and 16% reported a projected deficit. The remaining 22% of the sample reported projected net income between 0% and 4% and have no incentive to manage reported earnings.
Average total net assets for the sample are $37 million (the antilog of 3.62). The sample has wide variation from $0 to nearly $4 billion. Total contributions average $750,000 annually, while government funding average over $130,000. In both cases, the data reveal great heterogeneity. Unrelated business income average $62,000, but some organizations earn tens of millions of dollars of revenue from these unrelated sources. About one-fifth of the sample is presumptively endowed and the average organization spends nearly $6 million annually in total.
Empirical results
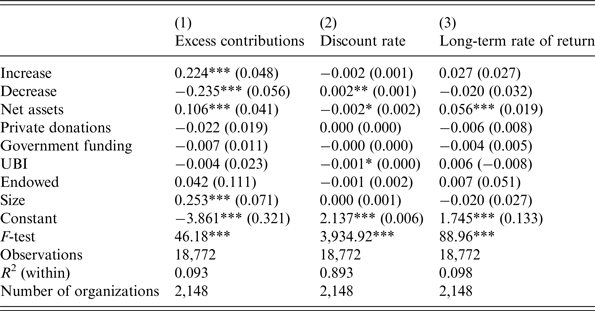
The results for the full sample are displayed in Table 4. Column 1 displays the results using excess contributions as the dependent variable, column 2 displays the results using the discount rate as the dependent variable, and column 3 displays the results using the expected long-term rate of return as the dependent variable.
Not-for-profit strategic pension funding regression models, 1990–2006

Source: Authors’ calculations. Robust standard errors clustered by not-for-profit organization in parentheses. All estimates also include organization and time fixed effects.
***p < 0.01, **p < 0.05, *p < 0.1.
We find strong evidence of hypothesis 1, that not-for-profits increase their excess pension contributions when they exceed their earnings target and minimize excess pension contributions when they do not. Not-for-profits, therefore, use pension contributions as a means to lower reported profits and also to reduce reported losses, which is consistent with other behavior documented by Leone and Van Horne (Reference Leone and Van Horne2005) as well as Eldenburg et al. (Reference Eldenburg, Gunny, Hee and Soderstrom2011). Even more, interestingly, the magnitude of the change in excess contribution is larger during an earnings shortfall: having a projected net income before discretionary expenses in excess of a net income targets increases excess pension contributions 22.4%, while falling short of the target reduces excess contributions by 23.5%. We see a similar behavior in discount rate changes, with no significant effect when more profitable than targeted, but a 0.2% increase in the discount rate (and thus minimizing pension contributions) when the organization does not meet its target. This change represents a change of 1.4 percentage points at the average discount rate. Kisser et al. (Reference Kisser, Kiff and Soto2017) note that public regulators oversee the RPA 94 discount rate used by pension plans, reducing the discretion of managers. The analysis here suggests that this regulation reduces but does not eliminate this managerial discretion to smooth reported earnings as needed through the discount rate.
We also find strong evidence for hypothesis 2 across all three dependent variables. Not-for-profits increase excess pension contributions by 10.6% in response to a 1% increase in net assets, which allows the not-for-profit to potentially reduce contributions if necessary in the future and maintain other spending. This increase in wealth also spurs an increase (and likely normalization) of the discount rate, thereby increasing the size of the current pension liability (and, as a result, required contribution) at a time they feel they can afford it. This optimism also may permeate their long-term financial planning, with a 1% increase in net assets resulting in a 5.6% increase in the expected long-term rate of return. Notably, hypothesis 2 is the only one of the five hypotheses to elicit a statistically significant effect on the long-term rate of return.
Surprisingly, we find no evidence of support for hypothesis 3 or 4. Holding other factors constant, the composition of a not-for-profit's revenue portfolio does not appear to have a direct impact on excess pension contribution changes or changes in actuarial inputs.
Hypothesis 5, which posits that not-for-profits will follow the commercial sector's example and use excess pension contributions to minimize their tax incidence, does not have much support. There is a faint suggestion that an increase of 1% in the amount of business income unrelated to mission (UBI) is linked to a decrease of 0.1% in the discount rate. However, this could be due to a general lack of not-for-profits with a nontrivial amount of UBI and warrants further exploration.
Examining the control variables, whether a not-for-profit has an endowment is not statistically meaningful for predicting excess pension contributions or changes in actuarial inputs. The size of a not-for-profit is relevant for determining excess pension contributions, with an increase of 1% in annual expenses associated with a 25% increase in excess pension contributions.
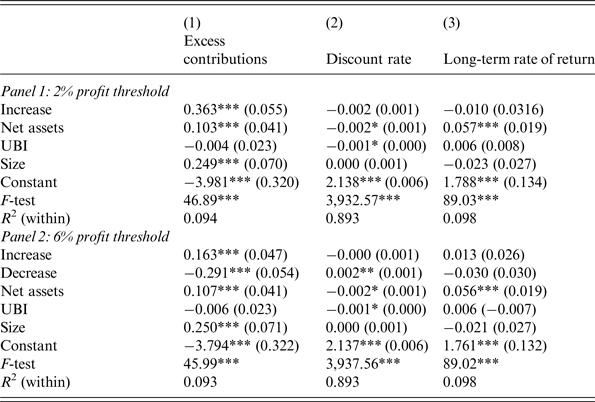
We then test the model using different benchmark profit assumptions; results are displayed in Table 5. Column 1 again uses excess contributions as the dependent variable, column 2 uses the discount rate, and column 3 uses the long-term rate of return on assets. Equation (1) was re-estimated using a lower benchmark profit goal of 2% (rather than 4%), and the significant variables are included in panel 1. We then re-estimated Equation (1) with a 6% benchmark profit goal, with significant variables reported in panel 2. The results in both cases were qualitatively unchanged from those reported in Table 4. In other words, if lower earning targets are used, not-for-profits increase discretionary pension contributions if over the target, minimize them when below target, and alter the discount rate to achieve similar results. If higher earning targets are used, similar results are found as well.
Not-for-profit strategic pension funding regression models, 1990–2006 – alternate target profit thresholds

Source: Authors’ calculations. Only statistically significant variables displayed. 18,722 observations representing 2,148 organizations. Robust standard errors clustered by not-for-profit organization in parentheses. All estimates also include organization and time fixed effects. ***p < 0.01, **p < 0.05, *p < 0.1.
Subsector analysis
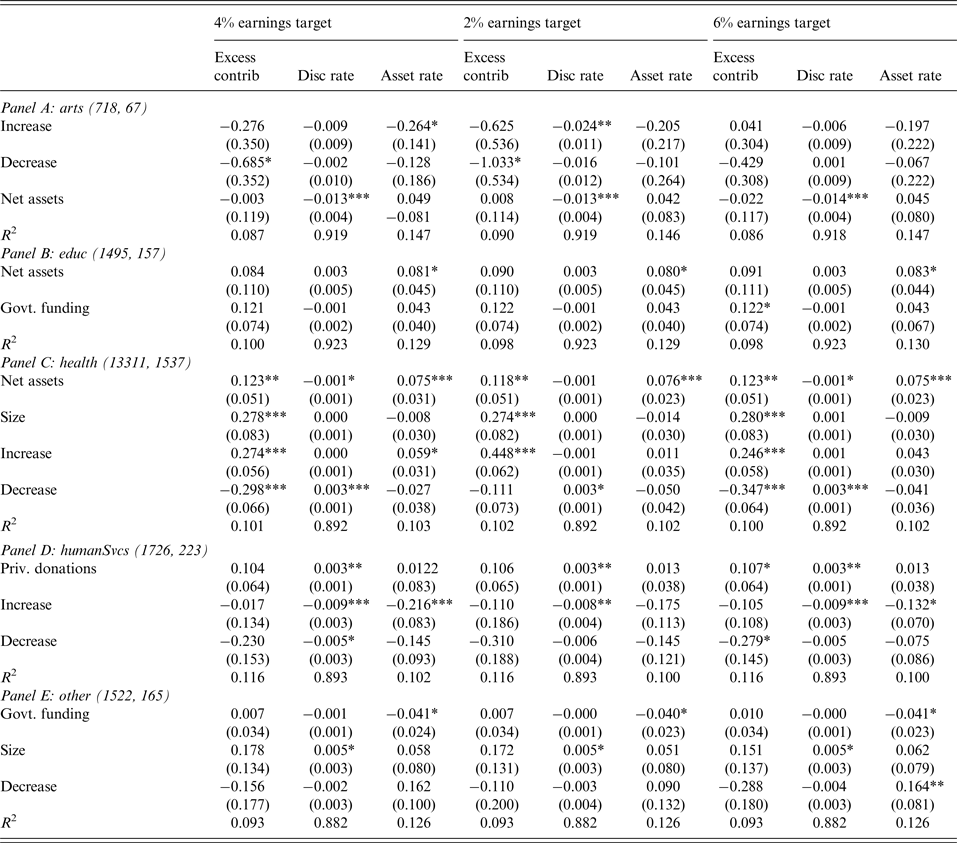
Not-for-profits in different subsectors may face different tradeoffs or different political costs because of variation across stakeholders that might alter financial strategy and decisions. Therefore, we re-estimated all three models at each of the three levels of benchmark profit targets for the five major not-for-profit subsectors in the data. The statistically significant results are shown in Table 6, with each subsector represented by a different panel. Only those variables with significant results are reported in Table 6. The 4% earnings target uses the original variables as defined in the original regressions reported in Table 4. We then alter the projected net income target to 2% and then 6%, as in Table 5.
Not-for-profit strategic pension funding regression models, 1990–2006 – subsector analysis with alternate target profit thresholds

Source: Authors’ calculations. Only statistically significant variables displayed. Number of observations followed by a number of organizations listed in parentheses following subsector label. Robust standard errors clustered by a not-for-profit organization in parentheses. All estimates also include organization and time fixed effects. ***p < 0.01, **p < 0.05, *p < 0.1.
For the Arts sector (panel A), the only consistent statistically significant finding supports the consumption smoothing hypothesis. As accumulated wealth decreases, arts organizations increase the discount rate, resulting in reduced or minimized pension contributions. There is also a significant downward revision of the discount rate of return in response to the 2% profit threshold being achieved, which is consistent with the earnings management hypothesis.
For the Education sector (panel B), there is an increase in expected returns on assets across thresholds correlated with an increase in net assets, which is actually contrary to the second hypothesis. Also, an increase in public funding leads to an increase in expected excess contributions in the 6% target threshold, which is also opposite our hypothesis. Rather than minimizing their excess pension contributions because public funds do not cover costs, the presence of additional public funds may spur additional contributions to pensions due to the relative stability of the revenue, due to isomorphic pressures since many government agencies maintain defined benefit pension plans, or an inflation of pension costs to these contracts as Thomas and Tung (Reference Thomas and Tung1992) find with for-profit federal defense contractors. Both these unexpected findings, however, are only marginally significant.
For Health organizations (panel C), we find both expected excess contributions and optimistic expectations for returns on the pension assets, which is consistent with consumption smoothing (hypothesis 2). Interestingly, we do not see changes in how pension liabilities are calculated via the discount rate. This is potentially related to the already-high level of financial and operational scrutiny that hospitals receive (from bond rating agencies, state health departments, third-party insurance companies, among others). Notably, however, we do see movement if health organizations miss their net income target, at which point they both slightly decrease their expected pension liability downward by changing the discount rate across all three thresholds and decrease their excess payments at the 4% and 6% target profit thresholds. We also see evidence of earnings management on the positive side, with the highest expected excess contributions occurring when in excess of a 2% target. We also note that increased size is highly predictive of excess pension contributions.
For Human Services (panel D), the most pronounced results are the impact of increased private donations. Interestingly, increased donations are associated both with an increase in excess contributions at the 6% target threshold (which is consistent with hypothesis 3) and an increase in the discount rate (which is contrary to hypothesis 3), which minimizes the liability. Both may be attempts to both look lean (liability minimization) rather than look responsible (which would be the increase in contributions coupled with either an unchanged or increased level of liabilities). We also see changes in actuarial assumptions as predicted when projected net income is greater than expected. The discount rate is reduced to increase contributions and the rate of return on assets is reduced at the 4% and 6% thresholds to also increase contributions. These findings are consistent with the earnings management hypothesis.
The ‘Other’ sector (panel E) is difficult to interpret because of the mix of not-for-profit organizations in this category; this is reflected in the relatively low significance of the coefficients, but we do see trends. Increased public funding is associated with a general decline on long-term rates of return on assets (which increases pension liabilities), while an increase in size is associated with a small increase in discount rate and, therefore, a minimization of pension liability. There are no signs of earnings management on the positive side, but there is an increase in future returns on pension assets as the degree of missing the net income target increases – which minimizes the pension liability. Overall, then, the different results for the different not-for-profit subsectors suggest that strategic pension management and funding exists but is accomplished through different means by different types of organizations.
Sensitivity analyses
To test the robustness of the results, alternate specifications were tested for the main model in addition to those reported. Even though changes in economy-wide interest rates are controlled for with time effects, an adjusted discount rate was calculated as the difference between the reported rate and the annual Moody's Aaa Corporate Bond Yield, published by the Federal Reserve Bank of St. Louis and used as the dependent variable. The results were qualitatively unchanged from those reported. The analyses were also repeated using the municipal bond index's annual average yield to maturity published by the Bond Buyer. Again the results were qualitatively unchanged from those presented.
A final consideration is that the actuarial assumptions only change with a lagged response to economic conditions, and these assumptions not used in the current period to manage the incentives outlined earlier. We estimate the original model with the discount rate and asset return assumptions as dependent variables and include 1-year lags on the other variables. None of the variables for the discount rate or asset return assumptions are significant, which suggests managers do not alter these assumptions with a lag. Future research should focus specifically on how actuarial assumptions are chosen by not-for-profit managers given the various incentives they face.
Conclusion
Many large and important not-for-profits sponsor defined benefit pension systems for their employees, and to date, no analysis has considered how these organizations use pension contributions to manage reported earnings to minimize potential political costs. This manuscript is the first to focus exclusively on national not-for-profits’ defined benefit pension plans and finds descriptive evidence that pension funding between 1990 and 2006 has declined for the entire sector while pension expenses have become an increasing portion of spending.
Importantly, this study tests empirical models that seek to infer the extent to which not-for-profit pension plan sponsors use pension contributions and actuarial inputs to achieve strategic financial objectives. For example, this study finds strong evidence that excess pension contributions are used to manage reported earnings up or down as needed, though to different degrees depending on whether they are above or below their earnings target. These findings are consistent with existing literature that not-for-profits seek profits, but want to minimize potential political or public costs from reporting them. We also find evidence of income smoothing and long-term investment return optimism with an increase in net assets; the former suggests sounds financial policy as those who warrant making excess contributions attempt to fill the gap while they can, though the latter may incur additional risk.
The empirical research here also adds to the growing literature on how and why not-for-profits manage reported profits. Given our finding that higher profit targets result in less (but still existent) earnings management, future research should continue to explore not-for-profits’ surplus objectives, which are currently not known with any certainty. This manuscript also links the not-for-profit earnings management literature with the not-for-profit strategic management literature that finds low-profit levels in spite of management goals to earn and accumulate profits. The results here suggest that pension plan contributions should be considered to the extent feasible in accounting and financial reporting analyses. As reimbursement systems and the healthcare environment undergo reforms, understanding how organizations manage earnings, sometimes through opaque mechanisms such as pension plans, is important for predicting how such changes might influence the fiscal health of the sector. Further, given changes in financial reporting standards – notably FASB no. 158 in 2006 – future research should examine how not-for-profits responded to these changes. It would also be worthwhile to analyze how the financial crisis that began in 2007 influenced not-for-profit pension fund management and funding, given the potential that managers are merely responding to macroeconomic changes and not funding pensions strategically.