Financial markets have long been considered crucial for economic growth. Empirical research, by Robert King and Ross Levine and Levine and Sara Zervos, establishes a positive relationship between credit market development and economic growth in cross-sectional data for the twentieth century.Footnote 1 The early development of the United States seems congruent with this view: Richard Sylla argues that a sophisticated banking system emerged during the 1790s; Peter Rousseau and Sylla suggest that financial development was indeed the driving force of economic progress in the nineteenth century.Footnote 2 Upon closer examination, however, the underpinnings of this interpretation are not yet clear. The scarcity of micro-level studies on early banks limits our understanding of banking practices and performance in this period. Thus we cannot yet say with confidence whether the mere introduction of early banks advanced the overall quality of the credit market relative to the personal credit market that long pre-dated American Independence.
This article investigates the impact of early banks using a newly developed dataset drawn from court and bank discount records of Plymouth County, Massachusetts. These detailed records allow comparison of bank lending practices before and after a major change in entry policy: before 1828, many banks remained local monopolies. However, legislation prompted by the democratic atmosphere of the Jacksonian era fostered freer entry in the 1830s. The resulting change in the competitive environment provides an opportunity for examining the effect of competition on access to bank credit for small farmers and artisans. The results also bear on broader hypotheses about the linkage between political democracy and economic development.
Among all regions in nineteenth-century America, New England was the most remarkable case of economic development. On the eve of the Revolution, New England had the lowest per capita wealth among American colonies. Yet, by 1840, its income per capita was 30 percent higher than the national average.Footnote 3 Economic development in early-nineteenth-century New England was not merely the result of exogenous changes in industrial technology but represented a much broader transformation in institutions and behavior.
It is widely believed that the transition from personal to impersonal exchange is central to economic development. In the context of credit markets, as credit from a broader set of potential lenders becomes accessible, borrowers are able to pursue a wider range of opportunities. Winifred Barr Rothenberg shows that local credit markets existed in colonial New England long before the first banks were established. The multiple, interwoven credit relationships formed intricate networks. Over time these networks expanded both in depth and in breadth—the numbers of transactions increased and the relationships extended farther away. Moreover, the charging of interest also became more pervasive—a sign of market-type behavior. These findings suggest that there was no lack of a credit market. The personal credit network was prevalent long before the Revolution. Small farmers and artisans borrowed extensively from merchants and among themselves.
After the Revolution, freed from the restriction of British policies, banks began to surface. The early nineteenth century saw the co-existence of banks and personal credit markets. However, the emergence of early banks may not signify progress towards impersonal exchange. As in personal credit markets, information asymmetry remained a challenge for bank lending. In addition, usury laws were prevalent and largely observed in early nineteenth century.Footnote 4 Theoretically, asymmetric information can lead to credit rationing, a practice that is exacerbated by existence of an interest rate ceiling.Footnote 5 To overcome the problem of asymmetric information, according to Naomi Lamoreaux, nineteenth-century New England banks took advantage of kinship ties.Footnote 6 In essence, businesses and industrialists chartered banks in order to lend to themselves. This is not to say that outsiders had no access to bank credit at all. An “insiders” bank only meant that insiders were preferred in the extension of bank loans. Consequently, the impact of these insider-lending banks on farmers and artisans is less clear.
Combining bank discount records, court records, and Federal Censuses of 1820, 1840, 1850, I am able to identify the occupations of borrowers from the bank and track their distribution over time. The information enables the investigation of the interaction between the bank and the personal market. Subsequently, the advent of de facto free banking in Massachusetts as of the 1820s also allows me to analyze the impact of entry on credit access to groups other than wealthy merchants.
My results confirm that long before the appearance of Plymouth Bank in 1803, a personal credit market existed in Plymouth County. Farmers and artisans relied heavily on such personal borrowing. Moreover, the data also confirm the practice of insider-lending; much of the bank's lending went to stockholders of the bank. The interaction between personal credit relationships and bank lending was evident at the outset: the bank's initial stockholders were deeply involved in the local credit market long before the bank was organized. The bank extended credit mostly to merchants, serving only a select group of clients. This forms a sharp contrast to the personal credit market, where farmers, and later artisans, were the major borrowers. Empirical evidence indicates that the bank, as the only institutional lender in the county, rationed credit based on private information.
Thus during its first 30 years, the bank was the credit source for well-established merchants and the wealthy. Its discount practice was similar to the insider-lending story of Lamoreaux, but without the links to dynamic industrial firms. By the 1840s this pattern had changed dramatically. Artisans became the second most frequent borrowers of the bank. The gap between lending profiles of the bank and that of the personal credit markets narrowed. What caused this change? My contention is that, in addition to improvement in banks' ability to identify credit-worthy borrowers, intensified competition between banks played a major role. In Plymouth County, a new entrant located in the same town was able to take away part of the clientele of Plymouth Bank. The free-entry policy of the Jacksonian era prompted the expansion of the market, as the force of competition drove banks to reach out for new potential borrowers. The rise of banking competition in Plymouth County was a reflection of the antimonopoly sentiment of the Jacksonian era. Thus political democratization, by opening entry and fostering competition, also enhanced economic democratization by broadening access to credit.
CASE STUDY: PLYMOUTH COUNTY, MASSACHUSETTS
In the colonial period, British mercantilist policies forbade the formation of banks in America.Footnote 7 As a result, credit was extended through a hierarchy of relationships. Farmers purchased imported goods on credit from local merchants. These merchants, in turn, imported the goods on credit from British merchants. The Revolutionary War changed this credit structure and interrupted credit flows, at least temporarily, in the United States.Footnote 8 After the war, Americans were no longer under the fetters of British policies, and merchants soon initiated efforts to organize banks.
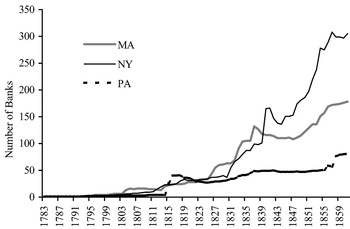
In the early nineteenth century, New England and the Mid-Atlantic region were the first to open up to banking.Footnote 9Figure 1 compares the numbers of banks in Massachusetts, Pennsylvania, and New York. It shows that before 1840, Massachusetts had the largest number of banks.Footnote 10 After the free banking act of 1838, New York surpassed Massachusetts to become the state with most banks. Even so, Massachusetts was still among the states with the highest bank credit per capita, second only to Rhode Island.Footnote 11
NUMBER OF BANKS FOR MASSACHUSETTS, NEW YORK AND PENNSYLVANIA, 1783–1861

Despite their rapid expansion, banks did not spread evenly over Massachusetts. Within the state, the number of banks varied significantly across counties. Suffolk County and Essex County had multiple banks as early as the 1790s—thanks to the two cities (Boston and Salem, respectively) within them. By 1830 Boston had 17 banks and Salem six.
This concentration of banks was by no means common among Massachusetts's towns and cities, as only seven townships had multiple banks.Footnote 12 Overall, the growth of banks at the state level penetrated into towns gradually; as of 1820, nine out of the 13 counties in Massachusetts had no more than one bank.
This article uses data from Plymouth County, Massachusetts to analyze the impact of bank entry. Plymouth County is located between Norfolk and Barnstable Counties, facing the Cape Cod Bay, with Bristol County to the west. The eastern part of the county, like other eastern counties in Massachusetts, underwent commercialization, with Plymouth being the regional trade center. The western side of the county, especially Middleborough and Bridgewater, was mainly agricultural. Despite being one of the earliest settlements in North America, Plymouth in the early nineteenth century was in the shadow of the urban center of Boston. Thus, the county as a whole engaged in a variety of economic activities.
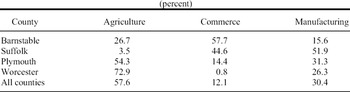
TABLE 1Table 1 lists the number of individuals in major sectors of the economy according to the 1820 Federal Census. Suffolk County, which includes Boston, had very little farming. Its main economic activities were commerce and manufacturing. Barnstable County, just south of Plymouth County, engaged primarily in commerce with relatively few other activities. The western Massachusetts counties were mostly agricultural. The industry mix of Plymouth County reflected those of the neighboring counties; it was almost identical to that of Massachusetts as a whole. The diversity in occupations allows us to examine credit market behavior both within and among different groups. Moreover, there was only one bank in Plymouth County between 1803 and 1828; the Plymouth Bank did not face any direct competition in the same town until 1833. This pattern of geographical distribution of banks was also common among nonurban areas. Thus Plymouth County offers an opportunity to investigate the role of banks in a less urban setting with a variety of economic activities.
OCCUPATIONAL DISTRIBUTION OF SELECT COUNTIES IN MASSACHUSETTS, 1820

Source:
1820 U.S. Federal Census
DATA SOURCES
The main data sources for the study are Plymouth Bank Records and Plymouth Court Records, along with 1820, 1840, and 1850 Federal Censuses. Plymouth Bank records started with the bank's founding in 1803. The discount books provide the most detailed information on the lending practice of bank; those for 1803 to 1833 and for 1844 to 1849 survived. Early banks, such as the Plymouth, used discounts as the principal way to extend credit. The presenter brings a note, usually either a promissory note or a bill of exchange, to the bank. The bank then discounts the note and gives the presenter the net amount due in the form of bank notes. The bank opened for discounts once a week between 1803 and 1833, and charged 6 percent interest rate with no exception. This was in accordance with the usury law in Massachusetts.Footnote 13
The second source is the Plymouth Court Records; these records document all court cases at the county level, from the seventeenth century to 1859. The complete records include all cases presented in the Court of General Sessions and the Court of Common Pleas. In the records of the Court of Common Pleas, an overwhelming majority of cases were debt litigation. A typical records entry includes the name and occupation or social status of both parties, amount of debt under dispute, the terms of the loan (interest, due date, and instrument used), the court's judgment, cost of the litigation, and notes on enforcement.Footnote 14
The Court Records provide us a glimpse of credit relationships in early periods, though it is obviously a biased sample. The cases in Plymouth Court Records represent only alleged defaults, which presumably constituted only a small subset of existing credit relationships. The personal credit market behind the court cases may have been very extensive indeed. In addition, one can easily imagine that not all defaults were brought to court. Creditors could utilize other mechanisms (such as renegotiation) to resolve issues. Nevertheless, these court cases show that there existed a credit system long before the emergence of Plymouth Bank. The occupational composition of borrowers in the court records presents a yardstick for evaluating bank credit access.
A third source of the data is the population census of 1820, 1840, and 1850. These are mainly used to identify the borrowers' occupations. A combination of the three set of records allows a more detailed analysis of lending practices and bank credit availability.
ANALYSIS OF DISCOUNT RECORDS
Analysis on Discount: Occupational Distribution, 1803–1833
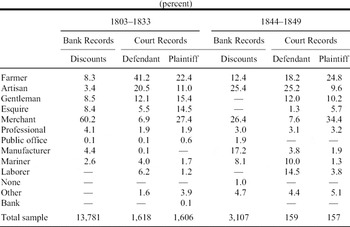
The diversity of economic activities in Plymouth County reflects the burgeoning New England economy. To evaluate the contribution of early banks in the process, it is crucial to examine their lending practices. The first column of Table 2 presents the distribution of discounts by occupation between 1803 and 1833.Footnote 15 Over 60 percent of all discounts in the sample were to merchants.Footnote 16 If combined with the discounts to gentlemen and esquires, this number increases to over 75 percent. This shows that, consistent with Lamoreaux's findings, the bank in this period served mainly the economically prosperous classes. The lending pattern also reflects the composition of stockholders: merchants held about 55 percent of the initial stock of the bank.
FREQUENCY OF OCCUPATION/STATUS FROM PLYMOUTH BANK AND PLYMOUTH COURT RECORDS, 1803–1833 AND 1844–1849

Sources:
See the text.
During the early nineteenth century, the real-bills doctrine was the orthodoxy in bank lending practices. According to the doctrine, banks should finance only short-term commercial activities.Footnote 17 By this standard, the lending practices of the Plymouth Bank deviated from the real-bills ideal. Out of the total of 17,053 loans, only 362 were short-term commercial loans. The vast majority of loans were longer-term accommodation loans. Merchants presented 89 percent of the commercial paper for discount; they also received over 59 percent of the accommodation loans. The dominant presence of merchants in the lending profile of the Plymouth Bank applies for both accommodation and commercial loans.
Despite being the largest group of borrowers, not every merchant in the county had access to banks. This can be shown by comparing the court and bank records. Between 1803 and 1833, approximately 275 different merchants brought suit in the sample of the court records.Footnote 18 In the same period, only 49 of these merchants received discounts from the bank. Thus, even within the merchant class, the bank still lent very selectively.
It is not surprising that the bank had such ability to differentiate good borrowers from bad ones. The directors of banks were either lawyers or big merchants. They maintained social ties and relationships with locals through repeated interactions. Both professions would possess a large amount of information about the potential borrowers, either through commercial transactions or litigation. Thus banks usually had the ability to evaluate a potential borrower's credit-worthiness.Footnote 19
Table 2 also compares the occupational distribution from the two records in the same period. Note that in the period under inspection, very few cases involved any bank, again evidence for the prudent discounting policy. Therefore, bank discounts and transactions represented in court cases had very little overlap. The figures indicate a significant difference between the composition of borrowers from the bank and that in the court cases. If no specific group was more likely to bring disputes into court, the data translates into a major distinction in bank credit and personal credit. Namely, farmers and artisans did not have easy access to banks. They usually borrowed in the personal credit market. Their presence in the court records shows that they did have a demand for credit; however, they did not gain access to bank credit.
This simple comparison, however, must survive further scrutiny. The obvious issue is sample selection bias in court records. Defaults represented only a small portion of all credit transactions. Even when faced with default, not every creditor pursued court actions. One could argue that merchants may have been less likely to appear in courts for debt cases. Reputations and informal sanctions could have played a key role. If this were the case, a low percentage of merchant defendants does not necessarily translate to a small amount of merchant borrowing. It could simply mean that they either had lower default rates because of the reputation mechanism or there were other means of default resolution. Both factors could contribute to the low percentage of merchants as defendants.
Nonetheless, in a local economy in early-nineteenth-century America, farmers and artisans also had repeated contacts with other potential lenders or borrowers. It was true that merchants had close relationships in business; farmers, however, also maintained close relationships with local country stores because the latter provided them credit and outlets for agricultural output.Footnote 20 Therefore, the use of informal enforcement was not restricted to merchants. Moreover, merchants formed the largest group of plaintiffs, making up more than 27 percent in all litigation. In fact, using the same court records, William E. Nelson found that the commercial center in the county, the Town of Plymouth, had a much higher rate of litigation.Footnote 21 These intratown suits were usually brought about by a small group of “litigious” individuals, usually merchants, and suggest that merchants may have been more prone to litigate. The evidence is not, however, definitive, as merchants were likely to engage in many more credit transactions, and so it is possible that they resolved a portion of their debt disputes by other means.
Another potential issue is the discrepancy in geographical representation of bank records and court records. The bank lent mostly to individuals in the town of Plymouth, which, as a commercial center, had more merchants than other regions. The court records, on the other hand, represent the defaults of the whole county. If this was the sole explanation, once we restrict the samples to the town of Plymouth, the gap would vanish. The result, however, shows otherwise. If we consider only the residents of Plymouth, about 70 percent of the bank's discounts were to merchants. In the court records, only about 8.5 percent of the defendants were merchants, with farmers and artisans making up 20.7 percent and 21.7 percent, respectively. Even if one categorizes all gentlemen as merchants, this would still only account for 31 percent of the cases.
The difference presented in Table 2 is indeed striking. Farmers had very limited presence in the discount records of the bank—only slightly more than 8 percent. The number is fairly close to the 10 percent stipulated for agricultural and manufacture loans in the bank charter. The fact that such a stipulation appeared in the charter evidently reflects the expectation that contemporary banks would be reluctant to extend credit to people other than the wealthy. These pieces of evidence are consistent with a discrepancy in borrowers between bank and personal credit.
Discount Amounts
A further distinction between bank credit and personal credit is in the size of loans. The comparison between the amounts of loans from the bank and those in court cases provides a sharp contrast. Between 1803 and 1833, the discount amounts from the bank were much higher than those in the debt cases. The average of the former was $820.50 and the latter $140.10. As court cases only consisted of defaults, they invariably provide a biased sample. Two major reasons may create an upward bias: First, the law stipulated that all debt cases involving less than $4 were under the jurisdiction of local Justice of the Peace. Therefore, the Court of Common Pleas would only deal with loans of at least this amount. Second, the cost of litigation may have deterred some smaller creditors from resorting to the court. With such upward bias, the gaps in loan sizes appear all the more significant. One important qualification, however, is the fact that the personal credit market and the bank had distinct clienteles. Therefore, it may very well be that the merchants, who borrowed from the bank frequently, simply needed larger loans. This may be the driving force of such distinctions.
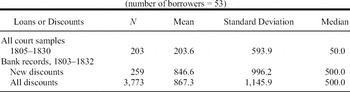
In order to control the selection problem of the borrower, I matched all the names that appeared in both records. Out of all borrowers in the bank's loan records from 1803 to 1833, 53 also appeared in debt litigation as defendants. Table 3 reports the mean amounts for the same group of borrowers in the court records and bank discount books.Footnote 22 The same group of borrowers would borrow greater amounts from the bank than from individual personal credit markets. Even if one compares the average amount year by year, the same results still hold.
COMPARISON OF AMOUNTS BETWEEN COURT AND BANK RECORDS, CONTROLLING BORROWERS

Sources:
Konig, Plymouth Court Records and Historical Collections.
It is not surprising that banks were able to lend out greater amounts. After all, the banks gathered the financial resources of many investors. Individual moneylenders or shopkeepers, no matter how successful, only had limited financial resources of their own. Even if they possessed substantial assets, they would not be willing to lend a great amount to one single borrower, for the simple reason of risk: if the borrower failed, a great portion of their wealth would be in jeopardy. On the other hand, banks had a much larger pool of capital. This enabled them to diversify successfully even though the amount of each discount was large. It was in this respect that the bank provided a unique service.
DISCOUNT DATA, 1844–1849
In the early years of the bank, most discounts went to local merchants. Over the years, however, textile mills sprung up in New England, and artisans and small manufacturers constituted a growing share of the population. Other financial intermediaries, including new banks and savings banks, also emerged after 1828 in Plymouth County. Scholars, such as John Wallis, regard Massachusetts as the earliest free-banking state.Footnote 23 Although Massachusetts did not establish de jure free banking until 1851, the relative ease of acquiring bank charters made it de facto free banking. The literature in political history indicates that the antimonopoly sentiment of the Jacksonian era imposed pressure on states. The Massachusetts Banking Act of 1828 embodied this political atmosphere.Footnote 24 Overall, de facto free banking translated to a great number of small banks in Massachusetts. The policy also affected Plymouth County, where two new banks (Hingham Banks and East Bridgewater Bank) were chartered in 1828. Both were at the northern part of the county. However, neither started operations until after 1833. In 1832 Old Colony Bank acquired its charter in the town of Plymouth. It began its operation within a year. Two more banks (Duxbury Bank and Wareham Bank) also received charters in 1833.
ANALYSIS OF DISCOUNTS, 1844–1849
The change in the banking environment provides an interesting case for comparing banking practices. The last three columns of Table 2 present the occupational breakdowns for bank loans and both parties in debt litigation between 1844 and 1849. In this period, the proportion of bank loans to merchants declined, while it increased for farmers and artisans. The annual distributions of borrower occupations remained stable within the two periods, but were strikingly different between them. Between 1803 and 1833, the loans to merchants consistently constituted approximately 60 percent of total loans, whereas between 1844 and 1849, this percentage hovered around 25 percent.
In addition to the occupational breakdown, the concentration of borrowers also changed significantly. In order to make the proper comparison, I sampled the years 1827 to 1832 and the years 1844 to 1849. Between 1827 and 1832, 102 borrowers discounted a total of 1,488 times, averaging 14.59 times per person. In the latter period, 820 borrowers presented 3,139 discounts, averaging 3.83 times per borrower. This suggests that by 1844, the body of borrowers were more dispersed than in the earlier period.
Another noticeable change is the increasing presence of commercial paper in discounts. A good indication would be the frequency of renewals. Between 1844 and 1845 about 23 percent of all discounts were not renewed so they were likely to have been commercial paper. Although the Plymouth Bank was never the idealized real-bills bank, the growth of shares of commercial paper from 2 to 23 percent was still significant.Footnote 25
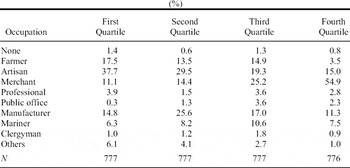
The size of loans also provides evidence on the change in borrower composition. The average amount between 1803 and 1833 was $820.50, with a median of $500. In the latter period, the average amount was $496.64, with a median of $274.84.Footnote 26 Despite some fluctuations from year to year, the amount lent was always much lower in the latter period. Most of the small loans went to artisans. Table 4 lists the occupational distribution by quartiles of loan sizes between 1844 and 1849. For the first quartile, artisans and farmers received over 56 percent of total loans. This percentage drops monotonically by quartile as loan size increases. In comparison to previous years, Plymouth Bank shifted towards smaller loans, and broadened its lending to artisans.
OCCUPATIONAL BREAKDOWN BY QUARTILES OF AMOUNT LENT, 1844–1849

Note:
First quartile = 139.9; median = 244.8; third quartile = 500.
Sources:
Historical Collections.
From this analysis, one can conclude that the Plymouth Bank underwent considerable changes in lending practices over the first half of the nineteenth century. Before 1833 over 60 percent of loans were to merchants; whereas artisans made up less than 4 percent of all loans. After 1844 the share of loans to artisans increased sharply and was almost on par with loans to merchants. What caused this change?
One candidate would be a shift in economic structure. The first half of the nineteenth century was an era of rapid industrialization in New England. The changing economy of Plymouth County was a part of the broader transformation toward industry in the region. Thus the lending patterns of banks might have simply reflected this transition. Table 5 compares the percentage of population in different sectors between 1820 and 1840, using Census data. The share of the population engaging in manufacture increased by more than 10 percentage points. However, such changes do not mirror the dramatic increase in loans extended to artisans. The change in economic structure was not nearly as abrupt as the change in borrowers; instead, census records suggest that the structural shift was relatively gradual. Therefore, economic transformation cannot be the primary factor in explaining the change in borrower profiles.
OCCUPATIONAL DISTRIBUTION, PLYMOUTH COUNTY, 1820 AND 1840

Note:
The definition of “people engaging in commerce” changed between 1820 and 1840. In 1820 it included people engaging in navigation, but in 1840 these individuals were in a separate category. To make the numbers comparable I included sailors and mariners in people engaging in commerce.
Sources:
Historical Census Browser.
Another potential explanation was the changes in loan rates. According to Hugh Rockoff, although Massachusetts did not repeal its usury law until 1867, the penalty for charging usurious interest decreased over time. Howard Bodenhorn found that in Black River Bank of New York, the bank could choose to violate the usury law when necessary. Evidence from Plymouth Bank between 1844 and 1849 suggests similar behavior. In this period, about 4.7 percent of loan rates rose above the interest ceiling. However, the violation of usury laws does not explain the broadening of credit to artisans. If the lax enforcement of usury laws caused the expansion of credit access, a majority of those loans should have been made to artisans. Instead, the occupational distribution of these usurious loans was similar to that of regular loans. Moreover, only 37 out of the 172 usurious loans were to first-time borrowers. Other possibilities, such as changes in regulations on banks, similarly fail to explain the observed change.Footnote 27 In the following sections, I argue that it was the introduction of competition that opened up access to bank credit.
COMPETITION AND LENDING PATTERNS OF BANKS
Evidence on Credit Rationing
Joseph Stiglitz and Andrew Weiss show that credit rationing can exist in equilibrium in the presence of asymmetric information. Banks had incentives to carefully assess the credit-worthiness of individual borrowers to avoid default risks. Collecting information on some borrowers, however, could be costly. When this information cost outweighed the potential profit opportunity for the bank, these borrowers were likely to be denied loans. The end result was, effectively, credit rationing and financial repression. Moreover, the usury law was still in place. Between 1803 and 1833, the Plymouth Bank lent at the usury ceiling without exception. Therefore, the lending pattern of Plymouth Bank in this period strongly suggests the existence of credit rationing.
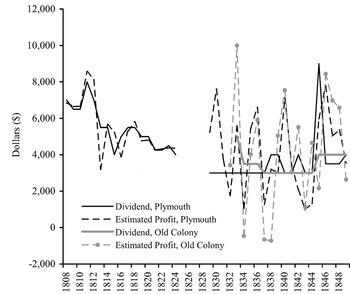
If the interest rate ceiling were at or close to the market-clearing rate, the new entrant would lower the market interest rate. If not, the new entrant should have been able to absorb the excess demand for credit at the interest rate ceiling, albeit at a somewhat higher risk. In other words, there would be enough demand to support both the incumbent and the entrant. Evidence from bank balance sheets shows that both Plymouth Bank and its direct competitor, Old Colony Bank, remained profitable. Both banks paid dividends consistently. Although profitability figures provide preliminary evidence on credit rationing, a few caveats remain. First, one cannot know the counterfactual; Plymouth Bank might have made more profits were it not for the new entrant. Second, the profitability of the new entrant could also be affected by cyclical factors. Figure 2 shows the net profit of the two banks in Plymouth County.Footnote 28 There was indeed a profitability surge around 1832, when the Old Colony Bank began its operation. However, for Plymouth Bank, the surge started before 1832. Figure 2 also shows the dividend for both banks. Overall, the profit of the banks fluctuated significantly over the latter period. Nevertheless the banks were able to issue dividends at a fairly constant rate, with the exception of 1837. Despite fluctuations, the banks were in general profitable.
PROFIT AND DIVIDEND FOR PLYMOUTH AND OLD COLONY BANKS

COMPETITION IN THE CREDIT MARKET: IMPACT OF NEW ENTRY
Lack of information on the lending profiles of Old Colony Bank made it difficult to know the exact extent to which the entrant eroded the clientele base of the Plymouth Bank. However, anecdotal evidence suggests that some clients of the Plymouth Bank switched to the new entrant.Footnote 29 Looking at the petitioners and their relationship with the Plymouth bank also shed some light on how the new banks brought competition. For the new banks outside of the town of Plymouth, only one petitioner borrowed from Plymouth Bank. All others never appeared in the sample in the discount book. Meanwhile, five out of seven petitioners of Old Colony Bank had previously discounted at the Plymouth Bank. Two of them, John B. Thomas and James Spooner had more than ten entries in the discount records of the Plymouth Bank between 1803 and 1833. Neither appeared in the discount records between 1844 and 1849. Although the 1850 census indicated that they were alive throughout the period. Out of the seven original petitioners of Old Colony Bank, only one had discounts at Plymouth Bank after 1844. The missing records between 1833 and 1844 prevent one from further looking into this issue. However, judging from the lending pattern of contemporary banks, it was hardly surprising that the insiders of new banks did not discount at the existing banks.
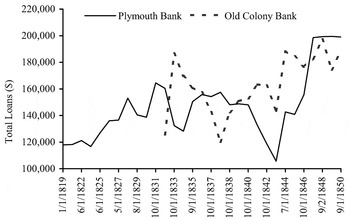
At the aggregate level, total loan amounts for both banks also illustrate the impact of new entrant. Figure 3 plots the total loans for both Plymouth Bank and Old Colony Bank. Between 1833 and 1835, the assets of Plymouth Bank dropped. This could very possibly be the effect of Old Colony Bank taking away the old customers. In any case, the entry of Old Colony Bank took away part of the reliable customer base at the Plymouth Bank. However, after a few years, Plymouth Bank was able to recover. Its total loans went back to its original level around 1836 and 1837, only to take another hit during the Crisis of 1837.
TOTAL LOANS AND DISCOUNTS FOR PLYMOUTH AND OLD COLONY BANKS, 1820–1850

As the result of opening up competition, the incumbent, Plymouth Bank, faced increasing competitive pressure from the new entrant. In reaction to the changes, the bank reached out to the rising class of artisans and small manufacturers. This is evident in the wake of the Crisis of 1837. If Plymouth Bank only pursued existing borrowers, one would expect that in the aftermath of the crisis, those who endured should be the long-term borrowers. Consequently, the borrowers should have consisted mostly of a small group of insiders. Yet this was not the case, according to my data. The period of 1844 to 1849 saw a dramatic increase in the number of borrowers from the bank. In addition, they were also more likely to borrow smaller amounts. Thus the introduction of competition drove the bank to extend loans to the artisan population.
These results resonate with the literature of credit markets. According to Levine, banks enjoy an advantage in information acquisition.Footnote 30 In early American banking, Robert Wright argues that banks, through specialization of extending loans, became better at distinguishing the good borrowers from the bad one.Footnote 31 As merchants organized the Plymouth Bank, the bank was likely to possess private information on merchants. Hence it was not surprising that they constituted the majority of loans in the early years of the bank. With the erosion of clientele from competition, Plymouth Bank could no longer rely solely on the existing insiders. Meanwhile, as the bankers gained experience in extending loans, they became better in selecting potentially successful artisanal activities. As a result, more new customers had the opportunity to establish long-term credit relationships with the bank. Thus an expansion of clientele for Plymouth Bank ensued.
A formal test of this hypothesis is beyond the scope of the current article; however, other research confirms the existence of such a learning mechanism. For example, Bodenhorn shows that individual borrowers were willing to tolerate less favorable loan terms in order to build up long-term relationship with banks.Footnote 32 In other research I show that banks could learn to lend by accumulating private information on borrowers.Footnote 33 Both studies imply that it was possible for antebellum banks to learn from experience and thereby extend credit to a broader group of clientele.
CONCLUSIONS
Sylla argues that the United States had one of the most advanced and innovative financial systems as early as the 1820s. Massachusetts, a front-runner in industrialization, was also a leader in financial market development. It possessed a large number of banks and the highest bank capital per person through the antebellum period. Thus Massachusetts as a whole seemed to be a financially advanced region with burgeoning industry. In urban areas such as Boston, merchants could gain access to bank credit by forming their own banks. Their reputation and diversification attracted investors to purchase bank stocks. Outside of Boston, however, many banks remained local monopolies even in the 1820s, lending only to well-established merchants. Thus despite a well-developed market, most potential borrowers in Massachusetts did not have access to bank credit.
The case of Plymouth County is instructive on the effect of competition. From the information in court records, we know that farmers and artisans borrowed extensively in the personal credit market long before they did so from the bank, implying a demand for credit from those sectors of the economy. However, the entry of Plymouth Bank alone did not broaden access to credit for farmers and artisans; instead it lent to a very small group of borrowers. Over the years, political pressure to charter more banks started to build, culminating in the Jacksonian Era. The loosening of control on charters created a wave of new banks. Among them was Plymouth bank's direct competitor, Old Colony Bank. After Old Colony Bank entered the market, Plymouth Bank began to lend more to farmers and artisans. The new entrant not only eroded the clientele of the incumbent, it also provided more credit in the market. Thus a broader range of individuals gained access to bank credit.
As with most case studies, it is difficult to assert to what extent one can generalize the results from Plymouth Bank. However, in the context of early-nineteenth-century New England, Plymouth County was by no means an outlier. In both economic activities and bank expansion, the county mirrored the broader path of the state. The lending practices of Plymouth Bank were also in accordance with findings established in previous literature. The current study of New England thus serves as a first step in a detailed investigation of the relationship between politics, banks, and economic development. To be sure, the advanced state of American capital markets in the 1820s did not preclude pronounced regional variations in banking policy and structure. My results further confirm the diversity of banking practices in antebellum America. For example, Wright demonstrates that banks in New York and Pennsylvania exhibited a distinct pattern from New England—larger banks with more diverse groups of stockholders.Footnote 34 Using data from mid-nineteenth century New York, Bodenhorn further observes variations in loan rates and thus violations of usury laws.Footnote 35 The South developed branch banking, yet another alternative model of banking system. Banking structure, regulation, and their impacts on bank lending practices varied across both region and time. The underlying sources of divergent regional paths in banking, and their effects on economic development, remain to be studied.
The political forces that promoted freer entry, however, were not peculiar to New England. Competition among states and expansion of suffrage were nation-wide phenomena in early nineteenth century America. This case study therefore calls attention to the interaction between political and economic change. Stephen Haber points to several forms of political competition within the United States. Federalism, expansion of suffrage, division of power, and competition among states reinforced one another.Footnote 36 These political forces restrained the states from capturing monopoly rents and led them to charter more banks. This article focuses on the subsequent development of competition in credit markets. The results demonstrate that competition among banks indeed broadened access to credit, especially for small artisans and farmers. In this case, political access eventually precipitated democratization of the capital market.
Appendix: Loan Records and Identification of Borrower Occupations
BANK DISCOUNT AND COURT RECORDS
The discount data come from Historical Collections of Baker Library, Harvard Business School. The records contain all of the discounts between 1803 and 1833. The Records were missing between part of 1833 and 1843 and resume starting 1843 to 1849. The number of discounts was 17,053 for the first period and 4,148 for the second.
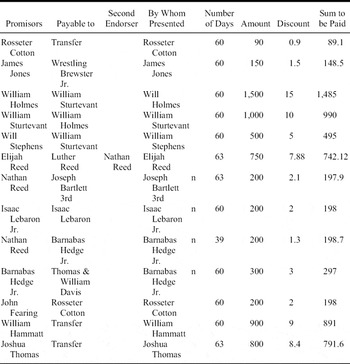
The discount records usually contain the following information: date presented, promisors, endorser, second endorser, amount, discount, and notes. Depending on the cashier, records in some periods also make note of whether the loan was a new (rather than renewal), whether the loan was paid back or renewed, the location of the borrower, and if there was collateral. An example can be found in Appendix Table 1.
The source of the Court records is a published volume, edited by Thomas David Koenig. The court cases came from Court of Common Pleas. The dataset used in this article contains all debt cases for every five years, starting with 1800 and ending with 1850, amounting to a total of 2,280 debt cases. A case usually records the name, location of residence, occupation of both plaintiff and defendant, instrument and the amount owed, court judgment, and the cost of litigation.Footnote 37
IDENTIFYING THE OCCUPATIONS
Out of the 17,053 loans records between 1803 and 1833, the borrower's occupation could be identified for 13,781. Between 1843 and 1849, the borrower's occupation could be identified for 3,107 loans. The occupations of borrowers are determined using the census records of 1820, 1840, and 1850, along with the Plymouth Court Records as supplementary sources. The census of 1850 specified the occupation of every individual. Therefore the major challenge is to uniquely identify the borrower. The census of 1820 and 1840 only listed the name of head of household and the number of individuals engaging in various occupation categories within each household. The categorizations were different between those two censuses. The 1820 census only had three categories: agriculture, commerce, and manufacture. The 1840 census subdivides into mining, agriculture, commerce, manufacture and trade, navigation of the ocean, navigation of river and canals, and learned professions. Because not everyone's name was listed in the census, it can be challenging to identify the occupation of borrowers. Therefore, for the earlier records, I often rely on the court records, which specify the occupation or social status of both plaintiffs and defendants.
In the court records, the common categories were esquire, gentleman, yeoman, merchant (trader), attorney, cordwainer, and housewright. “Yeoman” appeared in the records most often. The yeomen class referred to freeman with land holdings. The term “yeomen,” despite the possibility of other pursuits on the side, in general means farmers. The census data also indicate that farmer was the most common occupation in Plymouth County up to 1850. Therefore, it is no wonder that yeoman appeared often in the court records. Esquire and gentleman were honorary titles, bestowed to people with higher social status and more wealth. The precise definition to such titles, however, was never clear.Footnote 38 The esquire class was in general wealthier than yeomen and gentlemen. Esquires could be merchants, large land-owning farmers, or even artisans and professionals. Esquire may also refer to people affiliated with the legal profession, such as attorneys, judges, or Justices of the Peace.Footnote 39 Gentlemen were another economically better-off class, if not quite as wealthy as esquires. Once again, the gentlemen class might contain men of many different means. The title of gentleman was even more loosely conferred than esquire, indicating that it contained a wide range of occupations. Therefore, the honorary titles did not provide detailed information about a man's profession. Until 1859, the court used titles such as esquire and gentleman wherever applicable.
AN EXAMPLE OF DISCOUNT RECORDS, 4 SEPTEMBER 1804

Note:
The “n” behind “By Whom Presented” identified that the loan was new rather than a renewal.