





Reading is a significant feature of adult life, affording access to opportunities and functioning in society. Thus, here we seek to better understand the sources of variance of early reading. Ample twin studies have partitioned reading variance into genes and the environment (Byrne et al., Reference Byrne, Delaland, Fielding-Barnsley, Quain, Samuelsson, Hoien, Corley, DeFries, Wadsworth, Willcutt and Olson2002; Byrne et al., Reference Byrne, Olson, Samuelsson, Wadsworth, Corley, DeFries and Willcutt2006; Grasby et al., Reference Grasby, Little, Byrne, Coventry, Olson, Larsen and Samuelsson2020; Petrill et al., Reference Petrill, Deater-Deckard, Thompson, DeThorne and Schatschneider2006; Reynolds et al., Reference Reynolds, Hewitt, Erickson, Silberg, Rutter, Simonoff, Meyer and Eaves1996; Samuelsson et al., Reference Samuelsson, Byrne, Quain, Wadsworth, Corley, DeFries, Willcutt and Olson2005; Samuelsson et al., Reference Samuelsson, Olson, Wadsworth, Corley, DeFries, Willcutt, Hulslander and Byrne2007). What are the elements, however, of these genetic and environmental sources of variance? The genetic portion of reading is primarily additive genes (A). Beyond this, the specific genes involved in large part constitute missing heritability. As for the environment, by definition in twin studies, it encompasses the portion of variance twins have in common (C), and the unique environmental variance (E), which is not shared by twins. The current article seeks to better understand just the former, given the specific elements of C are little known for reading. Here we assess possible mediators of this common environmental variance of reading. We start, however, by reviewing the behavior genetic findings of early reading. Genetic effects influence an array of reading skills, including phonological awareness, verbal memory, oral reading and rapid naming (Byrne et al., Reference Byrne, Delaland, Fielding-Barnsley, Quain, Samuelsson, Hoien, Corley, DeFries, Wadsworth, Willcutt and Olson2002; Byrne et al., Reference Byrne, Olson, Samuelsson, Wadsworth, Corley, DeFries and Willcutt2006; Grasby et al., Reference Grasby, Little, Byrne, Coventry, Olson, Larsen and Samuelsson2020; Petrill et al., Reference Petrill, Deater-Deckard, Thompson, DeThorne and Schatschneider2006; Reynolds et al., Reference Reynolds, Hewitt, Erickson, Silberg, Rutter, Simonoff, Meyer and Eaves1996; Samuelsson et al., Reference Samuelsson, Byrne, Quain, Wadsworth, Corley, DeFries, Willcutt and Olson2005; Samuelsson et al., Reference Samuelsson, Olson, Wadsworth, Corley, DeFries, Willcutt, Hulslander and Byrne2007). These genetic influences tend to be stable over time (Harlaar et al., Reference Harlaar, Dale and Plomin2007; Petrill et al., Reference Petrill, Deater-Deckard, Thompson, Schatschneider, DeThorne and Vandenbergh2007), with these early skills correlating with later reading. These relationships are, in fact, mediated primarily through the shared environment, although genetics are moderately influential as well (Harlaar et al., Reference Harlaar, Hayiou-Thomas, Dale and Plomin2008).
Shared environment factors also contribute to some reading skills, including phonological skills and letter identification (Petrill et al., Reference Petrill, Deater-Deckard, Thompson, DeThorne and Schatschneider2006), and print knowledge and vocabulary (Samuelsson et al., Reference Samuelsson, Olson, Wadsworth, Corley, DeFries, Willcutt, Hulslander and Byrne2007). Significant influences of the shared environment on stability over time have also been reported for letter knowledge, phonological awareness, expressive vocabulary, and word knowledge (Petrill et al., Reference Petrill, Deater-Deckard, Thompson, Schatschneider, DeThorne and Vandenbergh2007). Additionally, growth of word and letter identification, pseudo-word decoding and phoneme awareness are also due to shared environment factors, with one- to two-thirds of shared environment variance observable at follow-up, independent of that observed on initial performance (Petrill et al., Reference Petrill, Hart, Harlaar, Logan, Justice, Schatschneider, Thompson, DeThorne, Deater-Deckard and Cutting2010). Importantly, there is evidence of a decrease in the shared environment influence on reading over time, decreasing to nonsignificant levels by grade two for most skills (Byrne et al., Reference Byrne, Samuelsson, Wadsworth, Hulslander, Corley, DeFries, Quain, Willcutt and Olson2007; Byrne et al., Reference Byrne, Coventry, Olson, Samuelsson, Corley, Willcutt, Wadsworth and DeFries2009). Ultimately, the greatest influence of the shared environment on reading is during the preschool and early school years.
When studying possible mediators of the shared environment, plausible candidates are the factors most predictive of between-family differences. For instance, socio-economic status (SES), parent characteristics (such as personality or mental health), cultural practices and norms, and education to name a few. These factors are, in principle, measured aspects of the shared environment as they are experienced equally, for the most part, by twins in a pair. One study has attempted to understand mediators of the shared environmental variance of reading specifically. In a cohort of 7- to 13-year-olds, home chaos was a significant shared environment mediator of reading comprehension even after controlling for SES (Taylor & Hart, Reference Taylor and Hart2014). Their study used the same model we employ below. The authors note the limitations of their point-in-time design. Three other studies used the same design, and while they did not study reading, we review them here given they were of outcome variables related to reading, namely, academic ability (Walker et al., Reference Walker, Petrill and Plomin2005), cognitive ability (Hart et al., Reference Hart, Petrill, Deater-Deckard and Thompson2007), and cognitive functioning (Petrill et al., Reference Petrill, Pike, Price and Plomin2004). All three looked at whether SES mediated the shared environmental variance of their outcome variables. Walker et al. (Reference Walker, Petrill and Plomin2005) showed SES was a significant shared environment mediator of variance in academic achievement, accounting for 83% of the 12% variance attributable to the shared environment. That is, nearly 10% of the overall variance when genetics were accounted for in their point-in-time study of 7-year-olds. Meanwhile, Hart et al. (Reference Hart, Petrill, Deater-Deckard and Thompson2007) found SES independently accounted for only 4% of shared environment variance of cognitive ability. This was stable longitudinally over the 1-year period between the two testing occasions. Finally, Petrill et al. (Reference Petrill, Pike, Price and Plomin2004) observed a similar result, with SES and chaos in the home independently accounting for 11% of the shared environmental variance of cognitive functioning.
Socioeconomic Status (SES)
SES has long been associated with a range of outcomes, particularly in the development and education literature. Yet the relationship between SES and reading is far from accepted. This is perhaps due, in part, to the substantial criticisms of SES, primarily driven by confusion and inconsistency regarding exactly what SES is, and how it should be measured (Duncan & Magnuson, Reference Duncan, Magnuson, Bornstein and Bradley2003; Marks et al., Reference Marks, McMillan, Jones and Ainley2000). Broadly, SES refers to the position of a family compared to others hierarchically. It describes their overall standing and reflects indicators such as education and income (APA Taskforce on Socioeconomic Status, 2007). Inconsistency abounds, however, on how to measure SES what components reflect SES, to the extent that there are ultimately limited ‘universal truths’ commonly accepted (Marks, Reference Marks2011). Some argue income is the single best index (Galobardes et al., Reference Galobardes, Shaw, Lawlor, Lynch and Davey Smith2006), but response rates can be weak (Yan et al., Reference Yan, Curtin and Jans2010), so for this reason we opted against this measure in the current study. Others argue parental education and occupation are most reflective of SES (Marks et al., Reference Marks, McMillan, Jones and Ainley2000), and on account of their higher response rates we measured these instead.
Time in Preschool (TiP)
Claims concerning the beneficial impact of preschool are many, including school readiness (Belsky et al., Reference Belsky, Vandell, Burchinal, Clarke-Stewart, McCartney and Owen2007), socio-emotional adjustment (Peisner-Feinberg & Burchinal, Reference Peisner-Feinberg and Burchinal1997), later academic success, and reading development (Campbell et al., Reference Campbell, Pungello, Miller-Johnson, Burchinal and Ramey2001). Elements of the preschool experience that are specifically responsible vary too, from teacher characteristics to environmental richness (Connor et al., Reference Connor, Son, Hindman and Morrison2005). There is minimal regularity between studies regarding what ‘preschool’ comprises, how best to measure it, and which varying analytical methods are used. As such, it can be difficult obtaining a clear picture of how TiP relates to outcomes such as reading. Gorey (Reference Gorey2001) eloquently expressed this in his meta-analysis of the short- and long-term benefits of early childhood education:
My review of recent reviews and editorials … they have typically only qualitatively summarized diverse outcomes observed by diverse studies of diverse preschool programs, it is exceedingly difficult to develop a clear picture of what is really happening. (p. 13)
Results of Gorey’s (Reference Gorey2001) meta-analysis identified, first, that the effects of intense programs fade less over time than programs of lower intensity. Second, better quality preschool relates to a 50% less chance of failing grades and high school drop out later in a child’s life. This pronounced effect would have likely been attenuated had they controlled for SES, and to this end, the current study incorporates SES. Further, in studying the amount of time a child spends at preschool and how it relates to reading specifically, the current study will be somewhat novel in using a genetically sensitive design.
TiP, SES and Reading
The interaction between preschool attendance, SES, and reading has been somewhat explored in nongenetically sensitive research. Children from lower SES backgrounds reportedly displayed stronger effects of preschool attendance on reading skills as measured at kindergarten entry than those of a higher SES background (Magnuson & Waldfogel, Reference Magnuson and Waldfogel2005). Similarly, children from low-income backgrounds benefit most in terms of reading by spending 30 or more hours per week at preschool (Loeb et al., Reference Loeb, Bridges, Bassok, Fuller and Rumberger2007). The same study revealed middle- to high-income families’ children see benefits to reading skill from no more than 30 hours per week at preschool. This highlights that TiP has differential effects on reading ability, interacting with SES to produce variable outcomes. A genetically sensitive design could plausibly further dissect the variance contributions of these variables, to clarify their impact individually and when interacting on later reading skill.
The current study replicates the prior literature in studying SES, but extends it by assessing whether (a) preschool or (b) the interaction between preschool and SES also mediate reading’s shared environmental variance. Further, it addresses this issue longitudinally, to inform on how the influence of SES and TiP vary over time.
Behaviour Genetics, Reading and SES
Current Study
The study will first run phenotypic (i.e., nontwin) analyses to assess the relationships between SES, TiP and reading. It will then assess these association using behavior genetic analyses.
An additional aim is to explore the impact of grade by assessing the effects across preschool, kindergarten, Grade 1 and Grade 2. Given that shared environment influence tends to decline over time, we expect significant main effects at preschool that fade by grade two. Specifically, we hypothesize:
-
(1) When assessed using a phenotypic regression, SES, TiP, and their interaction will be significantly related to reading. Specifically, the moderating effect will see the negative effects of low SES on reading ameliorated by TiP.
-
(2) Using behavior genetic methods, SES, TiP, and their interaction will significantly mediate shared environment variance in reading scores at the preschool level.
-
(3) The mediating effects of SES, TiP and their interaction will be significant at preschool, but will decline over time to nonsignificance by Grade 2.
Method
Participants
This study uses preexisting data from the International Longitudinal Twin Study (ILTS) investigating reading in children across Australia, US and Scandinavia (Norway and Sweden). The total number of twin pairs was 1026, with 511 monozygotic (MZ) twin pairs, and 515 dizygotic (DZ) same-sex twin pairs. DNA confirmed zygosity for 83%; for the balance we used a questionnaire with 95% accuracy.
Twins were recruited in Australia from the Australian Twin Registry, from the Colorado Twin Registry in the US, and using medical birth records in Scandinavia. All twins were in their final year of preschool when recruited and all spoke the native language of their country as their first language. In Australia and Scandinavia, participants’ families were contacted by mail, and in the US, families were contacted by either mail or phone. Age at initial testing ranged; in the US, 54−71 months (M = 58.8 months, SD = 2.5); in Australia, 47−68 months (M = 57.8 months, SD = 3.9); and in Scandinavia, 58−68 months (M = 61.2 months, SD = 1.8). Only the US participants’ families received incentive for participation, of $100.
Measures
Different measures of reading by grade. The measures of reading necessarily differed across preschool, kindergarten, Grade 1 and Grade 2. At preschool, the mean value of phonological awareness and print knowledge scores provided a reading composite, consistent with previous research showing these skills are predictive of later reading (McCardle et al., Reference McCardle, Scarborough and Catts2001). This has also been the method used in previous work with this sample (for details, see Byrne et al., Reference Byrne, Delaland, Fielding-Barnsley, Quain, Samuelsson, Hoien, Corley, DeFries, Wadsworth, Willcutt and Olson2002). In the subsequent grades (kindergarten, and Grades 1 and 2), the Test of Word Reading Efficiency (TOWRE) measure of reading was used.
Phonological awareness. The phonological awareness composite (Samuelsson et al., Reference Samuelsson, Byrne, Quain, Wadsworth, Corley, DeFries, Willcutt and Olson2005) comprised of the following, with Cronbach alphas (α) shown in brackets:
-
• Sound matching: involved identifying one of three words that either began or ended with the same sound as the target word (α = .77).
-
• Elision tasks: required children to remove either single syllable words from compound words (α = .77) or a syllable or phoneme from words to create new words, for example, /s/ from /sat/ (α = .49).
-
• Blending tasks: required children to add together single syllable words to form compound words (α = .84), or add syllables or phonemes together to create words (α = .76). Twelve trials for each blending and elision task were presented.
-
• Rhyme and final sound tasks: required children to identify rhyming words and recognize when words ended with the same sound. Ten rhyme trials and six final sound items were presented, both verbally and with pictures (α = .68).
Print knowledge. The print knowledge composite combined scores from four tasks; (a) concepts about print (α = .83, Clay, Reference Clay1975), to test for understanding of print conventions, (b) and (c) letter recognition of both names (α = .92) and sounds (α = .87), and (d) a test of environmental print to assess contextualized ability (α = .46); for example, environmental print that included ‘Stop’ on a stop sign. Average Cronbach reliability was acceptable at α = .80.
Test of Word Reading Efficiency (TOWRE). Reading in kindergarten, and Grades 1 and 2 was measured using the TOWRE (Torgesen et al., Reference Torgesen, Wagner and Rashotte1999), consisting of two subscales: Sight Word Efficiency (SWE) and Phonemic Decoding Efficiency (PDE), which were combined and analyzed as a single scale. The SWE test presented true words, while the PDE used nonwords that were nonetheless pronounceable, — for example, ‘frumble’. Scores reflected the number of words read correctly in 45 seconds. Test-retest reliability for children aged 6−9 years was r = .97 and r = .90 for SWE and PDE respectively.
Time in preschool. Parents of twins filled out a form comprised of 43 questions including questions about preschool attendance. Specific questions relevant here were ‘Days attending preschool’ (reported as hours per week) and ‘Time attending on those days’ (reported as hours per day). Parents also recorded their current or most recent occupation. Again, these details were the same for both twins in a pair.
SES: Level of education. As part of the initial assessment, parents of twins completed the Family Reading Survey (Whitehurst, Reference Whitehurst1992). This included a question where parents recorded their highest level of education, and that of their spouse. Responses ranged from ‘some high school’ to ‘PhD’. For all twins in the sample, parent education level was the same for both twins in a pair. Parent education was coded differently for each country in the sample. These codes were arbitrary. As such, we recoded the existing codes into values reflecting actual years of education, establishing consistency across the countries. This ensured a continuous rather than categorical variable, with levels that were quantifiable and based on meaningful differences between levels.
SES: Occupation. The International Socioeconomic Index of Occupational Status (ISEI-08; Ganzeboom & Treiman, Reference Ganzeboom and Treiman1996) provides an internationally comparable occupational status code for an occupation. It was felt both conceptually and theoretically prudent to use an internationally developed measure in this study, since the sample represents four countries. In the ISEI, codes range from 10−89, with higher scores representing higher status occupations. The ISEI maximizes the influence of occupation on income after the effect of education (Ganzeboom & Treiman, Reference Ganzeboom and Treiman1996). This study uses the most recent version, being the ISEI-08. The occupation titles entered by participants were coded using the ISEI-08 occupation codes. When a job title entered had no discernible related code, it was not possible to allocate a value, so it was treated as missing. The original ISEI correlated with other SES measures, r = .76−.90. The updated ISEI-08 correlates with its predecessor, r = .92, indicating validity (Ganzeboom, Reference Ganzeboom2010).
SES composite. A factor analysis of mothers’ and fathers’ education and occupation revealed a single factor underlying the four variables and accounting for 60.26% of variance. This is consistent with the precedent in the literature. Accordingly, these four items were combined into a single SES scale. A parent-average for both education and occupation was created, and the two were then combined. Where only one parent had a score on either education or occupation, that score was used in the place of the parent average. If both parents were missing on either education or occupation they were excluded from the scale.
Procedure
With parental consent, preschool testing took place in either the homes or preschools of the children, with tests administered individually to each child. To avoid tester bias, in at least Australia and the US, separate testers assessed children of a twin pair. However, this was not possible in Scandinavia. Testing normally took place over 5 days during a 1- to 2-week period, with sessions including rewards such as stickers and stories. There was consistency in test administration, reward time, and story reading order across the three countries. Kindergarten, Grade 1 and Grade 2 follow-up assessments were conducted in single hour-long sessions.
Analyses: Multivariate Mediation Model
Using the Mx software package (Neale et al., Reference Neale, Boker, Xie and Maes2004), we assessed the role of SES, TiP and their interaction as mediators of the shared environmental variance of reading. By definition, SES and TiP represent sources of shared environmental variance since they are generally shared by both members of a twin pair. Thus, the model initially partitions the variance into that explained by genetics, shared environment and unique environment, but then further identifies any shared environmental variance explained by SES, TiP, or SES × TiP. Figure 1 presents a path diagram of the model. Circles represent latent variables and squares represent observed variables with path coefficients reflecting the strength of the paths between variables, relative to others. Each side of the diagram represents a twin in a pair, with arcs representing the covariance between twins. The values for these arcs are the correlations between either identical (MZ) pairs or fraternal (DZ) pairs, which for additive genes are 1.0 and 0.5 respectively since MZ twins share all their genes while DZ twins share half their segregating genes on average. Both MZs and DZs share the shared environment (C) and neither share the unique environment (E).
Cholesky with an added mediation model estimating genetic, shared environment, unique environment and measured shared environment variance for preschool, kindergarten, Grade 1, and Grade 2 reading ability. Path coefficients are provided for one twin only, for simplicity. Dotted lines represent nonsignificant paths, evaluated by confidence intervals.

In the upper portion of Figure 1 (i.e., above the four manifest reading variables), the variance is partitioned into A, C and E. These sources of variance are then, in turn, partitioned across the four time points using a Cholesky decomposition model. Specifically, A1 represents the genetic influence on reading at preschool that continues to be influential at each of the later time points. By contrast, A2 represents new genetic influences emerging at kindergarten and also affecting Grade 1 and Grade 2, and so on, such that A4 captures new genetic effects at just Grade two. The same holds for C and E effects.
The bottom portion of the diagram presents the mediation segment. If the mediating variables (SES, TiP and SES × TiP) are not included in the model, any variance they contribute would be part of C. When they are included, some of the variance in C is then explained by latent variables that represent the mediating effects. Specifically, the latent SES variable represents the variance shared by all three manifest variables. The latent TiP variable represents the variance explained by the manifest TiP and SES × TiP variables after controlling for any manifest SES effects. Finally, the latent SES × TiP variable represents just the manifest interaction after controlling for the main effects.
To evaluate the individual contributions of the mediating paths (SES and TiP), we compared the saturated model (that included all paths in Figure 1) to various nested models (where some paths are fixed at zero): for instance, where one of the latent mediator variables was retained while the others were fixed at zero. This provided estimates of the independent influence of SES, TiP and SES × Tip. In this study, the path coefficients presented in Figure 1 are those from the saturated model, since they are less biased than those of nested models (Keller & Coventry, Reference Keller and Coventry2005). Dotted rather than solid lines represent nonsignificant paths as assessed by 95% confidence intervals.
Results
Data Cleaning
In accord with standard twin studies, all scores were standardized by age, sex, and country (McGue & Bouchard, Reference McGue and Bouchard1984). Large scores were truncated to +/−3. Positive skews were present for reading at preschool and kindergarten, and for TiP. These were corrected with a square root, log and inverse transformation respectively. All associations were linear. Main effects were centered prior to the analyses to reduce multicolinearity. There was no sequential dependence.
Phenotypic Analyses
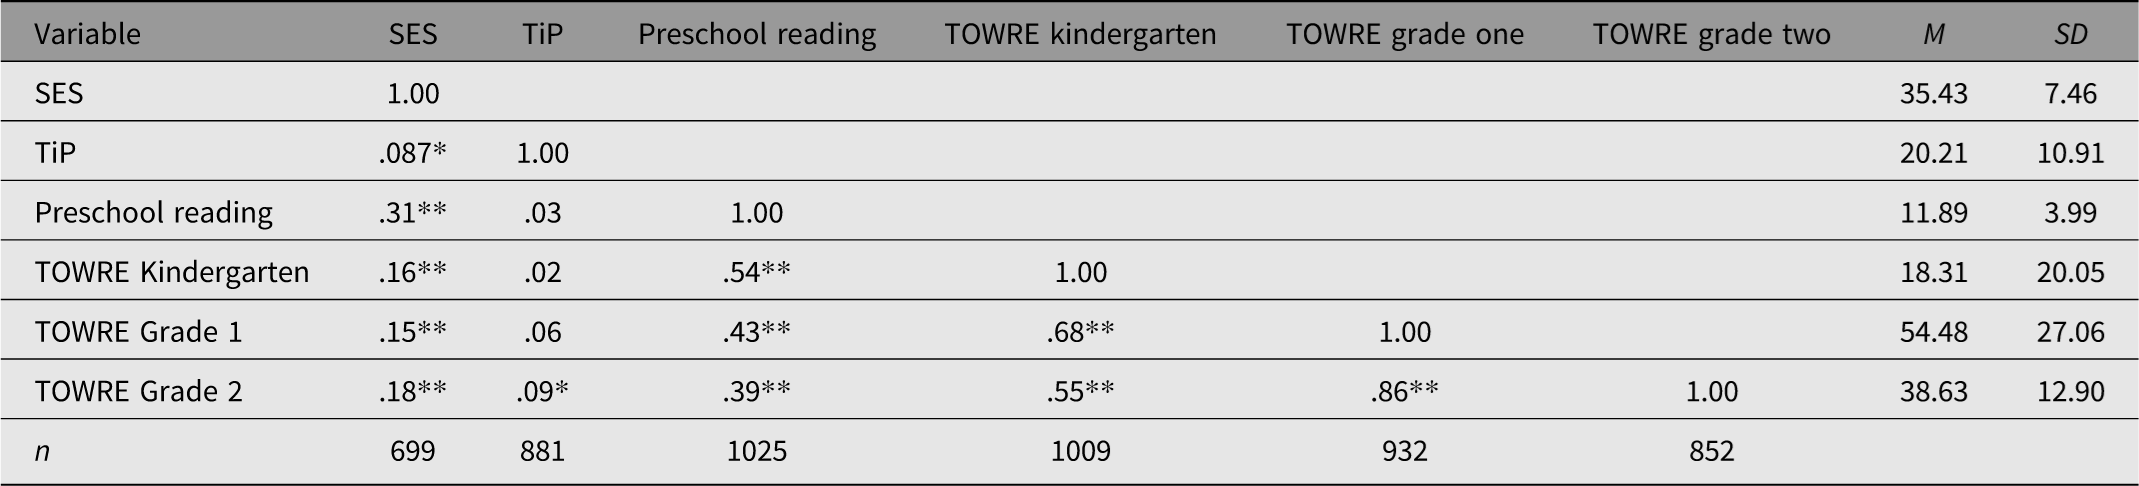
For all phenotypic analyses, one twin from each pair was selected at random: including both would violate the assumption of independence. Scores on TiP ranged from 0−50 hours per week. SES scores ranged from 17 to 55, and SES × TiP ranged from 0−50.75. Pearson’s correlations, means and standard deviations for SES, TiP and reading are presented in Table 1. The correlations between SES and reading in preschool were initially moderate but decreases over time. For TiP and reading, the correlations were initially very small but significant by Grade 2 on account of the large sample. To ensure no pronounced differences by country, we ran these analyses split by country. The differences observed were (a) not in any consistent direction, and (b) generally explained less than 2% of the variance explained.
Summary of Pearson’s correlations, means, and standard deviations for scores of SES, TiP and reading ability across time

Table 1. Long description
A table with 8 rows and 9 columns. The columns are labeled SES, TiP, Preschool reading, TOWRE kindergarten, TOWRE grade one, TOWRE grade two, M, SD, and n. The rows are labeled SES, TiP, Preschool reading, TOWRE Kindergarten, TOWRE Grade 1, TOWRE Grade 2. Row 1: SES, 1.00,, , , , , 35.43, 7.46, 699. Row 2: TiP, .087*, 1.00,, , , , 20.21, 10.91, 881. Row 3: Preschool reading, .31**, .03, 1.00,, , , , 11.89, 3.99, 1025. Row 4: TOWRE Kindergarten, .16**, .02, .54**, 1.00,, , , 18.31, 20.05, 1009. Row 5: TOWRE Grade 1, .15**, .06, .43**, .68**, 1.00,, , 54.48, 27.06, 932. Row 6: TOWRE Grade 2, .18**, .09*, .39**, .55**, .86**, 1.00,, 38.63, 12.90, 852. The table presents Pearson’s correlations, means, and standard deviations for SES, TiP, and reading ability scores across different time points.
Note: SES, socioeconomic status; TiP, time in preschool (hours per week); TOWRE, Test of Word Reading Efficiency. *p < .05, **p < .01.
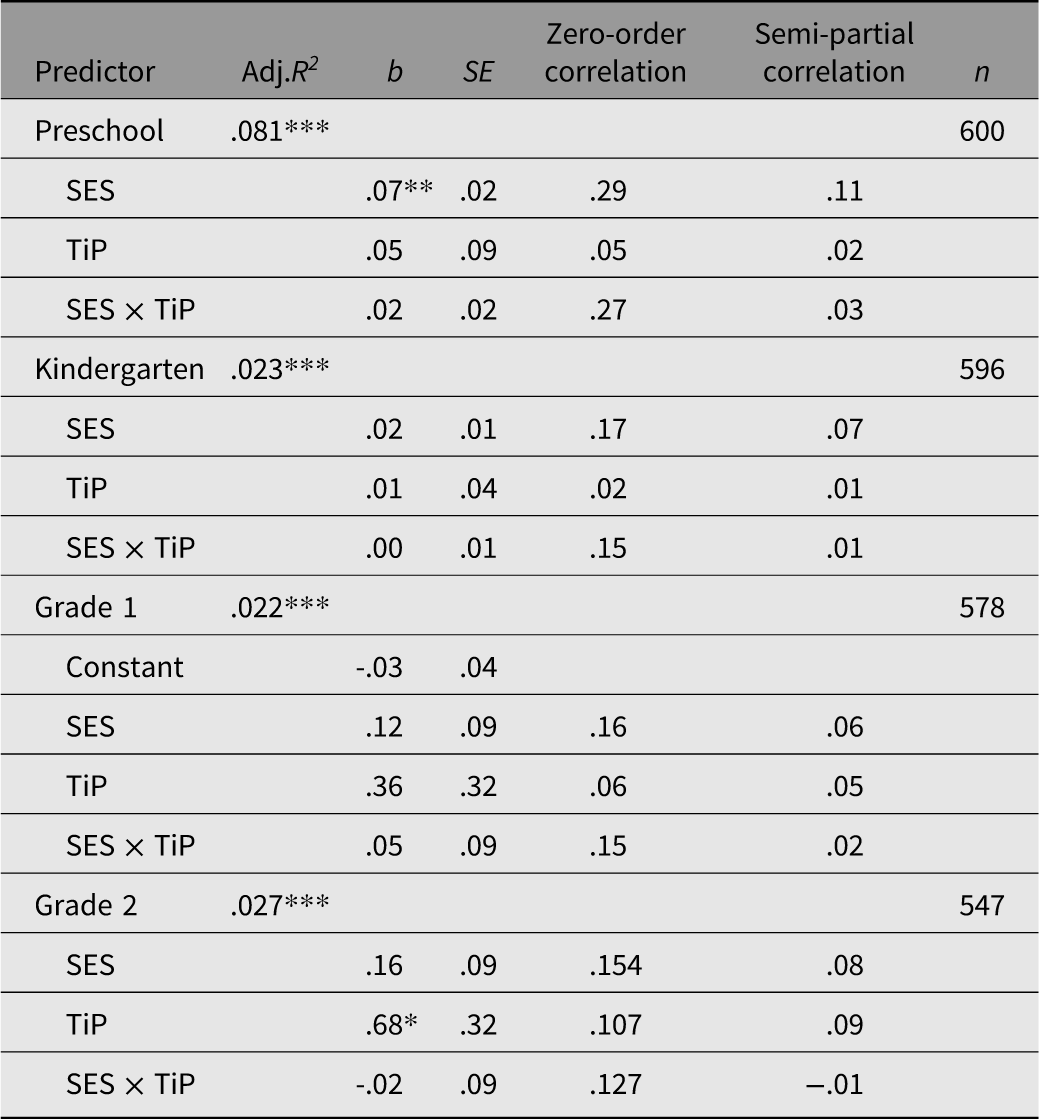
Hypothesis 1 being that SES and TiP are predictive of reading ability scores from preschool to Grade 2 at the phenotypic (nongenetic) level was assessed by multiple regressions at each time point.
The four regression models were significant, explaining 8%, 2%, 2% and 3% of the variance at preschool, kindergarten, Grade 1 and Grade 2 respectively (see Table 2). This significance was to be expected given the large sample size. The semipartial correlations suggested each individual predictor explained, for the most part, negligible variance. Overall, the phenotypic analysis reveals that hypothesis 1 was supported with SES and TiP significantly predicting reading across time, but this is driven by the large sample size: importantly, only a small portion of variance was explained by these factors.
Predictors of reading ability from preschool to Grade 2

Table 2. Long description
A table with four rows and seven columns comparing predictors of reading ability from preschool to Grade 2. The columns are labeled Predictor, Adj.R squared, b, SE, Zero-order correlation, Semi-partial correlation, and n. The rows are labeled Preschool, Kindergarten, Grade 1, and Grade 2, with additional sub-rows for SES, TiP, and SES x TiP under each grade. Each row contains values for the respective predictors and their statistical measures. Notable trends include varying levels of significance and correlation across different grades and predictors.
Note: SES, socioeconomic status; TiP, time in preschool (hours per week); TOWRE, Test of Word Reading Efficiency. *p < .05, **p < .01, ***p < .001.
Behavior Genetic Analyses
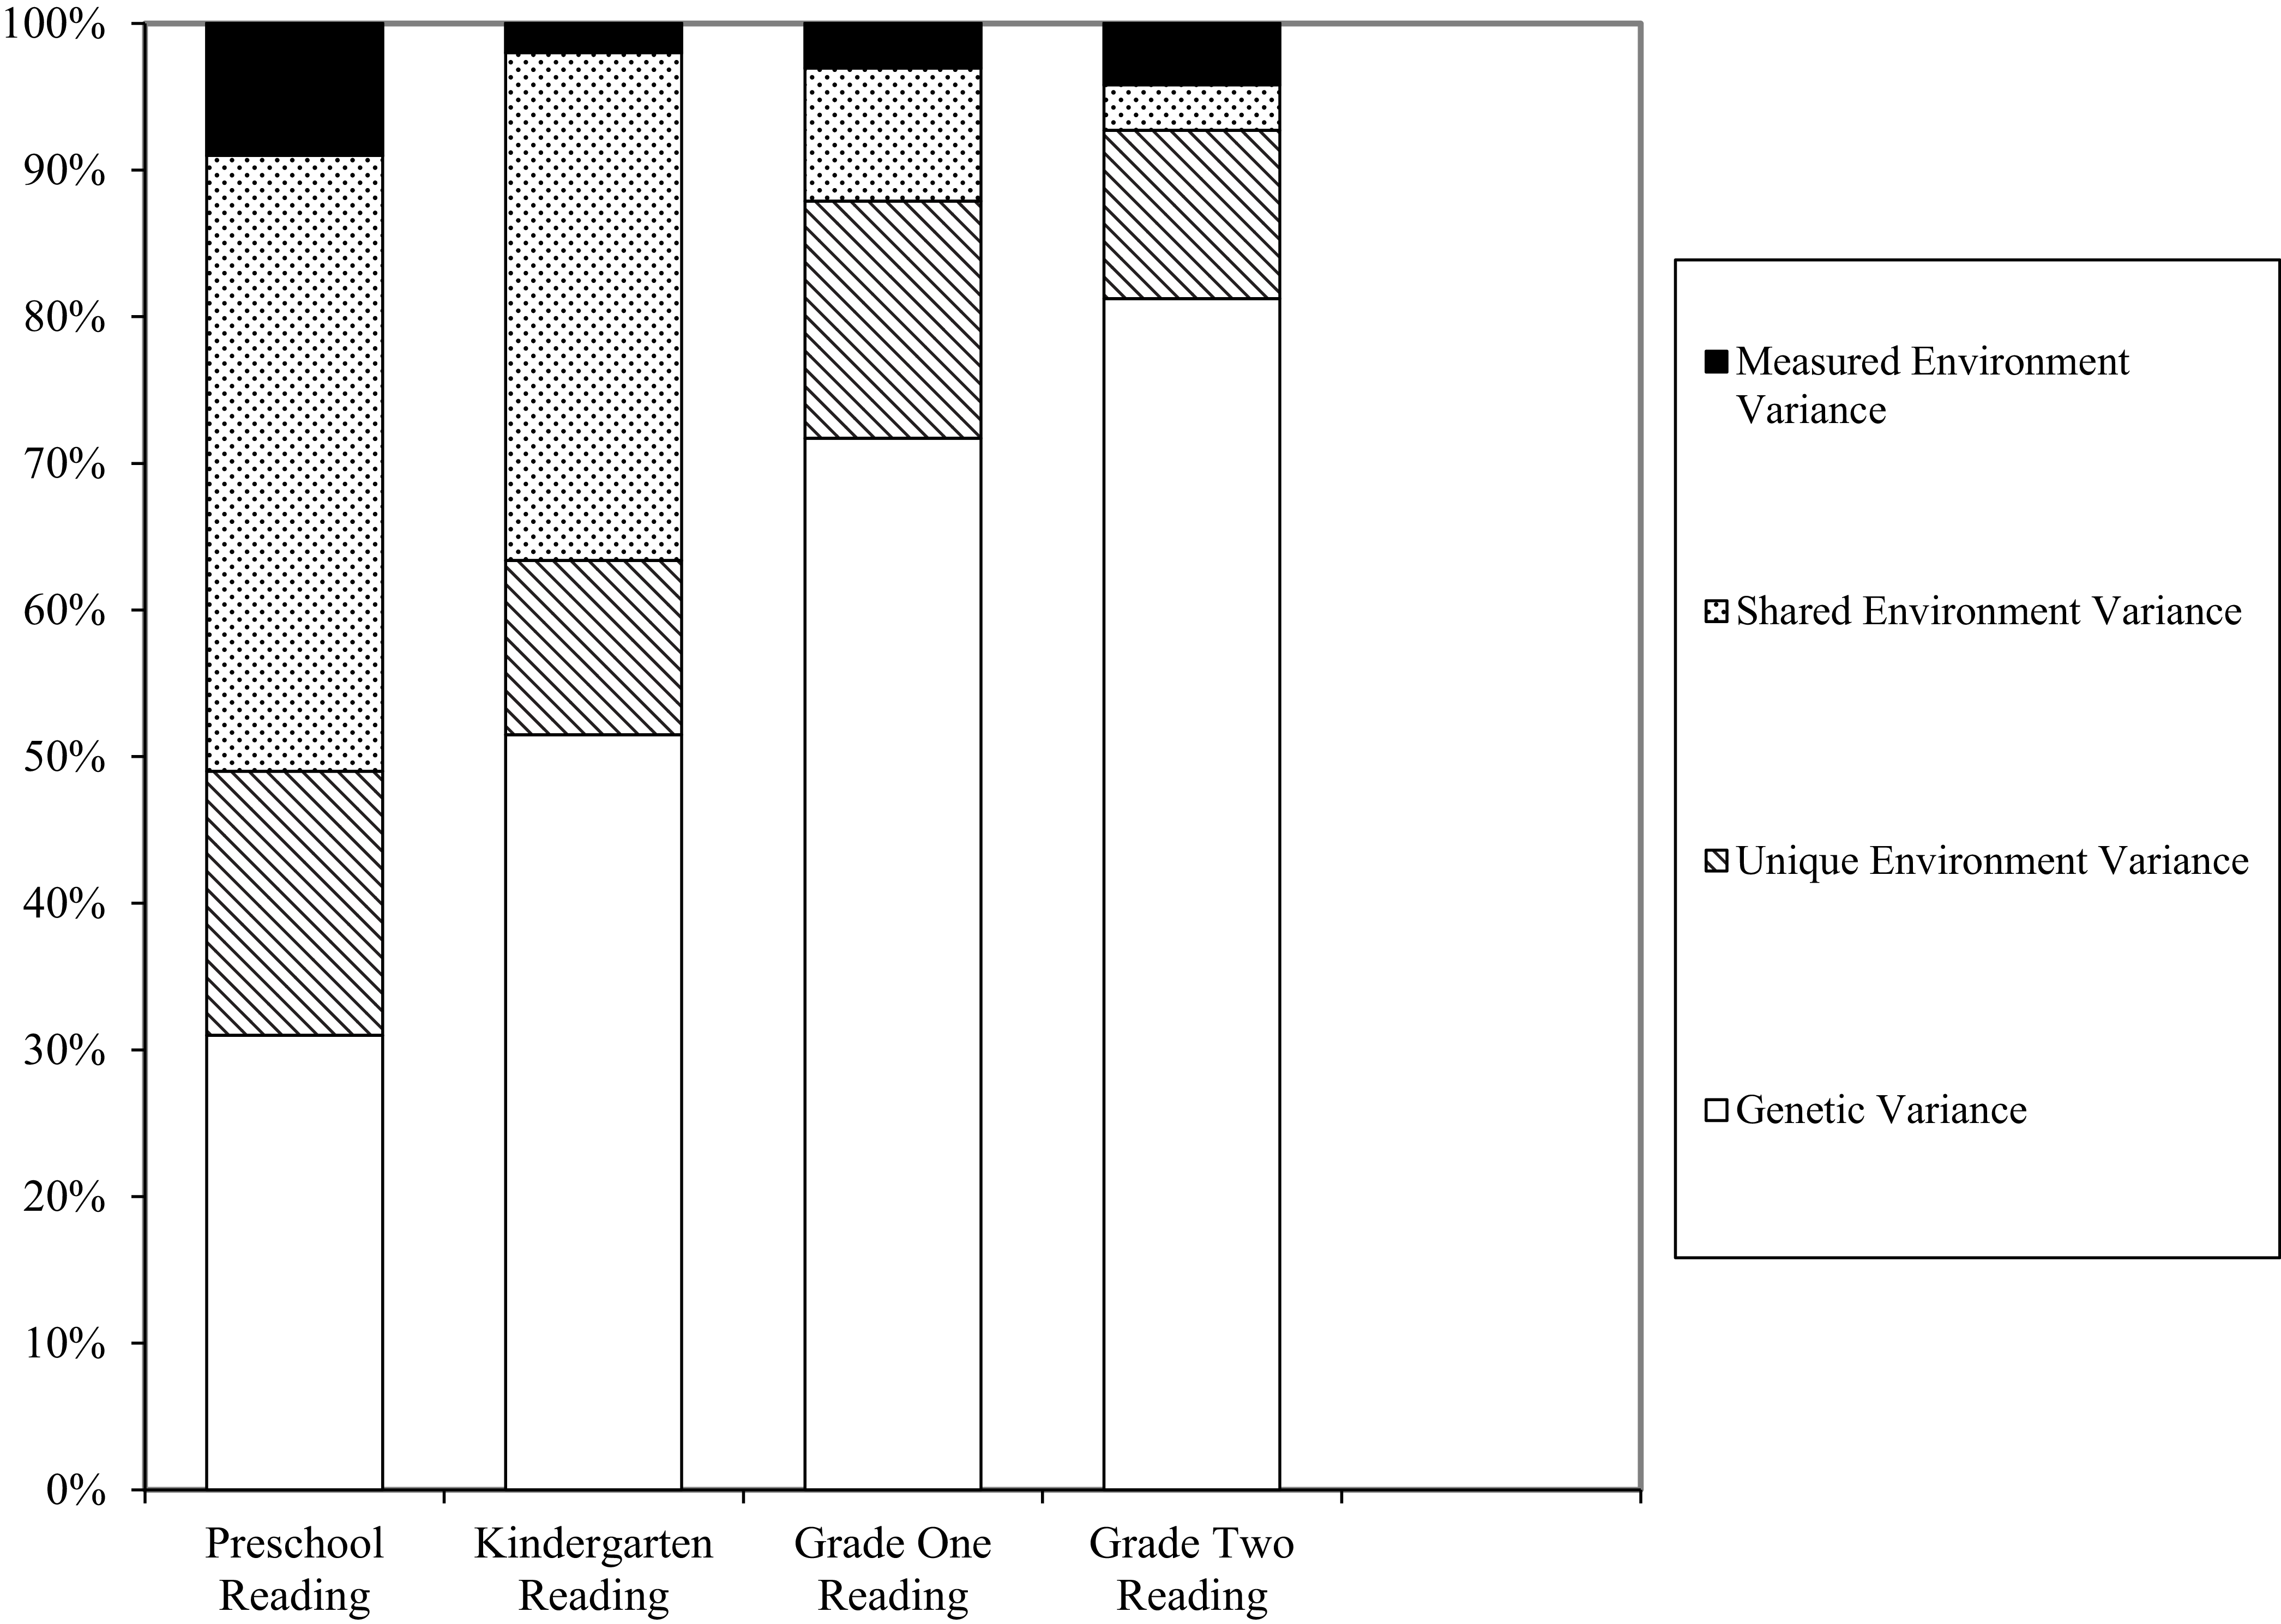
The estimates of A, C and E for reading across time were as follows. In preschool, A, C and E accounted for 31%, 51% and 18% of the variance. In kindergarten, these values were 52%, 35% and 12%. By Grade 1, 71%, 9% and 16%. By Grade 2, 78%, 3% and 11% of the variance. This indicates a general trend of increasing genetic influence on reading over time, with a decreasing influence of the shared environment. The unique environmental influence also decreases over time, but to a lesser extent. This is consistent with previous research using this sample (Byrne et al., Reference Byrne, Coventry, Olson, Samuelsson, Corley, Willcutt, Wadsworth and DeFries2009; Byrne et al., Reference Byrne, Delaland, Fielding-Barnsley, Quain, Samuelsson, Hoien, Corley, DeFries, Wadsworth, Willcutt and Olson2002; Byrne et al., Reference Byrne, Olson, Samuelsson, Wadsworth, Corley, DeFries and Willcutt2006; Byrne et al., Reference Byrne, Samuelsson, Wadsworth, Hulslander, Corley, DeFries, Quain, Willcutt and Olson2007; Samuelsson et al., Reference Samuelsson, Byrne, Quain, Wadsworth, Corley, DeFries, Willcutt and Olson2005; Samuelsson et al., Reference Samuelsson, Olson, Wadsworth, Corley, DeFries, Willcutt, Hulslander and Byrne2007).
First, some background on the mediation portion of the model. The manifest mediating variables loaded, conveniently, in simple ways on the latent mediating variables. The SES latent variable represented primarily SES and the interaction term, as can be seen in Figure 1. The TiP latent variable represented, conveniently, just manifest TiP effects. The latent interaction term represented, of course, just the manifest interaction effects. These findings make the latent mediator variable easy to interpret.
We consider in turn the variance explained by each of the mediators at each grade. Latent SES alone accounted for 9%, 2%, 3% and 3% of the variance at the four grades respectively, latent TiP accounted for no variance at preschool and kindergarten, and 1% at Grades 1 and 2, and the interaction accounted for no variance at any grade.
Presented in Figure 2 is the variance in reading partitioned at each time point into genetic influence, shared environment influence, unique environment influence and mediator influence (i.e., SES, TiP and their interaction). The figure clearly shows the contribution of the mediators relative to, for instance, that of genes.
Proportions of variance in reading explained by genetic, unique environment, shared environment and mediators across time.

What proportion of the shared environment was explained by the mediators? This must be viewed in light of the substantial drop in C across the grades; 51%, 35%, 9% and 3% of the variance at preschool, kindergarten, Grade 1 and Grade 2 respectively. With this in mind, at preschool, the SES mediator explained 18% of this total shared environment variance (i.e., 9/51). However, this varied across time. The proportion of C variance accounted for by the mediating variables was 18%, 5%, 25% and 57% at preschool, kindergarten, Grade 1 and Grade 2 respectively. In sum, there was an overall decrease in variance explained by both C and the mediators over time, but with the mediated proportion of C variance increasing over time, and accounting for a majority of overall C by Grade 2.
Discussion
This study aimed to evaluate the influence of SES and TiP on reading as shared environment mediators over time in a genetically sensitive design. SES accounts for nearly all the variance explained by the mediating variables. The variance accounted for by TiP became significant by Grade 1 and Grade 2 but only accounted for a small proportion of the variance. The interaction between TiP and SES explained no variance in reading at any stage. Finally, SES and TiP together mediate an increasing proportion of shared environment variance over time. This is driven the very small and nonsignificant amount of variance explained by the common environment at Grade 2.
The results from this study are somewhat consistent with past research. TiP in this study did not account for variance in reading at preschool to kindergarten, a result also found by Belsky et al. (Reference Belsky, Vandell, Burchinal, Clarke-Stewart, McCartney and Owen2007). While the early childhood literature presents an argument for increased TiP due to the positive outcomes, the current results suggest, in terms of reading, hours per week at preschool alone are not related to better outcomes. This supports the work of Little et al. (Reference Little, Larsen, Byrne, Logan, Olson and Coventry2020), where early childhood education was not a significant moderator of heritability of later achievement. It is important to note that the current study only investigated reading as an outcome, where previous work has found other phenotypes, such as vocabulary, were significantly influenced by shared environment across time (Byrne et al., Reference Byrne, Coventry, Olson, Samuelsson, Corley, Willcutt, Wadsworth and DeFries2009). It is possible TiP influences other outcomes not measured here.
The total variance in reading due to SES in this study, being 2−8%, is consistent with prior work into SES and reading. Our estimates were slightly lower than the 13% of reported by Marks (Reference Marks2011), which may be due to his older sample of 15-year-old students. The results of this study are closer to that of Walker et al. (Reference Walker, Petrill and Plomin2005) who reported SES as explaining 10% of total variance in academic achievement in a genetically sensitive design of 7-year-old students.
One surprising finding of the current study was that SES accounted for a large proportion of the small amount of shared environment variance at Grade 2, following a similar trend to Walker et al. (Reference Walker, Petrill and Plomin2005). Their study also found SES accounted for a large portion of the shared environment variance in their sample of 7-year-olds. This suggests a trend of SES becoming an increasingly important component of C as children develop. Although research suggests that the overall shared environment influence decreases to low levels by Grade 2, it is important to recognize that SES could still be affecting this outcome. While our measure used both parent education and occupation, a measure that incorporated income as well might account for even more of the variance.
Other work has found contrasting results, being that SES accounts for only 4% of the shared environment variance in cognitive ability (against our 5% and 25% at kindergarten and Grade 1 respectively). The sample comprised kindergarten and first-grade children (Hart et al., Reference Hart, Petrill, Deater-Deckard and Thompson2007). Hart et al. (Reference Hart, Petrill, Deater-Deckard and Thompson2007) examined cognitive ability, not reading, which may explain the contrasting results. Another explanation could be that the sample used by Hart et al. was nearly a quarter of the size (n = 287 twin pairs) of both the current study (n = 1026 twin pairs) and that of Walker et al. (Reference Walker, Petrill and Plomin2005) (n = 1063 twin pairs). This is an issue that replication could address.
The SES indicator used by Hart et al. (Reference Hart, Petrill, Deater-Deckard and Thompson2007) may be another cause of the small effect of SES reported. The work of Walker et al. (Reference Walker, Petrill and Plomin2005) used a very similar composite to that employed in the current study, being maternal education and occupation, paternal education and occupation, and an additional factor not used in the current study, being maternal age at the birth of the first child. Hart et al. only used maternal education. This is a traditional SES indicator, but research has identified composites consisting of parents’ education and occupation as most reflective of SES (Marks, Reference Marks2011).
This study also assessed whether an interaction between SES and TiP accounted for the variance in reading, which was found to not be the case. This contrasts with work by Loeb et al. (Reference Loeb, Bridges, Bassok, Fuller and Rumberger2007), who report TiP as particularly beneficial for children from low SES backgrounds. On closer inspection, methodological issues in the work of Loeb et al. may account for this. The authors dichotomized TiP and income, rather than leaving them as continuous variables. This can lead to spurious interactions (Eaves, Reference Eaves2006; Maxwell & Delany, Reference Maxwell and Delaney1993; Royston et al., Reference Royston, Altman and Sauerbrei2006). It may be worthwhile repeating their analysis with TiP and SES as continuous rather than dichotomous.
Limitations and Future Directions
There are three main limitations. First, we might have reduced the missingness of occupation had the ISEL index coded for home maker or similar, but it did not, and 28% of mothers in the sample reported their occupation as home maker or similar. So, we were unable to give them a value on mother occupation. While the ISEL was the best regarded international index available at the time, future research may wish to use an index that assigns an SES value on the home-maker occupation.
Second, the preschool programs attended by participants varied immensely in the current study, and was a potential confound. For example, preschool quality, educational focus versus care-only settings, and educator training may influence the impact of TiP on later reading. In addition, the TiP of the current sample may not be representative of the average hours of TiP as at the time these data were collected. When split by country, average weekly hours of TiP (SD bracketed) were 18 (7), 17 (11) and 29 (8) for Australia, the US and Scandinavia respectively. Now, if anything, twins spend less TiP than nontwins (Tucker-Drob, Reference Tucker-Drob2012). However, compared to the TiP of nontwins per week, the current sample typically had slightly higher averages on TiP in each country (Dowling & O’Malley, Reference Dowling and O’Malley2009; Early Education and Care Policy Finland, 2001; Stebbins, Reference Stebbins2003). This likely reflects the slightly higher than average SES of the current sample.
Future behavior genetic methods could consider specific preschool programs or measures of educator quality/training; for example, to explain the variance in reading. Alternately, targeting poor readers could aid in identifying elements of the shared environment that help or hinder reading in such a sample. The substantial portion of shared environmental variance explained by SES at Grade 2 in this study requires further study. Exploring past and concurrent SES influences on reading but using older participants, in a behavior-genetic longitudinal design, would be ideal.
Conclusions
In studying the window prior to and during formal schooling, this study affords a precious lens into the roles of SES and C across this pivotal developmental stage. This study provides evidence that SES, but not TiP, explains variance in reading ability across time. Further, this SES influence attenuates when formal schooling commences. That said, SES is ultimately an enduring portion of the C variance of reading, as it still contributes to variance once school commences, despite attenuating. This is in stark contrast to the expanse of available C variance in the preschool years, which wilts away even more substantially when formal schooling commences.
Acknowledgments
We are grateful for support from the Australian Twin Registry and the Australian Multiple Birth Association. We also thank the twins and their parents, and our testers: in Australia, Frances Attard, Nicole Church, Marreta Coleman, Cara Newman; in Norway, Bjarte Furnes; in Sweden, Inger Fridolfsson, and Christina Wiklund; in the USA, Kim Corley, Rachael Cole, Barb Elliott, Kari Gilmore, Angela Villella, and Ingrid Simece.
Funding
The research was supported by the University of New England’s strategic initiative fund, the Australian Research Council (DP0663498 and DP0770805), the National Institute for Child Health and Human Development (HD27802 and HD38526), the Research Council of Norway (154715/330), the Swedish Research Council (345-2002-3701 and PDOKJ028/2006:1), and Riksbankens Jubileumsfond and The Knut and Alice Wallenberg Foundation (PDOKJ028/2006:1).


 Open access

