


1. Introduction
Thermal convection is ubiquitous in nature and industrial applications, such as lithospheric, oceanic and atmospheric circulations, and convective flows in heat exchangers or in pipes of power plants. The idealized model for studying thermal convection is Rayleigh–Bénard (RB) convection, i.e. a horizontal working fluid layer heated from below and cooled from above, which has been studied extensively over the past decades (Ahlers, Grossmann & Lohse Reference Ahlers, Grossmann and Lohse2009; Lohse & Xia Reference Lohse and Xia2010; Chillà & Schumacher Reference Chillà and Schumacher2012). According to the physical picture of an RB system, the convective heat transport is mainly characterized by the multi-scale interactions between the large-scale circulation (LSC) and thermal plumes detached from the boundary layers (BLs) (Grossmann & Lohse Reference Grossmann and Lohse2000). However, in most real-life situations, thermal convection can be much more complicated with the external shear and roughness, both of which affect the characteristics of the LSC and BLs. For instance, in the atmospheric circulation, the topology roughness and the horizontal wind both play an important role in the formation of thermoconvective storms (Bluestein Reference Bluestein2013).
The introduction of roughness to RB convection has been proven to effectively break turbulent structures within BLs and significantly affect the heat-transport efficiency (Tisserand et al. Reference Tisserand, Creyssels, Gasteuil, Pabiou, Gibert, Castaing and Chillà2011; Jiang et al. Reference Jiang, Zhu, Mathai, Verzicco, Lohse and Sun2018; Dong et al. Reference Dong, Wang, Dong, Huang, Jiang, Liu, Lu, Qiu, Tang and Zhou2020). The first experiment on turbulent RB convection over pyramid-type rough elements by Shen, Tong & Xia (Reference Shen, Tong and Xia1996) and Du & Tong (Reference Du and Tong1998) showed that wall roughness promotes the detachment of thermal plumes from the tip of roughness and thus enhances the heat transport. It is found that roughness-facilitated heat-transport enhancement exhibits not only an increase on the heat-transport scaling prefactor (Shen et al. Reference Shen, Tong and Xia1996; Du & Tong Reference Du and Tong2000; Shishkina & Wagner Reference Shishkina and Wagner2011) but also an increase on the scaling exponent (Roche et al. Reference Roche, Castaing, Chabaud and Hébral2001; Wei et al. Reference Wei, Chan, Ni, Zhao and Xia2014; Wagner & Shishkina Reference Wagner and Shishkina2015; Xie & Xia Reference Xie and Xia2017). Xie & Xia (Reference Xie and Xia2017), Rusaouën et al. (Reference Rusaouën, Liot, Castaing, Salort and Chillà2018) and Tummers & Steunebrink (Reference Tummers and Steunebrink2019) observed that roughness achieves the change on the heat-transport scaling exponent when the roughness height crosses over the thickness of thermal or viscous BLs. MacDonald et al. (Reference MacDonald, Hutchins, Lohse and Chung2019) and Zhu et al. (Reference Zhu, Stevens, Verzicco and Lohse2017, Reference Zhu, Stevens, Shishkina, Verzicco and Lohse2019) further pointed out that the  $1/2$ scaling exponent achieved by roughness cannot be explained as the achievement of the ultimate regime, as the classical
 $1/3$ scaling can be recovered with the further increasing Rayleigh number (
 $Ra$). On the other hand, Zhang et al. (Reference Zhang, Sun, Bao and Zhou2018) revealed that roughness can also reduce the heat flux in some cases where the hot/cold fluids are trapped within the cavities. More recently, Yang et al. (Reference Yang, Zhang, Jin, Dong, Wang and Zhou2021) extended the observation to a much wider range of Prandtl numbers (
 $Pr$). Furthermore, Abtahi & Floryan (Reference Abtahi and Floryan2017) and Hossain & Floryan (Reference Hossain and Floryan2020) showed that roughness can achieve the thermal drift and the pressure loss in RB convection.
The addition of shear induced by the mean flow (wind) in RB convection is expected to effectively affect the large-scale coherent structures, and thus causes significant changes on heat transport. Early experiments conducted by Solomon & Gollub (Reference Solomon and Gollub1990) showed the appearance of large-scale structures in sheared thermal convection, which is also numerically identified by Pirozzoli et al. (Reference Pirozzoli, Bernardini, Verzicco and Orlandi2017). By introducing the Couette-type shear into RB convection, Domaradzki & Metcalfe (Reference Domaradzki and Metcalfe1988) found that the heat transport is initially enhanced for low  $Ra$, but is suppressed for
 $Ra \gtrsim 1.5\times 10^5$ because the imposed shear breaks up the large-scale structures. Scagliarini, Gylfason & Toschi (Reference Scagliarini, Gylfason and Toschi2014) further carried out a numerical study of RB convection with the addition of the Poiseuille-type shear over
 $8.125 \times 10^5 \le Ra \le 1.3 \times 10^7$ . It is also shown that the heat flux is initially reduced – since the structures of thermal plumes are swept away by the external shear – but then is enhanced when the shear dominates the convective flow and large-scale meandering streaks are formed. This finding was also observed in recent studies of wall-sheared RB convection by Blass et al. (Reference Blass, Zhu, Verzicco, Lohse and Stevens2020). Moreover, they proposed the Monin–Obukhov length to distinguish three different flow regimes in wall-sheared thermal convection, namely, buoyancy-dominant, transitional and shear-dominant regimes. A similar result was also found in the case of sheared stably stratified turbulence (Zonta & Soldati Reference Zonta and Soldati2018). The effects of
 $Pr$ on wall-sheared RB convection (Blass et al. Reference Blass, Tabak, Verzicco, Stevens and Lohse2021) and on sheared stably stratified flow (Langham, Eaves & Kerswell Reference Langham, Eaves and Kerswell2020) were further studied. Moreover, Scagliarini et al. (Reference Scagliarini, Einarsson, Gylfason and Toschi2015) studied the BL characteristics of sheared RB turbulence. Vishnu & Sameen (Reference Vishnu and Sameen2020) investigated the influence of rotation-induced shear on the heat-transport scaling.
Although the pure influence of wall roughness or external shear has been studied extensively before, the combined effects of both are rarely explored. Hence, in this paper, we want to fill this gap and consider turbulent RB convection with both wall roughness and wall shear effects, focusing mainly on the flow structures and heat transport.
The remainder of this paper is organized as follows. Section 2 gives a brief description of the physical model and numerical method. The results of the shear-induced modulation on flow structures and heat transport are presented in § 3.1. In § 3.2, we give an explanation on shear-induced heat-transport enhancement in the buoyancy-dominant regime. In § 3.3, the influence of aspect ratio is discussed. In § 3.4, the influence of roughness height is studied. In § 3.5, a physical model is proposed to understand the transitional scaling based on the crossover of the total kinetic energy production between the buoyancy-dominant and shear-dominant regimes. Finally, a conclusion is presented in § 4.
2. Direct numerical simulation
We carry out direct numerical simulations (DNS) of wall-sheared RB convection over sinusoidally rough conducting plates in a two-dimensional rectangular cell, as shown in figure 1. The dimensionless governing equations for a sheared RB system are
 $$\begin{gather} \boldsymbol{\nabla} \boldsymbol{\cdot} \boldsymbol{u} = 0 , \end{gather}$$
 $$\begin{gather}{\partial_t \boldsymbol{u}} + (\boldsymbol{u} \boldsymbol{\cdot} \boldsymbol{\nabla} ) \boldsymbol{u} ={-} \boldsymbol{\nabla} p + (Ra/Pr)^{{-}1/2}\,\nabla^2 \boldsymbol{u} + \theta \boldsymbol{e}_z , \end{gather}$$
 $$\begin{gather}{\partial_t \theta} + (\boldsymbol{u} \boldsymbol{\cdot} \boldsymbol{\nabla} ) \theta = (Ra\,Pr)^{{-}1/2}\, \nabla^2 \theta , \end{gather}$$
where  $t$ denotes the time non-dimensionalized by the free-fall time
 $\sqrt {H/(\alpha g \varDelta )}, \boldsymbol u$ the velocity field normalized by the free-fall velocity
 $\sqrt {\alpha g \varDelta H}$,
 $\theta$ the temperature scaled by the temperature difference
 $\varDelta$ across the fluid layer,
 $p$ the dimensionless kinematic pressure field, and
 $\boldsymbol {e}_z$ the unit vector along the vertical direction, respectively. The external shear is introduced by moving the top and bottom plates in opposite directions with a dimensionless velocity
 $u_w$ as depicted in figure 1. For the sheared RB convection with roughness, there are six control parameters: the Rayleigh number
 $Ra = \alpha g \varDelta H^3/(\nu \kappa )$, the Prandtl number
 $Pr = \nu /\kappa$, the aspect ratio
 $\varGamma = L/H$, the dimensionless roughness height
 $h$, the dimensionless roughness wavelength
 $\lambda$, and the shear Reynolds number
 $Re_w = \sqrt {Ra /Pr}\,u_w$, where
 $g$ is the gravitation magnitude,
 $\alpha$,
 $\nu$ and
 $\kappa$ are respectively the volumetric coefficient of thermal expansion, the kinematic viscosity and the thermal diffusivity of the working fluid, and
 $H$ and
 $L$ denote respectively the dimensional height and width of the RB cell.
Sketch of wall-sheared Rayleigh–Bénard convection over rough surfaces with the coordinate system. Sinusoidal roughness elements of the dimensionless height  $h$ and wavelength
 $\lambda$ are located on both plates, which move in opposite directions with horizontal velocities
 $\pm {u_w}$.

In all simulations, we fix the Prandtl number  $Pr = 1$. As all length scales are normalized by
 $H$, we take the dimensionless roughness wavelength
 $\lambda = 0.2$ for all runs. Note that the cell height
 $H$ is defined between both mean surfaces of rough plates as depicted in figure 1, which guarantees that the rough cell has the same fluid volume as the smooth cases (Zhu et al. Reference Zhu, Stevens, Verzicco and Lohse2017). The Rayleigh number
 $Ra$ varies from
 $10^6$ to
 $10^8$, the shear Reynolds number
 $Re_w$ from
 $0$ to
 $5000$, the aspect ratio from
 $\varGamma =2$ to
 $\varGamma =4{\rm \pi}$, and the dimensionless roughness height from
 $h=0$ to
 $h = 0.2$. All simulations are performed using a fourth-order finite-difference code (Zhang et al. Reference Zhang, Sun, Bao and Zhou2018, Reference Zhang, Xia, Dong, Wang and Zhou2019) with staggered grids. No-slip boundary conditions are applied for the velocity fields, constant temperatures
 $\theta _{bot} =0.5$ and
 $\theta _{top} =-0.5$ for the bottom and top plates, respectively, and periodic boundary conditions are adopted in the horizontal direction. An immersed boundary method is used to track the moving rough walls (Fadlun et al. Reference Fadlun, Verzicco, Orlandi and Mohd-Yusof2000). The grid resolution depends on both
 $Ra$ and
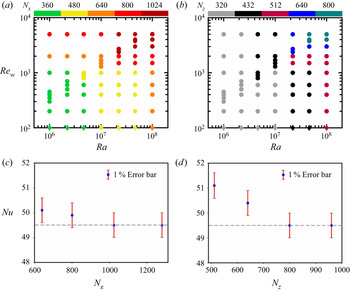
 $Re_w$, and non-equidistant meshes are implemented in the vertical direction, which are refined close to both solid surfaces to fully resolve the rough boundaries. Figures 2(a) and 2(b) show the horizontal and vertical resolutions that we used in numerical simulations of
 $\varGamma = 2$ and
 $h = 0.1$, respectively. Figures 2(c and 2d) give an example for
 $Ra = 10^8$,
 $Re_w = 5000$,
 $\varGamma = 2$ and
 $h= 0.1$ to show that our simulations are fully resolved for the chosen resolutions. The details for numerical parameters and results for all runs are given in Appendix A.
Horizontal grid number  $N_x$ (a) and vertical grid number
 $N_z$ (b) of the first part of numerical simulations at
 $\varGamma = 2$ and
 $h=0.1$ (rhombus points for the cases at
 $Re_w =0$). Values of the Nusselt number
 $Nu$ for simulations at
 $Ra=1.0 \times 10^8$ and
 $Re_w=5000$ performed using different
 $N_x$ at fixed
 $N_z=800$ (c) and different
 $N_z$ at fixed
 $N_x=1024$ (d). The dashed lines indicate the chosen value.

3. Results and discussion
3.1. Shear-induced modulation
We first quantitatively study the modulated effects of wall shear on heat-transport efficiency in RB convection over rough surfaces at  $\varGamma = 2$ and
 $h = 0.1$. The dimensionless global heat flux is measured by the Nusselt number
 $Nu = \sqrt {Ra\,Pr} \langle w \theta \rangle _{t,s} - \langle {\partial _z \theta }\rangle _{t,s}$, where
 $w$ is the vertical component of velocity and
 $\langle \cdot \rangle _{t,s}$ indicates an average over time and the mid-height horizontal section. All statistics in the present study are calculated over more than
 $600$ free-fall time units after the convective flow has reached the statistically steady state.
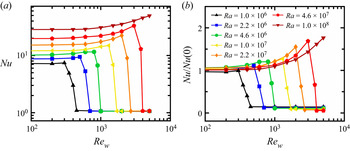
Figure 3(a) depicts the measured  $Nu$ depending on the modulation shear Reynolds number
 $Re_w$. It is shown that the
 $Re_w$-dependence of
 $Nu$ exhibits some kind of similar trends for different
 $Ra$, i.e. there exists a critical shear Reynolds number
 $Re_{w,cr}$ depending on
 $Ra$. A significant heat-transport enhancement regime induced by wall shear is observed below
 $Re_{w,cr}$. On the other hand, above
 $Re_{w,cr}$, a purely diffusion regime is reached and
 $Nu$ takes the minimum value. Between these two regimes,
 $Nu$ decreases sharply and an abrupt transition occurs. To show the enhancement effects, we plot in figure 3(b) the measured
 $Nu$ normalized by the corresponding value of
 $Nu(0)$ at
 $Re_w = 0$. It is seen that
 $Nu/Nu(0)$ increases initially with increasing
 $Ra$ with a maximal enhancement of
 ${\sim}76\,\%$ at
 $Ra=1.0 \times 10^8$. Such a high
 $Nu$-enhancement is really non-trivial, implying that the shear-induced modulation on turbulent RB convection over rough plates exhibits some features that are different from the smooth cases (Scagliarini et al. Reference Scagliarini, Gylfason and Toschi2014; Blass et al. Reference Blass, Zhu, Verzicco, Lohse and Stevens2020), in which
 $Nu$ initially decreases with
 $Re_w$. Note that Wagner & Shishkina (Reference Wagner and Shishkina2015) found an upper bound of heat-transfer enhancement purely by regular surface roughness, i.e.
 $Nu/Nu_s(0) \leq A_w/A_s$, where
 $Nu_s(0)$ is the Nusselt number of smooth cases without shear,
 $A_w$ is the wetted covering surface area over roughness, and
 $A_s$ is the covering area over smooth surface. However, it is found in our study that the maximal enhancement rate
 $Nu/Nu_s(0) \approx 1.94$ at
 $Ra = 10^8$ and
 $Re_w = 5000$ exceeds the upper bound
 $A_w/A_s \approx 1.46$ under the effect of external shear.
Shear-induced modulation on the heat transport in RB convection over rough plates at  $\varGamma = 2$ and
 $h = 0.1$. The measured
 $Nu$ (a) and
 $Nu/Nu(0)$ (b) are functions of
 $Re_w$ at different
 $Ra$. Here,
 $Nu(0)$ is the value of
 $Nu$ measured at
 $Re_w = 0$.

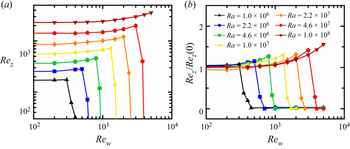
We next examine the shear-induced modulation on the strength of the large-scale flow, which is characterized by the Reynolds number  $Re_z = \sqrt {Ra /Pr}\,W$. Here,
 $W = \sqrt {\langle w^2 \rangle _{t,v}}$ is the root-mean-square (r.m.s.) vertical velocity, and
 $\langle {\cdot } \rangle _{t,v}$ denotes an average over time and the whole volume. Figure 4 shows the calculated
 $Re_z$ as a function of
 $Re_w$ at various
 $Ra$, and a sharp transition is also observed around
 $Re_{w,cr}$. When comparing figures 3 and 4, it is clearly seen that the strongest (weakest) strength of the LSC corresponds to the maximal (minimal) heat transport, suggesting that the imposed wall shear may modulate the convective heat transport via changing the flow structures in rough cells.
Shear-induced modulation on the magnitude of the LSC in the vertical direction at  $\varGamma = 2$ and
 $h = 0.1$. The measured
 $Re_z$ (a) and
 $Re_z/Re_z(0)$ (b) are functions of
 $Re_w$ at different
 $Ra$. Here,
 $Re_z(0)$ is the value of
 $Re_z$ measured at
 $Re_w = 0$.

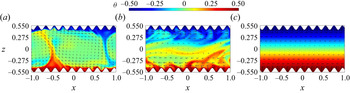
To gain more insight into this modulation, we analyse how flow structures are changed under the imposition of wall shear. Figure 5 shows the instantaneous temperature fields overlaid by the velocity fields at  $Ra = 1.0 \times 10^7$ for three different
 $Re_w$. When the wall shear effect is small (see figure 5a), the dominant flow consists of two large-scale rolls (LSRs) that are similar to those in standard RB convection. We note that the sizes of the two rolls are not equal; the one (clockwise) whose velocity near the plates is in the same direction as the corresponding moving plate expands horizontally, and the other one (anticlockwise) shrinks. With increasing
 $Re_w$, the expanded clockwise large-scale roll gets wider. At
 $Re_{w,cr}$ in the transitional regime, the width of the clockwise roll exceeds the cell's length and thus the larger roll covers the whole fluid volume as shown in figure 5(b). With a further increase in
 $Re_w$, the flow is then dominated by wall shear and laminar Couette flow for the velocity field, and heat conduction for the temperature field can be identified as depicted in figure 5(c). This suggests that the modulation effect is determined by the competition between the wall shear and the buoyancy.
Typical snapshots of the instantaneous temperature (colour) and velocity (arrows) fields at  $Ra = 1.0 \times 10^7$,
 $\varGamma = 2$ and
 $h=0.1$ for three different
 $Re_w$: (a)
 $Re_w=600$ in the buoyancy-dominant regime, (b)
 $Re_w=1500$ in the transitional regime and (c)
 $Re_w=1700$ in the shear-dominant regime. The corresponding movies are provided in the supplementary movies available at https://doi.org/10.1017/jfm.2021.1111.

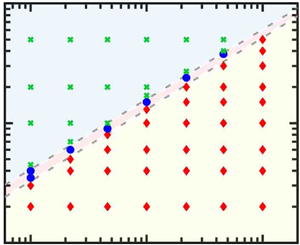
Figure 6(a) then shows the phase diagram of different regimes in the  $Re_w,Ra$ plane in cases
 $\varGamma = 2$ and
 $h = 0.1$: the buoyancy-dominant regime, the transitional regime and the shear-dominant regime. One can see that
 $Re_w$–
 $Ra$ for the transitional regime exhibits a linear relation in a log-log coordinate, indicating that there exists a transitional scaling relation between the critical shear Reynolds number
 $Re_{w,cr}$ and the Rayleigh number
 $Ra$. With the transitional scaling
 $Re_{w,cr} \sim Ra^{9/14}$ predicted by a physical model in § 3.5, we replot in figures 6(b) and 6(c) the normalized
 $Nu/Nu(0)$ of figure 3(b) and the normalized
 $Re_z/Re_z(0)$ of figure 4(b) vs the rescaled
 $Re_w Ra^{-9/14}$ for various
 $Ra$. Now all data points in the transitional regime roughly collapse on top of each other, indicating that the predicted scaling
 $Re_{w,cr} \sim Ra^{9/14}$ can well describe the transition behaviour.
(a) Explored phase diagram of different regimes in the  $Re_w,Ra$ plane for
 $\varGamma = 2$ and
 $h = 0.1$. The dashed lines (grey) are the eye-guided borders in between the three regimes: the buoyancy-dominant regime (regime I, coloured light yellow), the transitional regime (regime II, coloured light pink) and the shear-dominant regime (regime III, coloured light cyan). Here, red diamond points refer to the cases in regime I, blue solid dots refer to the cases in regime II, and green crosses refer to the cases in regime III. (b,c) Normalized
 $Nu/Nu(0)$ (b) and
 $Re_z/Re_z(0)$ (c) as functions of
 $Re_w Ra^{-9/14}$. The symbols in (b,c) are the same as those in figures 3 and 4.

3.2. Heat-transport enhancement in the buoyancy-dominant regime
As discussed above,  $Nu$-enhancement is observed in the buoyancy-dominant regime (see figure 6b). This finding is different from
 $Nu$ being initially suppressed by the shear-induced plume-sweeping effects in previous studies of Couette–RB (Blass et al. Reference Blass, Zhu, Verzicco, Lohse and Stevens2020, Reference Blass, Tabak, Verzicco, Stevens and Lohse2021) or Poiseuille–RB (Scagliarini et al. Reference Scagliarini, Gylfason and Toschi2014) convection over smooth plates. Then the question is how the heat-transfer efficiency is improved in rough cases.
We begin by looking at the instantaneous flow structures in the buoyancy-dominant regime at  $Ra = 1.0 \times 10^8$,
 $\varGamma = 2$ and
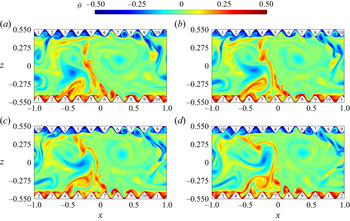
 $h=0.1$ as shown in figure 7. The moving rough plates serve as conveyor belts and provide the equivalent occurrence of the interaction between the LSC and the secondary flow in each cavity. This efficiently pumps the trapped hot (cold) fluids outside the cavities. These pumped hot (cold) fluids then enter the bulk, group and merge together, and strengthen the vertical motion of the LSC (see figure 4). Figure 7 shows an example of this process at four consecutive instants. At
 $t=1812.0$ (figure 7a), the LSC starts to interact with the secondary flow in the cavity between rough elements
 $6$ and
 $7$, and the trapped hot fluid is then sloshed to the bulk at
 $t = 1812.2$ (figure 7b), which transports the accumulated heat from the cavity into the bulk. As time goes on, the same interaction is repeated between the LSC and the secondary flow in the cavity between roughness
 $7$ and
 $8$ from
 $t = 1812.4$ (figure 7c) to
 $t = 1812.6$ (figure 7d).
Snapshots of the temperature fields in the buoyancy-dominant regime of sheared RB convection over moving rough plates at  $Ra = 1.0 \times 10^8$,
 $\varGamma = 2$,
 $h=0.1$ and
 $Re_w= 5000$. (a,b) The LSC interacts with the secondary flow inside the cavity between rough elements
 $6$ and
 $7$. The trapped hot fluid is sloshed out and transported to the bulk from
 $t=1812.0$ to
 $t=1812.2$. (c,d) The same process is repeated at the cavity between rough elements
 $7$ and
 $8$ from
 $t=1812.4$ to
 $t=1812.6$. The complete process is shown by the movie in the supplementary movies.

We notice that for the present parameter ranges the global heat transport is dominated mainly by thermal BLs, as the convective flow is still in the so-called ‘classical’ regime. This prompts us to investigate directly the spatial distribution of thermal BL thickness  $\delta _{th}(x)$. Figure 8 shows
 $\delta _{th}(x)$ near the bottom plates for various
 $Re_w$ in the buoyancy-dominant regime, where
 $\delta _{th}$ is evaluated by the ‘slope’ method (Zhou & Xia Reference Zhou and Xia2013), i.e. the vertical position at which the tangent line of the time-averaged temperature profiles perpendicular to roughness within the thermal BL coincides with the mean bulk temperature. It is clearly observed that with increasing
 $Re_w$, the modulation of wall shear increases the emissions of trapped hot fluids from the cavities, which significantly leads to a decrease on
 $\delta _{th}(x)$. The reduction of
 $\delta _{th}(x)$ as shown in figure 8 further suggests that the moving rough plates promote the interactions between the LSC and secondary flows within each cavity and thus stimulate the ejection of thermal plumes from thermal BLs and enhance heat transport.
Horizontal distribution of time-averaged thermal BL thickness  $\delta _{th}(x)$ near the bottom plate at
 $Ra = 1.0 \times 10^8$,
 $\varGamma =2$ and
 $h=0.1$ for various
 $Re_w$ in the buoyancy-dominant regime. Overall,
 $\delta _{th}$ decreases with growing
 $Re_w$.

To further examine this mechanism, we extract thermal plumes from the instantaneous fields and collect their heat content  $Q_p$, area
 $A_p$ and vorticity
 $\varOmega _p$ as shown in figure 9. The criteria for identifying plumes are given by
 $\lvert \theta - \langle \theta \rangle _{t,s} \rvert > \theta _{rms}$ and
 $\sqrt {Ra\,Pr}\,w \theta > Nu$ (Huang et al. Reference Huang, Kaczorowski, Ni and Xia2013; van der Poel et al. Reference van der Poel, Verzicco, Grossmann and Lohse2015; Wang, Zhou & Sun Reference Wang, Zhou and Sun2020), where
 $\theta _{rms}=\sqrt {\langle \theta ^2 \rangle _{t,s} -\langle \theta \rangle _{t,s}^2}$ is the r.m.s. temperature. We calculate the plume area as
 $A_p = \sum V_{grid}$, the heat content as
 $Q_p = \sum V_{grid} \theta$, and the vorticity contained in the plumes as
 $\varOmega _p = \sum V_{grid} (\partial _x w -\partial _z u)$, where
 $V_{grid}$ is the volume of each grid point. Only the hot plumes are used for calculating those statistics. As depicted in figure 9(a,b), both the area and heat content of hot plumes increase with
 $Re_w$ for large
 $Re_w$ at different
 $Ra$. For instance, at the highest
 $Re_w$ studied for
 $Ra = 10^8$, the heat content and area rise by
 $35.7\,\%$ and
 $14.6\,\%$, respectively. Moreover, figure 9(c) shows that the vorticity within plumes is enhanced by wall shear for different
 $Ra$, implying that the small eddies inside plumes produce a stronger mixing at high
 $Re_w$ in the buoyancy-dominant regime. Taken together, these results confirm quantitatively that with increasing
 $Re_w$, the wall shear strengthens the LSC and the vorticity within plumes, leading to an intense heat mixing; the moving plates increase the chances of interactions between the LSC and secondary flows within each cavity, which triggers more plume emissions and thins thermal BLs. This gives rise to a significant heat-transport enhancement in the buoyancy-dominant regime of sheared RB convection over rough plates.
Normalized heat content  $Q_p/Q_p(0)$ (a), area
 $A_p/A_p(0)$ (b) and vorticity
 $\varOmega _p/\varOmega _p(0)$ (c) of extracted thermal plumes as functions of
 $Re_w$ at
 $\varGamma = 2$ and
 $h=0.1$ for different
 $Ra$.

3.3. The influence of aspect ratio
Next, we are interested in the shear-induced modulation on thermal convection with multiple-rolls structures and examine whether the transition from the buoyancy-dominant regime to the shear-dominant regime still occurs in cases of large aspect ratios.
Figure 10 shows the measured  $Nu$ as a function of
 $Re_w$ with various
 $Ra$ at large aspect ratios
 $\varGamma = 2 {\rm \pi}$ and
 $\varGamma = 4{\rm \pi}$. It is clearly seen for large aspect-ratio cases that the action of shear still achieves the sharp transition from the buoyancy-dominant regime to the shear-dominant regime, which leads to an abrupt reduction of
 $Nu$. This observation is consistent with the results of
 $\varGamma = 2$ as shown in figure 3. Taken together, it is demonstrated that the occurrence of the transition is due to the shear-induced modifications on convective flows rather than the limitation of cell length.
Shear-induced modification on the heat transport  $Nu$ in convection cells with different aspect ratios
 $\varGamma$. The measured
 $Nu$ are functions of
 $Re_w$ at
 $\varGamma = 2 {\rm \pi}$ (a),
 $\varGamma = 4 {\rm \pi}$ (b) and fixed
 $h=0.1$. Here, the cyan and pink lines represent the statistics of additional
 $Ra=3.0 \times 10^6$ and
 $Ra=3.0 \times 10^7$, and other lines keep the same
 $Ra$ values as those in figure 3.

Taking a closer look at figure 10, it is found that the trend of  $Nu$ in the buoyancy-dominant regime at larger
 $\varGamma$ becomes more flexural with growing
 $Re_w$, compared to that at
 $\varGamma = 2$. It is seen that
 $Nu$ is enhanced initially both at
 $\varGamma = 2 {\rm \pi}$ and
 $\varGamma = 4{\rm \pi}$ at high
 $Ra$, which is caused by combined effects of wall shear and roughness as discussed in § 3.2. This suggests that this mechanism of heat-transport enhancement still plays an important role in RB convection with multiple rolls. However, it is also seen that
 $Nu$ is slightly reduced at low
 $Ra$ for
 $\varGamma = 2 {\rm \pi}$ and
 $\varGamma = 4{\rm \pi}$. This is probably because at low
 $Ra$, thermal convection is not plume-dominant, the proposed heat transport enhancement mechanism does not work, and the convective flow is mainly laminar; shear-induced stratification of the velocity field reduces the vertical velocity, and consequently suppresses convective heat transport.
We then examine the shear-induced modification on flow structures in the buoyancy-dominant regime for large  $\varGamma$. Figure 11 shows the instantaneous flow structures at
 $h = 0.1$,
 $\varGamma = 2{\rm \pi}$ and
 $Ra = 1.0 \times 10^7$ with different shear Reynolds numbers
 $Re_w = 0, 1500, 2225$. It is found that under the action of external shear, the multiple rolls begin to be expanded for the clockwise direction and be shrunk for the anticlockwise direction (see figure 11b), then the adjacent rolls merge until the flow structures with a clockwise roll of large size and an anticlockwise roll of small size (see figure 11c). This indicates that for cases of large
 $\varGamma$, the external shear initially reduces the number of LSRs until attaining two-roll structures as
 $\varGamma =2$ in the buoyancy-dominant regime, then enters the shear-dominant regime through an abrupt transition.
Typical snapshots of the instantaneous temperature (colour) and velocity (arrows) fields for three different  $Re_w$ in the buoyancy-dominant regime at
 $h=0.1$,
 $\varGamma =2 {\rm \pi}$ and
 $Ra = 1.0 \times 10^7$: (a)
 $Re_w=0$, (b)
 $Re_w=1500$ and (c)
 $Re_w=2225$.

Further, we examine the influence of the aspect ratio on the transitional scaling. Figure 12 shows the compensative phase diagram of flow regimes with various aspect ratios  $\varGamma = 2, 2{\rm \pi}, 4{\rm \pi}$, where
 $Re_w$ is rescaled by the proposed transitional scaling
 $Re_{w,cr} \sim Ra^{9/14}$ in § 3.5. It is found that the fitted transitional scalings at different
 $\varGamma$ values are basically consistent with the scaling predicted by our proposed model in § 3.5, although the effect of the aspect ratio leads to a small discrepancy between the scaling exponents.
Compensative phase diagrams of flow regimes with different cell aspect ratios  $\varGamma$. Panels (a), (b) and (c) are respectively the plots of convections at
 $\varGamma = 2$,
 $\varGamma = 2 {\rm \pi}$ and
 $\varGamma = 4 {\rm \pi}$, and fixed
 $h=0.1$. Here, the symbols in all plots are the same as those in figure 6(a). The dashed line is drawn as a guide for the eye.

3.4. The influence of roughness height
In this subsection, we study wall-sheared RB convection with various roughness heights and figure out the influence of roughness on shear-induced modulation on heat transfer.
Figure 13 shows the measured  $Nu$ as a function of
 $Re_w$ for different
 $Ra$ with various roughness heights
 $h=0$,
 $h=0.05$ and
 $h=0.2$ at fixed
 $\varGamma = 2$. For the smooth case (
 $h=0$), it is seen that
 $Nu$ is nearly unchanged in the buoyancy-dominated regime, then slowly transits to the minimum value in the shear-dominant regime. This result shows that shear-induced modification on heat transfer for two-dimensional cases is different from that for three-dimensional cases as studied by (Blass et al. Reference Blass, Zhu, Verzicco, Lohse and Stevens2020, Reference Blass, Tabak, Verzicco, Stevens and Lohse2021) in thermal convection over smooth surfaces, due to the lack of fluid motion in the third direction. When the roughness is applied, the mechanism of heat transfer enhancement due to the combined effects of roughness and shear begins to work,
 $Nu$ tends to be enhanced, and with increasing
 $h$, the maximal
 $Nu$-enhancement rate becomes larger.
Shear-induced modification on the heat transport  $Nu$ in convection cells with different roughness heights
 $h$. The measured
 $Nu$ are functions of
 $Re_w$ at
 $h=0$ (a),
 $h=0.05$ (b),
 $h=0.2$ (c), and fixed
 $\varGamma = 2$.

Next, we examine the roughness effect on the transitional scaling. Figure 14 depicts the phase diagrams of flow regimes of the wall-sheared RB convection at various roughness heights  $h=0, 0.05, 0.2$, where
 $Re_w$ is rescaled by the proposed transitional scaling
 $Re_{w,cr} \sim Ra^{9/14}$ in § 3.5. It is observed that the transitional region narrows with increasing
 $h$ but its location shows a weak dependency on
 $h$. It seems that the transitional scalings with different
 $h$ are quite close to the predicted scaling in § 3.5, implying that the roughness height has only a slight influence on shear-induced modulation mechanism.
Compensative phase diagrams of flow regimes with different roughness heights  $h$. Panels (a), (b) and (c) are respectively the plots of convections with
 $h = 0$,
 $h = 0.05$,
 $h = 0.2$, and fixed
 $\varGamma = 2$. Here, the symbols in all plots are the same as those in figure 6(a). The dashed line is drawn as a guide for the eye.

3.5. Physical understanding of the transitional scaling
As it is concluded in § 3.4 that the roughness height has only few influences on the transitional scaling, we take the smooth cases in the following for simplification. To better understand shear-induced modulation, we take advantage of the dynamic equation of global kinetic energy  $E(t)=\frac {1}{2}\langle \lvert \boldsymbol u \rvert ^2 \rangle _v$ to obtain
 \begin{equation} \frac{{\rm d} E(t)}{{\rm d} t} = P_{buo}(t) + P_{shear}(t) - \epsilon(t), \end{equation}
where  $P_{buo} = \langle w \theta \rangle _v$ denotes the buoyancy-induced production,
 $P_{shear} = \frac {1}{2} \langle \nabla ^2 \lvert \boldsymbol u \rvert ^2 \rangle _v/\sqrt {Ra/Pr}$ means the wall-shear-induced production,
 $\epsilon = \langle \lvert \boldsymbol {\nabla } {\boldsymbol u} \rvert ^2 \rangle _v /\sqrt {Ra/Pr}$ is the dissipation rate, and
 $\lvert {\cdot } \rvert$ denotes the vector or tensor norm. In (3.1), the competition mechanism can be quantified by the productions for the kinetic energy by the shear and the buoyancy. Depending on the relative importance of the time-averaged
 $\bar {P}_{buo} = \langle w \theta \rangle _{t,v}$ and
 $\bar {P}_{shear} = \frac {1}{2} \langle \nabla ^2 \lvert \boldsymbol u \rvert ^2 \rangle _{t,v}/\sqrt {Ra/Pr}$ in the total production
 $\bar {P}=\bar {P}_{buo}+\bar {P}_{shear}$ for the global kinetic energy, we can obtain the three regimes presented in figures 6, 12 and 14.
Cases at Γ = 2 and h = 0.

Cases at  $\varGamma =2$ and
 $h=0.05$.

Cases at Γ = 2 and h = 0.1.

Cases at  $\varGamma =2$ and
 $h=0.2$.

Regime I: the buoyancy-induced production  $\bar {P}_{buo}$ is dominant, and flow structures resemble large-scale rolls as those found in standard RB convection. This is the buoyancy-dominant regime, in which a heat-transport enhancement is observed and the
 $Nu$-enhancement rate becomes larger with ascending
 $Ra$.
Regime II: there is a balance between the buoyancy-induced production  $\bar {P}_{buo}$ and the shear-induced production
 $\bar {P}_{shear}$. Sharp transitions exist in figures 6, 10 and 13. In this regime, the LSC nearly disappears, the velocity field of flow tends to be stably stratified, and the temperature field tends to be in a pure diffusion state. Here,
 $Nu$ decreases dramatically from maximum to minimum.
Regime III: the shear-induced production  $\bar {P}_{shear}$ is dominant, and the wall shear effect is strong enough to dominate the flow. This is the shear-dominant regime, in which the flow is nearly laminar Couette flow and the global heat transport is determined mainly by thermal conduction.
According to the physical picture of different regimes, we can make the approximation of the total production  $\bar {P}$, namely,
 $\bar {P} \sim \bar {P}_{buo}$ in the buoyancy-dominant regime and
 $\bar {P} \sim \bar {P}_{shear}$ in the shear-dominant regime. First, as the heat flux is the same in any horizontal cross section for smooth cases, the Nusselt number can also be written as the volume- and time-averaged heat flux, i.e.
 $Nu=\sqrt {Ra\,Pr}\,\langle w \theta \rangle _{t,v} + 1$. Then we obtain
 $\bar {P}_{buo} = (Nu -1)/\sqrt {Ra\,Pr}$. Hence the total production
 $\bar {P}$ in the buoyancy-dominant regime can be estimated by
 $\bar {P} \sim Nu/\sqrt {Ra\,Pr}$ as
 $\bar {P} \sim \bar {P}_{buo}$. Second, using the divergence theorem,
 $\bar {P}_{shear}$ can be rewritten as
 $\bar {P}_{shear} = \frac {1}{2} \langle \partial _z \lvert \boldsymbol u \rvert ^2 \rangle _{t,top}/\sqrt {Ra/Pr} - \frac {1}{2} \langle \partial _z \lvert \boldsymbol u \rvert ^2 \rangle _{t,bot}/\sqrt {Ra/Pr}$, where
 $\langle {\cdot } \rangle _{top}$ (or
 $\langle {\cdot } \rangle _{bot}$) represents the average over the top plate (or the bottom plate). As
 $\partial _z \lvert \boldsymbol u \rvert ^2 = 2 u \partial _z u + 2 w \partial _z w$,
 $u=u_w$ on the top plate,
 $u=-u_w$ on the bottom plate, and
 $w=0$ on both plates, we obtain
 $\bar {P}_{shear} =2 u_w \partial _z U / \sqrt {Ra/ Pr}$, where
 $\partial _z U = \langle \partial _z u \rangle _{t,bot}$ (or
 $\langle \partial _z u \rangle _{t,top}$) means the partial derivative of horizontal (
 $x$-) velocity in the vertical (
 $z$-) direction on the plates. Assuming
 $\partial _z U \sim (u_w -(-u_w))/1$ from the dimensional analysis, namely
 $\partial _z U \sim 2u_w$, the total production in the shear-dominant regime is approximated by
 $\bar {P} \sim 4 u_w^2 / \sqrt {Ra/Pr} \sim Re_w^2 (Ra/Pr)^{-3/2}$ as
 $\bar {P} \sim \bar {P}_{shear}$. Finally, the change of
 $\bar {P}$ with respect to
 $Re_w$ is continuous. To determine the transitional scaling, we connect the total production
 $\bar {P} \sim Nu/\sqrt {Ra\,Pr}$ in the buoyancy-dominant regime and
 $\bar {P} \sim Re_w^2 (Ra/Pr)^{-3/2}$ in the shear-dominant regime, yielding the relation of the critical shear Reynolds number
 $Re_{w,cr}$ in the transitional regime, i.e.
 $Re_{w,cr} \sim Nu^{1/2} Ra^{1/2} Pr^{-1}$. Together with
 $Nu \sim Ra^{2/7}$ for two-dimensional thermal convection with periodic boundary conditions (Ahlers et al. Reference Ahlers, Grossmann and Lohse2009), we obtain the transitional scaling
 \begin{equation} Re_{w,cr} \sim Ra^{9/14}. \end{equation}
From all our numerical results shown in figures 6, 12 and 14, it is seen that our predicted scaling  $Re_{w,cr} \sim Ra^{9/14}$ is able to characterize the transitional behaviour in two-dimensional sheared thermal convection.
4. Conclusion
In summary, we have carried out a series of DNS of wall-sheared RB convection over rough plates over  $1.0 \times 10^6 \le Ra \le 1.0 \times 10^8$,
 $0 \le Re_w \le 5000$,
 $2 \le \varGamma \le 4 {\rm \pi}$ and
 $0 \le h \le 0.2$. With the critical shear Reynolds number
 $Re_{w,cr}$, three flow states can be categorized: the buoyancy-dominant, transitional and shear-dominant regimes. In the buoyancy-dominant regime, flow structures resemble large-scale stretched convective rolls as those in standard RB convection, and the number of LSRs decreases with increasing
 $Re_w$ for large
 $\varGamma$. When
 $Re_w$ is around the critical value, a sharp transition takes place abruptly and the corresponding
 $Nu$ decrease dramatically. In the shear-dominant regime, the flow is laminar Couette flow for the velocity field and pure conduction for temperature.
Cases at  $\varGamma =2 {\rm \pi}$ and
 $h=0.1$.

Cases at  $\varGamma =4 {\rm \pi}$ and
 $h=0.1$.

Making use of the kinetic energy transport equation, the critical shear Reynolds number  $Re_{w,cr}$ can be estimated by the crossover between the total production in the buoyancy-dominant and shear-dominant regimes, i.e.
 $Re_{w,cr} \sim Ra^{9/14}$, which can well characterize the observed transition behaviour. It is found that both the aspect ratio and roughness height have only a slight influence on the transitional scaling. The region of the transitional regime shrinks with a larger roughness height
 $h$.
In the buoyancy-dominant regime, the physical reason for the heat-transport enhancement is that the moving rough plates serve as conveyor belts and increase the chances of interactions between the LSC and secondary flows within each cavity between rough elements. This efficiently pumps the trapped hot (cold) fluids out of the cavities, thins thermal BLs, strengthens the LSC, and consequently enhances the global heat-transfer efficiency of the system.
Supplementary movies
Supplementary movies are available at https://doi.org/10.1017/jfm.2021.1111.
Funding
This work was supported by the Natural Science Foundation of China under grant nos 11988102, 11825204, 92052201, 12032016, 11732010, 12102246 and 91852202, the Program of Shanghai Academic Research Leader under grant no. 19XD1421400, the Science and Technology Innovation Plan of Shanghai Science and Technology Commission (STCSM) under project nos. 19JC1412802, the Shanghai Pujiang Program under grant no. 21PJ1404400, and the China Postdoctoral Science Foundation under grant no. 2020M681259.
Declaration of interests
The authors report no conflict of interest.
Appendix A. Numerical details
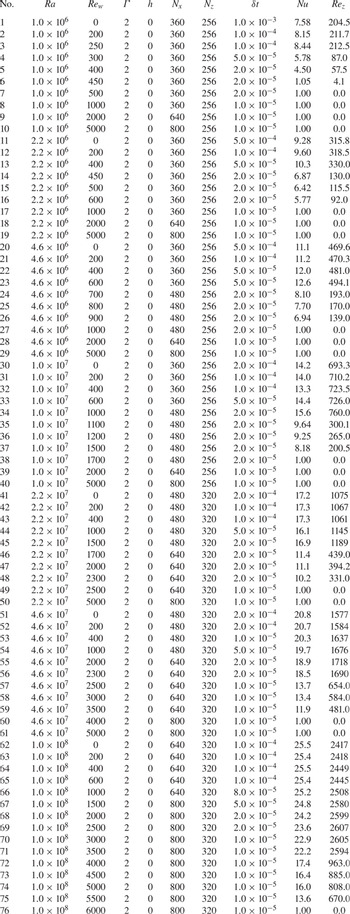
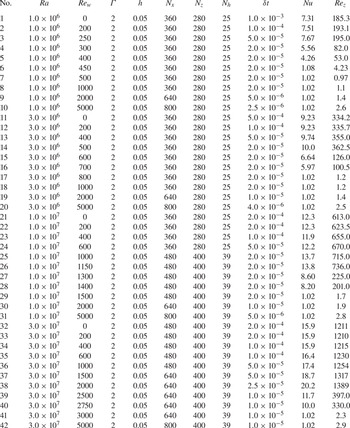
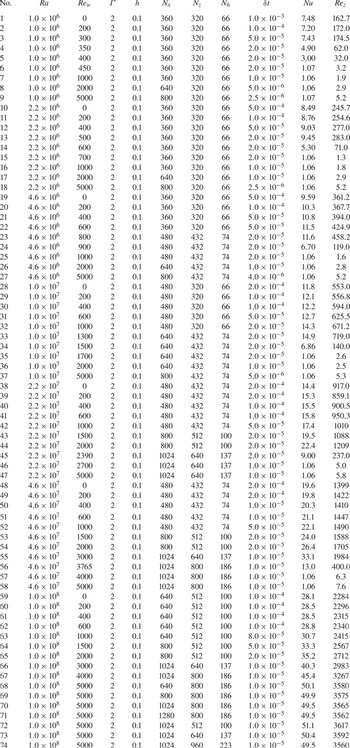
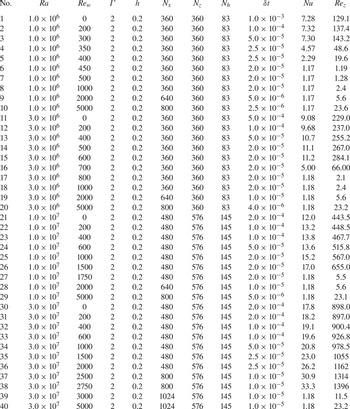
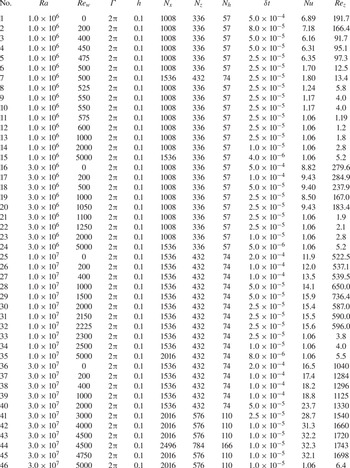
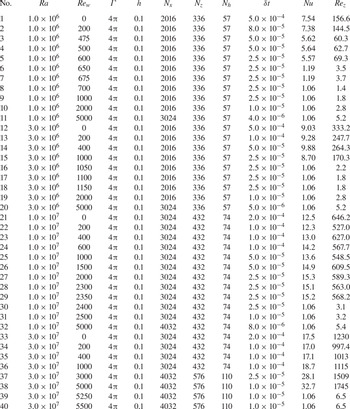
Here, we provide values of the control parameters and the numerical results of the simulations in our research, which are divided into six tables 1, 2, 3, 4, 5, 6 by the aspect ratio  $\varGamma$ and dimensionless roughness height
 $h$.
 $N_x$ and
 $N_z$ are respectively the grid resolution in the horizontal and vertical directions.
 $\delta t$ is the dimensionless time step of each case. The Prandtl number
 $Pr$ and dimensionless roughness wavelength
 $\lambda$ are respectively fixed to
 $1$ and
 $0.2$ in all simulations.