





1. Introduction
The largest driver of computational cost in numerical simulations of wall-bounded turbulence is typically the numerical resolution in the near-wall region. In scale-resolving simulations, e.g. wall-resolved (WR) large-eddy simulations (LES), high spatial and temporal resolutions are required to simulate accurately the small-scale eddies near walls. Wall models, or approximate boundary conditions, can be employed to reduce the near-wall resolution requirements. The computational cost (the number of grid points multiplied by the number of time steps) for the simulation of a turbulent boundary layer scales with the Reynolds number as  $Re^{2.7}$ for WRLES and
 $Re^{1.1}$ for wall-modelled (WM) LES (Yang & Griffin Reference Yang and Griffin2021). Thus wall models lead to substantial cost savings for high-Reynolds-number applications. In simulations of the Reynolds-averaged Navier–Stokes (RANS) equations, high spatial resolution is also required to resolve the steep near-wall gradients in the mean flow. Therefore, wall models – typically referred to as wall functions in the RANS context – can also greatly accelerate numerical simulations.
The present work focuses on the paradigm of wall-stress modelling (Larsson et al. Reference Larsson, Kawai, Bodart and Bermejo-Moreno2016; Bose & Park Reference Bose and Park2018) for LES. These models were derived from RANS analysis of boundary layers, and typically invoke a zero-equation RANS model such as the Prandtl mixing length argument (Prandtl Reference Prandtl1925), which models the turbulence length scale as a linear function of the wall-normal distance. An empirical damping function is introduced following Van Driest (Reference Van Driest1956) to ensure the correct near-wall scaling of the mixing length. RANS models have naturally been used widely as boundary conditions for under-resolved RANS simulations (e.g. Abrahamson & Brower Reference Abrahamson and Brower1988; Lien, Kalitzin & Durbin Reference Lien, Kalitzin and Durbin1998; Goncalves & Houdeville Reference Goncalves and Houdeville2001; Parente et al. Reference Parente, Gorlé, van Beeck and Benocci2011). In this context, such a model is typically referred to as a wall function. Cabot (Reference Cabot1995) and Cabot & Moin (Reference Cabot and Moin2000) showed that the mixing length RANS model is suitable for use as a boundary condition for the LES equations, i.e. for deployment as a wall-stress model. Specifically, they invoke the one-dimensional simplification of the RANS streamwise momentum equation. That is,
 \begin{equation} \frac{\mathrm{d}}{\mathrm{d}y}\left((\bar{\mu} + \bar{\mu}_t)\, \frac{\mathrm{d}\tilde{U}}{\mathrm{d}y} \right) = 0, \end{equation}
where  $\bar {\mu }$,
 $\bar {\mu }_t$ and
 $\tilde {U}$ are the molecular dynamic viscosity, eddy viscosity and velocity profiles, respectively, and
 $y$ is the wall-normal coordinate. Here,
 $\overline {({\cdot })}$ denotes the Reynolds average, and
 $\widetilde {({\cdot })}$ denotes the Favre (density-weighted) average. Throughout this work the Favre (density-weighted) averaged RANS and LES equations are employed. The eddy viscosity is further modelled as
 \begin{equation} \bar{\mu}_t = \kappa y \bar{\rho}\, \sqrt{\tau_w/\bar{\rho}} ( 1 - \exp (y^+{/}A^+) )^2, \end{equation}
where  $\bar {\rho }(y)$ is the density profile. The subscript
 $w$ denotes quantities evaluated at the wall, and
 $\tau _w = \bar {\mu }_w ({\rm d}\tilde {U}/{{\rm d} y})_w$ is the wall shear stress. The superscript
 $+$ denotes non-dimensionalization by the friction velocity
 $u_\tau = \sqrt {\tau _w/\bar {\rho }_w}$,
 $\bar {\rho }_w$ and the kinematic wall viscosity
 $\bar {\nu }_w=\bar {\mu }_w/\bar {\rho }_w$.
The von Kármán constant  $\kappa = 0.41$ and the eddy-viscosity damping coefficient
 $A^+ = 17$ are adopted following Cabot & Moin (Reference Cabot and Moin2000).
For an incompressible flow, the density and molecular dynamic viscosity are known constants. In the context of WMLES, the ordinary differential equation (ODE) in (1.1) is solved with two boundary conditions: (1) the no-slip wall condition, and (2) a velocity sample, which is taken from the LES at a wall-normal distance referred to as the matching location. Note that the solution procedure is iterative because the eddy viscosity depends on the wall stress (see (1.2)). The computed wall stress  $\tau _w$ is then applied as a momentum-flux boundary condition for the outer LES solver, which completes the two-way coupling of the wall model (inner) solution and the partial differential equation (PDE) (outer) simulation.
For compressible flow, the RANS equation for temperature can be simplified similarly to the one-dimensional form (Larsson et al. Reference Larsson, Kawai, Bodart and Bermejo-Moreno2016; Bose & Park Reference Bose and Park2018), which results in a second, coupled ODE for the temperature profile, i.e.
 \begin{equation}
\frac{\mathrm{d}}{\mathrm{d}y}\biggl((\bar{\mu} +
\bar{\mu}_t)
\tilde{U}\,\frac{\mathrm{d}\tilde{U}}{\mathrm{d}y} + C_p
\left(\frac{\bar{\mu}}{Pr}+\frac{\bar{\mu}_t}{Pr_t}\right)
\frac{\mathrm{d}\tilde{T}}{\mathrm{d}y}\biggr)= 0,
\end{equation}
where  $\tilde {T}$ is the temperature profile,
 $C_p$ is the specific heat capacity at constant pressure,
 $Pr$ is the Prandtl number, and
 $Pr_t$ is the turbulent Prandtl number, which is assumed to be 0.9 (Larsson et al. Reference Larsson, Kawai, Bodart and Bermejo-Moreno2016). The dependence of molecular dynamic viscosity on temperature can be assumed to follow a power law or Sutherland's law. The ideal gas equation of state closes the system, and the thin boundary-layer assumption implies that the pressure is constant across the inner layer.
In WMLES, the temperature ODE in (1.3) is solved with two additional boundary conditions: (1) the wall temperature, and (2) the temperature at the matching location. Note that the solution procedure is also iterative in that the temperature depends on the velocity solution. The velocity also depends on the temperature through the density and viscosity. Solving two coupled boundary-value problems iteratively introduces a higher degree of nonlinearity compared to the incompressible case, and can prove difficult to converge in flows with strong temperature gradients (strong heat transfer), e.g. as was reported in Fu et al. (Reference Fu, Karp, Bose, Moin and Urzay2021). In addition to the numerical difficulties, the accuracy of this wall model degrades substantially in flows with strong heat transfer (as will be demonstrated herein).
Improved results for high-speed wall-bounded turbulent flows over cold walls have been obtained by using the semi-local scaling in the damping function (Yang & Lv Reference Yang and Lv2018; Fu, Bose & Moin Reference Fu, Bose and Moin2022); however, Iyer & Malik (Reference Iyer and Malik2019) report that in adiabatic walls, the classical scaling (consistent with the van Driest transformation) is more accurate. This motivates using a recently developed compressible velocity transformation that is accurate for both diabatic and adiabatic turbulent boundary layers (Griffin, Fu & Moin Reference Griffin, Fu and Moin2021c).
In this work, a wall model for high-speed wall-bounded turbulent flows is developed in § 2. The model is evaluated via a priori testing in § 3, and via a posteriori validation in § 4. Conclusions are drawn in § 5.
2. Model development
There are two principal differences between the present model and the classical ODE-based wall model ((1.1)–(1.3)). (1) Rather than solving an ODE for the compressible velocity profile directly, the incompressible ODE (with constant density and viscosity) is solved, and an inverse compressibility transformation (Griffin et al. Reference Griffin, Fu and Moin2021c) is employed. (2) Rather than employing a RANS equation for temperature and assuming a constant  $Pr_t$, an algebraic temperature–velocity relation is adopted, thus obviating the need to solve a second ODE.
2.1. Inverse compressible velocity transformation
A compressible velocity transformation seeks to map the local mean strain rate of the variable-property compressible flow,  ${\rm d}\tilde {U}/{{\rm d} y}$, to the non-dimensional mean strain rate of a constant-property incompressible flow at an equivalent Reynolds number. Upon integration, the transformation maps the compressible velocity profile to an incompressible velocity profile. In this way, a successful transformation can collapse profiles with different Mach numbers and thermal boundary conditions to a single incompressible law of the wall. Coupled with the incompressible profile implied by (1.1), an inverse velocity transformation can recover the compressible velocity profile.
The total-stress-based compressible velocity transformation of Griffin et al. (Reference Griffin, Fu and Moin2021c) is used in this work since it is shown to be accurate in a wide range of flows, including boundary layers with strong heat transfer. This transformation uses the viscous scaling arguments of Trettel & Larsson (Reference Trettel and Larsson2016) and Patel, Boersma & Pecnik (Reference Patel, Boersma and Pecnik2016) in the near-wall viscous region, and uses a modified version of the turbulence equilibrium arguments of Zhang et al. (Reference Zhang, Bi, Hussain, Li and She2012) for the logarithmic region. The transformation is an algebraic function that relates the local mean strain rate of the compressible flow,  ${\rm d}\tilde {U}/{{\rm d} y}$, to the non-dimensional incompressible mean strain rate
 $S_t^+$ at the same semi-local friction Reynolds number
 $Re_\tau ^*$, according to the relation
 \begin{equation} S_t^+{=} \frac{S_{eq}^+}{1+S_{eq}^+{-}S_{TL}^+}, \end{equation}
where  $S_{eq}^+=(1/\bar {\mu }^+)\,{\rm d}\tilde {U}^+/{{\rm d} y}^*$ and
 $S_{TL}^+=\bar {\mu }^+\, {\rm d}\tilde {U}^+/{{\rm d} y}^+$. The superscript
 $*$ denotes non-dimensionalization by the local density
 $\rho (y)$, local molecular dynamic viscosity
 $\mu (y)$, and semi-local friction velocity
 $u_{sl}=\sqrt {\tau _w/\bar {\rho }(y)}$ (Coleman, Kim & Moser Reference Coleman, Kim and Moser1995; Huang, Coleman & Bradshaw Reference Huang, Coleman and Bradshaw1995). The semi-local friction Reynolds number is thus defined as
 $Re_\tau ^* = \bar {\rho }_e u_{sl} \delta / \bar {\mu }_e$, where the subscript
 $e$ denotes quantities evaluated at the boundary-layer edge. (Throughout this work,
 $\delta$ denotes the channel half-height or the boundary-layer thickness.) Note that all variables of the form
 $S_{({\cdot })}^+$ represent different local non-dimensionalizations of the compressible strain rate, which were designed in prior works with the target of equalling the strain rate implied by the incompressible law of the wall. For example, although
 $S_{TL}^+$ is equivalent to the viscous stress, it is also a non-dimensionalization of the mean strain rate in a compressible flow; it will recover exactly the incompressible strain rate of a flow with the equivalent viscous stress as long as the compressible flow also obeys
 $\mu ^+=1$. Additionally, note that the transformation in (2.1) assumes a constant stress layer in the buffer region of the boundary layer, where there is a transition between the underlying viscous and equilibrium transformations. Griffin et al. (Reference Griffin, Fu and Moin2021c) verifies that the deployment of this assumption does not significantly affect the accuracy of the transformation in equilibrium flows, and Bai, Griffin & Fu (Reference Bai, Griffin and Fu2022) verifies the same for boundary layers with moderate pressure gradients.
The inverse velocity transformation is obtained readily by rearranging the transformation algebraically to find
 \begin{equation} \frac{\mathrm{d}\tilde{U}^+}{\mathrm{d}y^*} = \left(\frac{1}{\bar{\mu}^+ S^+_{t}} - \frac{1}{\bar{\mu}^+} +\sqrt{\bar{\rho}^+} \left(1 + \frac{1}{2\bar{\rho}^+}\,\frac{\mathrm{d}\bar{\rho}^+}{\mathrm{d}y^+}\, y^+{-} \frac{1}{\bar{\mu}^+}\,\frac{\mathrm{d}\bar{\mu}^+}{\mathrm{d}y^+}\,y^+ \right) \right)^{{-}1}. \end{equation}
The incompressible mean strain rate  $S_t^+$ is available algebraically from the constant-property version of (1.1), i.e.
 $\bar {\rho }=\bar {\rho }_w$ and
 $\bar {\mu }=\bar {\mu }_w$. The incompressible model constants
 $\kappa$ and
 $B$ are determined using the aforementioned calibration, but
 $Re_\tau ^*$ is used in place of
 $Re_\tau$ since the former is invariant under the velocity transformation. Integrating (2.2) with variable properties yields the targeted compressible velocity profile; the properties are functions of temperature, which will be discussed next.
2.2. Algebraic temperature–velocity relation
In order to close the velocity equation (2.2), the temperature profile must be determined. The classical model uses the constant turbulent Prandtl number assumption to develop a coupled ODE for temperature (1.3). However, the constant Prandtl number assumption has been shown to be less accurate than invoking the generalized Reynolds analogy (GRA) (Zhang et al. Reference Zhang, Bi, Hussain and She2014). Thus the presently proposed wall model leverages the GRA instead.
The analogy between the conservation equations for momentum and energy has led to the derivation of several algebraic relations between temperature and velocity. Walz's equation (Walz Reference Walz1969) (also known as the modified Crocco–Busemann relation Busemann Reference Busemann1931; Crocco Reference Crocco1932) leverages the analogy between the conservation equations for momentum and energy to arrive at an algebraic relation between mean temperature and velocity. This relation accounts for non-unity  $Pr$ effects via a recovery factor, which is taken as
 $r=(Pr)^{1/3}$. While this relation is accurate in high-speed adiabatic boundary layers, Duan & Martín (Reference Duan and Martín2011) observed that the accuracy degrades significantly in boundary layers with wall heat transfer, and proposed a semi-empirical correction to the relation. Subsequently, this was recast in terms of a GRA (Zhang et al. Reference Zhang, Bi, Hussain and She2014), thereby introducing the Reynolds analogy factor
 $s$, which they chose as
 $s = 1.14$ following convention. The resulting temperature–velocity relation is given as
 \begin{equation} \tilde{T} = \tilde{T}_w + s\,Pr\, (\tilde{T}_r-\tilde{T}_w)\, \frac{\tilde{U}}{\tilde{U}_e} \left(1 - \frac{\tilde{U}}{\tilde{U}_e} \right) + \left( \frac{\tilde{U}}{\tilde{U}_e} \right)^2 ( \tilde{T}_e-\tilde{T}_w ), \end{equation}
with the recovery temperature  $\tilde {T}_r = \tilde {T}_e + r \tilde {U}_e^2/(2 C_p)$. This relation has been validated across a wide range of channel flows, pipe flows and boundary layers with and without heat transfer (Zhang et al. Reference Zhang, Bi, Hussain and She2014; Zhang, Duan & Choudhari Reference Zhang, Duan and Choudhari2018; Modesti & Pirozzoli Reference Modesti and Pirozzoli2019; Volpiani, Bernardini & Larsson Reference Volpiani, Bernardini and Larsson2020a; Fu et al. Reference Fu, Karp, Bose, Moin and Urzay2021). Specifically, this relation is derived by Zhang et al. (Reference Zhang, Bi, Hussain and She2014) through defining the generalized recovery temperature
 $\tilde {T}_{r_g} = \tilde {T} + r_g \tilde {U}^2/(2 C_p)$. Then it is assumed that
 $\tilde {T}_{r_g} = \tilde {T}_w + U_s \tilde {U}/C_p$, where
 $U_s$ is a constant velocity scale. Equivalently, the assumption can be reinterpreted that
 $\tilde {T}$ can be represented approximately as a second-order Taylor expansion in terms of powers of
 $\tilde {U}$, i.e.
 \begin{equation} \tilde{T} = b_0 + b_1 \tilde{U} + b_2 \tilde{U}^2/2, \end{equation}
where the no-slip condition implies  $b_0 = \tilde {T}_w$,
 $b_1 = (\mathrm {d}\tilde {T} / \mathrm {d}\tilde {U})|_w$. The algebraic relation of Zhang et al. (Reference Zhang, Bi, Hussain and She2014) can be recovered if
 $b_2$ is specified by evaluating the expression at the boundary-layer edge
 $\tilde {T}_e=\tilde {T}|_{\tilde {U}_e}$ and
 $b_1$ is determined using the Reynolds analogy. However, in this work, we use the matching data (denoted with subscript
 $m$)
 $\tilde {T}_m=\tilde {T}|_{\tilde {U}_m}$ to set
 $b_2$, such that the exact value at the matching location can be enforced. The final temperature–velocity relation is
 \begin{equation} \tilde{T} = \tilde{T}_w + s\,Pr\, (\tilde{T}_r-\tilde{T}_w)\, \frac{\tilde{U}}{\tilde{U}_e} \left(1 - \frac{\tilde{U}}{\tilde{U}_m} \right) + \left( \frac{\tilde{U}}{\tilde{U}_m} \right)^2 ( \tilde{T}_m-\tilde{T}_w ). \end{equation}
Note that one consequence of this relation is that the wall heat flux and wall shear stress are linked algebraically by the Reynolds analogy factor, where the heat flux is defined as  $q_w = s \tau _w C_p (\tilde {T}_w-\tilde {T}_r)/\tilde {U}_e$.
2.3. Implementation details
Like the classical model ((1.1)–(1.3)), the present model requires a matching temperature, velocity and density, an equation of state (the ideal gas law is used in this work and the thin boundary-layer assumption implies that the pressure is constant), and a viscosity law (either a power law or Sutherland's law, depending on the relevant reference data). In addition, the present model requires as input the velocity and temperature at the boundary-layer edge (computed using the method of Griffin, Fu & Moin Reference Griffin, Fu and Moin2021a) for deploying the algebraic temperature–velocity relation (2.5) due to its dependence on the recovery temperature and edge velocity. To solve the nonlinear system, the following approach is used. The incompressible ODE (1.1) with constant properties is integrated once analytically, rearranged for  ${\rm d}\tilde {U}/{{\rm d} y}$, and substituted into the inverse velocity transformation (2.2) as
 $S$. This equation (initial-value problem with an initial guess for the wall shear stress) is solved via the shooting method, where, at each integration step, a sub-iteration determines the velocity increment that is consistent with the temperature–velocity relation (2.5) and the resulting density and viscosity at that location.
The implementation of the present model is available at the link provided in the data availability section at the end of this paper. This implementation was first developed by Griffin, Fu & Moin (Reference Griffin, Fu and Moin2021b) to compute temperature and velocity profiles for estimating grid-point requirements in compressible flows, and this paper serves as the comprehensive documentation and the further development of the underlying inverse method for the WMLES approach for the first time. Intermediate developments were presented in Griffin, Fu & Moin (Reference Griffin, Fu and Moin2022b), and initial results were reported in Griffin, Fu & Moin (Reference Griffin, Fu and Moin2022a) and Griffin (Reference Griffin2022). Kumar & Larsson (Reference Kumar and Larsson2022) used a similar procedure but with a data-driven velocity transformation (Volpiani et al. Reference Volpiani, Iyer, Pirozzoli and Larsson2020b). Chen et al. (Reference Chen, Cheng, Fu and Gan2023) and Song, Zhang & Xia (Reference Song, Zhang and Xia2023) approximate the mean profiles of channel flows by considering two velocity transformations (Trettel & Larsson Reference Trettel and Larsson2016; Griffin et al. Reference Griffin, Fu and Moin2021c) and employing the central mean temperature scaling (Song et al. Reference Song, Zhang, Liu and Xia2022).
3. A priori results
The present and classical wall models are first evaluated via a priori analysis. That is, the matching data are taken from direct numerical simulations (DNS) at wall-normal distance  $y_m=0.3\delta$. The wall model estimates the velocity and temperature profiles, as well as the wall shear stress and wall heat flux. The predicted velocity and temperature profiles are shown in figures 1 and 2 for four channel flows with various Mach and Reynolds number conditions, figure 3 for two pipe flows at different Reynolds numbers, and figure 4 for two boundary layers, one with a heated and one with a cooled wall boundary condition. The bulk Mach number is defined as
 $M_b = U_b/\sqrt {\gamma R \tilde {T}_w}$, where
 $\gamma$ is the ratio of specific heats, and
 $R$ is the gas constant. The bulk Reynolds number is defined as
 $Re_b = \rho _b U_b \delta / \bar {\mu }_w$, where the bulk density is defined as
 $\rho _b = \iint _A \bar {\rho }\,{\rm d}A/A$, and the bulk velocity is defined as
 $U_b = \iint _A \tilde {U}\,{\rm d}A/A$, with
 $A$ the cross-sectional area of the domain. Reference DNS data are provided by Modesti & Pirozzoli (Reference Modesti and Pirozzoli2019), Trettel & Larsson (Reference Trettel and Larsson2016), Zhang et al. (Reference Zhang, Duan and Choudhari2018) and Volpiani et al. (Reference Volpiani, Bernardini and Larsson2020a). For all cases, the profiles predicted by the present model agree with the DNS profiles significantly better than the classical model. Note that the velocities are non-dimensionalized by the predicted friction velocity, so the obtained profiles do not necessarily pass through the matching data if the predicted wall stress is inaccurate.
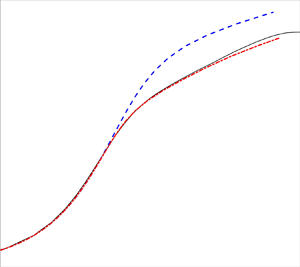
A priori wall-modelled profiles of (a,c) velocity and (b,d) temperature are plotted versus the wall-normal coordinate. Results are for supersonic channel flows with (a,b)  $Re_\tau ^* = 410$,
 $M_b = 1.7$ and
 ${-B_q=0.053}$, and (c,d)
 $Re_\tau ^* = 590$,
 $M_b = 1.7$ and
 $-B_q=0.049$.

A priori wall-modelled profiles of (a,c) velocity and (b,d) temperature are plotted versus the wall-normal coordinate. Results are for supersonic channel flows with (a,b)  $Re_\tau ^* = 590$,
 $M_b = 3.0$ and
 ${-B_q=0.12}$, and (c,d)
 $Re_\tau ^* = 200$,
 $M_b = 4.0$ and
 $-B_q=0.19$.

A priori wall-modelled profiles of (a,c) velocity and (b,d) temperature are plotted versus the wall-normal coordinate. Results are for supersonic pipe flows with (a,b)  $Re_\tau ^* = 333.5$,
 $M_b = 1.500$ and
 $-B_q=0.047$, and (c,d)
 $Re_\tau ^* = 668.8$,
 $M_b = 1.500$ and
 $-B_q=0.044$.

A priori wall-modelled profiles of (a,c) velocity and (b,d) temperature are plotted versus the wall-normal coordinate. Results are for hypersonic diabatic (isothermal) boundary layers with (a,b)  ${Re_\tau ^* = 5677}$,
 $M_e = 11.46$ and
 $-B_q=0.19$ (cooled wall), and (c,d)
 $Re_\tau ^* = 2328$,
 $M_e = 4.327$ and
 $-B_q=-0.039$ (heated wall).

Next, the model performance is evaluated with a wide range of DNS data from 48 different simulations. The errors in the modelled wall stress and heat flux predictions are reported for each case with  $y_m=0.3\delta$. The relative error in the wall stress prediction
 $\epsilon _{\tau _w}$ is defined as
 \begin{equation} \epsilon_{\tau_w} = \frac{\tau_{w,{model}} - \tau_{w,{DNS}}}{\tau_{w,{DNS}}} \times 100\,\%. \end{equation}
The non-dimensional wall heat flux is defined as  $B_q = q_{w}/(C_p \tilde {T}_w \bar {\rho }_w u_{\tau })$, and the relative error in the wall heat flux is defined as
 \begin{equation} \epsilon_{q_w} = \frac{ q_{w,{model}} - q_{w,{DNS}} }{q_{w,{DNS}}} \times 100\,\%. \end{equation}
Here,  $\epsilon _{q_w}$ is not reported for adiabatic boundary-layer data because it is undefined, and both models predict negligible heat transfer for these data. The data considered include the compressible channel flow simulations of Modesti & Pirozzoli (Reference Modesti and Pirozzoli2016), Trettel & Larsson (Reference Trettel and Larsson2016) and Yao & Hussain (Reference Yao and Hussain2020), the pipe flow simulations of Modesti & Pirozzoli (Reference Modesti and Pirozzoli2019), and the diabatic supersonic and hypersonic boundary layers of Zhang et al. (Reference Zhang, Duan and Choudhari2018), Volpiani et al. (Reference Volpiani, Bernardini and Larsson2018, Reference Volpiani, Bernardini and Larsson2020a) and Fu et al. (Reference Fu, Karp, Bose, Moin and Urzay2019). The cases have edge Mach numbers in the range 0.77–11, and semi-local friction Reynolds numbers in the range 170–5700. Only the cases with
 $Re_\tau ^* > 150$ are analysed because lower Reynolds numbers can exhibit strong Reynolds number effects (Modesti & Pirozzoli Reference Modesti and Pirozzoli2016) and are not the target of this study. The error measures are shown in figure 5. The present model generates significantly less modelling error than the classical model, with the greatest error reduction when the non-dimensional heat transfer is the highest.
A priori modelling errors of (a) the wall shear stress  $\tau _w$, and (b) the wall heat flux
 $q_w$, versus the heat transfer coefficient
 $B_q$. The model matching data are taken from DNS of various channel and pipe flows (squares) and diabatic boundary layers (circles).

To distinguish the effects of Reynolds number and compressibility, we explore the effect of using Reynolds-number-dependent coefficients for the underlying incompressible law of the wall. Specifically, rather than letting the von Kármán constant  $\kappa$ and the damping coefficient
 $A^+$ be fixed values of 4.1 and 17, respectively, we recalibrate these values using incompressible reference data at various Reynolds numbers. We employ the DNS data from five incompressible turbulent channel flows (Lee & Moser Reference Lee and Moser2015) with friction Reynolds numbers
 $Re_\tau = u_\tau \delta / \nu _w = \{182, 543, 1000, 1990, 5190\}$, and fit the least squares optimal values of
 $\kappa = \{0.400, 0.408, 0.400, 0.391, 0.391\}$ and
 $A^+ = \{18.2, 17.4, 17.0, 16.5, 16.5\}$. Linear interpolation and constant extrapolation of the optimal values are used to define
 $\kappa$ and
 $A^+$ for all Reynolds numbers. The inverse velocity transformation uses the semi-local wall-normal coordinate
 $y^*$, so the incompressible data should be interpreted as a function of
 $Re_\tau ^*$ rather than
 $Re_\tau$. A priori analysis is performed as before using compressible DNS data, but with the optimal coefficients selected according to the
 $Re_\tau ^*$ observed in the compressible DNS. In figures 6(a,b), for the case of a turbulent channel flow with
 $Re_\tau ^* = 190$ and
 $M_b = 1.7$, there is a modest improvement from using the Reynolds-number-dependent coefficients for the incompressible model. This suggests that at low Reynolds numbers, the deviation of DNS data for the incompressible constant-property velocity profile from the nominal law of the wall is of the same order as the deviation of the constant coefficient model and compressible DNS velocity profile. However, there is not a complete collapse of the model with Reynolds-number-dependent coefficients with the compressible DNS. This is likely attributed to the documented error in the compressible velocity transformation at
 $Re_\tau ^* \lesssim 200$ (Griffin et al. Reference Griffin, Fu and Moin2021c). In figures 6(c,d), the case of a turbulent channel flow with
 $Re_\tau ^* = 590$ and
 $M_b = 1.7$ is considered. The Reynolds number is high enough that the optimal and constant coefficients are similar; thus the performance of the present model with either set of coefficients is similar. Overall, there is no significant sensitivity to tuning the coefficients, so, for simplicity, we use the constant coefficients
 $\kappa =0.41$ and
 $A^+=17$ for the remainder of this paper.
A priori wall-modelled profiles of (a,c) velocity and (b,d) temperature are plotted versus the wall-normal coordinate. Results are for supersonic channel flows with (a,b)  $Re_\tau ^* = 190$,
 $M_b = 1.7$ and
 ${-B_q=0.057}$, and (c,d)
 $Re_\tau ^* = 590$,
 $M_b = 1.7$ and
 $-B_q=0.049$.

Two more recently developed compressible wall models are considered. The first is developed by Yang & Lv (Reference Yang and Lv2018); they show that the damping function in the classical model (1.2) is consistent with the velocity transformation of Van Driest (Reference Van Driest1951), which has been shown to be less accurate in channel flows than the velocity transformation of Trettel & Larsson (Reference Trettel and Larsson2016). Therefore, Yang & Lv (Reference Yang and Lv2018) rewrite the damping function in terms of  $y^*$, and show that this makes the model consistent with the Trettel–Larsson transformation. The second additional model considered is proposed by Chen et al. (Reference Chen, Lv, Xu, Shi and Yang2022), which also uses the semi-local damping function and further replaces the constant turbulent Prandtl number assumption of the classical model with an explicit function of
 $y^*$. In figure 7, these two additional wall models are compared with the classical and present wall models. Figures 7(a–d) indicate that all models are performing well in the channel flows except for the classical model. This behaviour is explained by the behaviour of the underlying velocity transformations. The models of Yang & Lv (Reference Yang and Lv2018) and Chen et al. (Reference Chen, Lv, Xu, Shi and Yang2022) use the Trettel–Larsson transformation, and the present model uses the total-stress-based transformation (Griffin et al. Reference Griffin, Fu and Moin2021c). Both of these transformations are well established to outperform the van Driest transformation (used by the classical model) in channel flows. In figures 7(e, f) and 7(g,h), the models are applied to boundary layers with cooled and heated walls, respectively. For both cases, the classical model is the least accurate, likely due to the inaccuracy of the van Driest transformation for boundary layers with strong heat transfer (Griffin et al. Reference Griffin, Fu and Moin2021c), as the velocity transformation is the only difference between the classical model and that of Yang & Lv (Reference Yang and Lv2018). Also for both cases, the models that use semi-local damping (Yang & Lv Reference Yang and Lv2018; Chen et al. Reference Chen, Lv, Xu, Shi and Yang2022) perform almost identically, suggesting limited sensitivity in these flows to the change in turbulent Prandtl number model proposed by Chen et al. (Reference Chen, Lv, Xu, Shi and Yang2022). For the heated boundary layer, the present model slightly improves the prediction of the temperature peak and the log slope of the velocity compared to the semi-local damping models. For the cooled boundary layer, there is a more substantial improvement from the present model for the log slope of the velocity, but the temperature profiles are only slightly improved. These improvements of the present model over the semi-local damping models are consistent with the improvements of the total-stress-based transformation over the Trettel–Larsson transformation for boundary layers with strong heat transfer.
A priori wall-modelled profiles of (a,c,e,g) velocity and (b,d, f,h) temperature are plotted versus the wall-normal coordinate for four wall models: (a–d) corresponding to supersonic channel flows presented in figure 1; (e–h) corresponding to hypersonic diabatic boundary layers presented in figure 4.

4. A posteriori WMLES results
In this section, several WMLES simulations are conducted using charLES, a high-fidelity compressible finite-volume code (Brès et al. Reference Brès, Bose, Emory, Ham, Schmidt, Rigas and Colonius2018). The numerical method consists of a low-dissipation, approximately entropy-preserving scheme, which utilizes artificial bulk viscosity to capture the solution discontinuities. Additional details about the solver and a summary of validation campaigns are available in Fu et al. (Reference Fu, Karp, Bose, Moin and Urzay2021, Reference Fu, Bose and Moin2022).
The WMLES conducted herein are compressible turbulent channel flows driven with uniform volumetric momentum and energy source terms to achieve the same bulk Mach number  $M_b$ and bulk Reynolds number
 $Re_b$ conditions of the DNS simulations of Trettel & Larsson (Reference Trettel and Larsson2016) as summarized in table 1.
Non-dimensional flow parameters for the nine compressible turbulent channel flow cases considered for a posteriori testing within the WMLES framework.

The cases are run on a domain of size  $({\rm \pi} \times 2 \times {\rm \pi}\sqrt {3}/4)\delta$ with periodic boundary conditions in the streamwise (first) and spanwise (third) dimensions. The mean profiles and fluxes were insensitive to doubling of the streamwise and spanwise domain sizes. Consistent with the DNS simulations, the viscosity is described by
 $\mu /\mu _{ref}=(T/T_{ref})^{0.75}$ and
 $Pr = 0.7$. All cases are initialized from a uniform solution with the target bulk Mach number and Reynolds number, and zero velocity in the wall-normal and spanwise directions. The simulations are allowed to transition from laminar to turbulent states naturally, and are run for
 $\sim 500$ eddy turnover times
 $\delta /u_\tau$. To challenge the wall model and isolate the effect of near-wall numerical errors (Kawai & Larsson Reference Kawai and Larsson2012), the wall model matching location is placed at
 $y_m=0.3\delta$, and a coarse grid of 12 points per half-channel height is used for all simulations unless indicated otherwise. The computational cost of the present model is similar to that of the classical model. The present model varies between being 7 % faster and 32 % slower, depending on the Reynolds number, matching location and Mach number. No effort was made to optimize the performance of the present model, so these numbers are just meant to indicate that the approximate cost of the model is similar in the cases tested. In general, modest differences in the cost of a wall model can be amortized efficiently over parallel processors via load balancing that assigns fewer control volumes to processors that contain more boundary faces, but this is not used in the present study.
The velocity and temperature profiles from WMLES are shown in figures 8 and 9 for turbulent channel flows at four combinations of Reynolds and Mach numbers. In all cases, the present model is significantly more accurate than the classical model for the prediction of velocity and temperature with respect to the reference DNS solutions. For these cases and the others listed in table 1, the errors in the predictions of the wall shear stress and the wall heat flux are shown in figure 10. The wall model is based on the inversion of the total-stress-based velocity transformation (Griffin et al. Reference Griffin, Fu and Moin2021c), and that was observed to have the greatest improvement over classical approaches in cases with strong heat transfer. This explains why the errors from the classical wall model grow significantly with the strong heat transfer, but the errors from the present model are rather small and do not vary with heat flux.
(a,c) Velocity and (b,d) temperature profiles from WMLES with the classical (blue) and present (red) wall models. A channel flow with  $M_b=1.7$,
 $Re_\tau ^*=410$ and
 $-B_q = 0.053$ is shown in (a,b), and one with
 $M_b=1.7$,
 $Re_\tau ^*=590$ and
 $-B_q = 0.049$ is shown in (c,d). Within the WMLES framework, the outer solutions are computed by the LES PDE solver, while the inner solutions are computed by the two wall models. These solutions coincide at the LES matching point nearest to
 $y_m=0.3\delta$, which is indicated with the dashed and dotted lines for the classical and present models, respectively.

(a,c) Velocity and (b,d) temperature profiles from WMLES with the classical (blue) and present (red) wall models. A channel flow with  $M_b=3.0$,
 $Re_\tau ^*=590$ and
 $-B_q=0.12$ is shown in (a,b), and one with
 $M_b=4.0$,
 $Re_\tau ^*=200$ and
 $-B_q=0.19$ is shown in (c,d). Within the WMLES framework, the outer solutions are computed by the LES PDE solver, while the inner solutions are computed by the two wall models. These solutions coincide at the LES matching point nearest to
 $y_m=0.3\delta$, which is indicated with the dashed and dotted lines for the classical and present models, respectively.

The WMLES a posteriori modelling errors for (a) the wall shear stress  $\tau _w$ and (b) the wall heat flux
 $q_w$, versus the non-dimensional heat flux
 $B_q$. WMLES is conducted using the classical (blue) and present (red) wall models for turbulent channel flows at the nine operating conditions listed in table 1.

The primary quantities of interest for WMLES are the predictions of the mean profiles and fluxes. The fluctuating parts of LES solutions are not expected to agree exactly with DNS results unless the WMLES are conducted with DNS-like resolution, which is impractical. Nevertheless, the effect of wall models on the fluctuating part of the LES solution is presented for comparison between the present and classical models. Figures 11 and 12 include profiles of the LES resolved turbulent Mach number  $M_t=u''/\sqrt {\gamma R \tilde {T}}$ and the LES temperature fluctuations
 $T''$, where
 $''$ denotes the Favre fluctuation, with
 $({\cdot })'' = ({\cdot }) - \widetilde {({\cdot })}$. There is an improvement in the predictions of the fluctuating statistics by the present model compared to those by the classical model. An accurate prediction of second-order statistics is unlikely without an accurate prediction of mean statistics. Thus the improved second-order statistics of the present model are likely a consequence of its improved mean statistics compared to those of the classical model (see figures 8 and 9). However, correct prediction of the mean field is not sufficient for the accurate prediction of second-order statistics in LES. In fact, the fluctuations in the LES results are generally over-predicted compared to the DNS data. The over-prediction may be due in part to the wall-blocking effect of stress-based wall model (Bae et al. Reference Bae, Lozano-Durán, Bose and Moin2018). Given the coarse resolution of twelve points across the channel half-height, numerical errors and subgrid-scale model errors are certainly contributing. The subgrid-scale model has not been adapted for compressibility other than by accounting for variable properties (Moin et al. Reference Moin, Squires, Cabot and Lee1991). The turbulent Mach numbers are of the order of 0.3, which is sufficiently high that modelling for dilatational dissipation is a promising path to further improvements of the fluctuating statistics in the volume of the LES domain. Such research may be pursued independently of the current study focusing on wall modelling and the prediction of mean profiles and fluxes.
The (a,c) LES turbulent Mach number  $M_t$ and (b,d) LES temperature fluctuation
 $T''$ profiles from WMLES with the classical (blue) and present (red) wall models. A channel flow with
 $M_b=1.7$,
 $Re_\tau ^*=410$ and
 $-B_q = 0.053$ is shown in (a,b), and one with
 $M_b=1.7$,
 $Re_\tau ^*=590$ and
 $-B_q = 0.049$ is shown in (c,d). The symbols represent the outer solutions computed by the LES PDE solver.

The (a,c) LES turbulent Mach number  $M_t$ and (b,d) LES temperature fluctuation
 $T''$ profiles from WMLES with the classical (blue) and present (red) wall models. A channel flow with
 $M_b=3.0$,
 $Re_\tau ^*=590$ and
 $-B_q = 0.12$ is shown in (a,b), and one with
 $M_b=4.0$,
 $Re_\tau ^*=200$ and
 $-B_q = 0.19$ is shown in (c,d). The symbols represent the outer solutions computed by the LES PDE solver.

4.1. Sensitivity to numerical resolution and the matching location
In WMLES, the wall model exchanges data with the outer LES solver at the matching location. The modelling error in the inner wall-modelled equations may grow as the matching distance increases, which motivates placing the matching location near the wall. On the other hand, the matching location should be far enough from the wall in terms of the LES mesh resolution so that the LES solver can resolve the large scales of turbulence at the height of the matching location. Otherwise, numerical errors may contaminate the matching data that are provided as input to the wall model. Kawai & Larsson (Reference Kawai and Larsson2012) demonstrate this trade-off and how LES numerical errors contaminate the wall-modelled solution if the matching distance is of the order of the wall-normal grid resolution. The optimal matching distance will depend on the accuracy of a specific LES solver, but a typical choice is  $y_m \ge 3\varDelta$ (Kawai & Larsson Reference Kawai and Larsson2012), where
 $\varDelta$ is the wall-normal grid spacing near the wall.
To evaluate the convergence and sensitivity of the presently proposed wall model, two types of mesh convergence studies are considered. In the first study, the matching location is held fixed at  $y_m=0.3\delta$, which corresponds in semi-local units to
 $y_m^*=186$ and
 $y_m^*=237$ for the present model and classical model cases across all resolutions. For the case with
 $M_b=3.0$ and
 $Re_\tau =1800$, the numerical resolution of the WMLES is varied. In figure 13, the WMLES solutions are shown for three LES resolutions with 9, 18 and 36 grid points across the channel half-height. The uniform hexagonally close-packed mesh topology with global refinement is employed, resulting in three meshes with
 $2.0\times 10^4$,
 $1.6\times 10^5$ and
 $1.3\times 10^6$ control volumes, respectively. (Note that the reference DNS uses as many as
 $6.4\times 10^8$ control volumes.) In this study, the LES numerical errors at the matching location are expected to diminish as the resolution is refined, but modelling errors from using the wall model over the domain
 $y\in [0,0.3\delta ]$ are not expected to change with resolution. For this reason, the classical model shows a large error in the log intercept of the velocity profile that is persistent with refinement and consistent with a priori analysis in figure 2(a). For the finest resolution with the present model, the grid point nearest to the wall exhibits an error that is persistent with refinement, which is consistent with the observations of (Kawai & Larsson Reference Kawai and Larsson2012) and does not affect the accuracy of the simulation since the inner solution is applicable for
 $y< y_m$. For both the present and classical models, the results are only weakly dependent on the grid resolution. This suggests that the leading source of error for the simulations with the classical wall model is in fact the wall model rather than the numerical or subgrid-scale modelling errors, even on the coarsest simulation with 9 grid points per channel half-height.
A posteriori mesh sensitivity study of a channel flow at  $M_b=3.0$ and
 $Re_\tau ^*=590$ with the matching location fixed at
 $y_m=0.3\delta$ for all cases, as indicated by the vertical dashed lines. The colours indicate the numerical resolution
 $\varDelta$. The outer WMLES solutions and the inner wall-modelled velocity profiles are indicated with symbols and dotted curves, respectively, for (a) the present wall model and (b) the classical wall model.

In the second grid convergence study, the models are tested in the way that WMLES is typically used in practice. That is, the matching distance is moved towards the wall as the grid is refined. In this study, two channel flows with different Reynolds number conditions are considered for three LES resolutions with 12, 24 and 48 grid points across the channel half-height. The matching locations are  $y_m= 0.3\delta$,
 $0.15\delta$ and
 $0.075\delta$, respectively, which corresponds to
 $y_m = 4 \varDelta$ for all cases, thus the effect of near-wall LES numerical errors is expected to be minor (Kawai & Larsson Reference Kawai and Larsson2012). In figure 14, the convergence study is performed for
 $M_b=3.0$ and
 $Re_\tau ^*=590$, and a lower Reynolds number case with
 $M_b=3.0$ and
 $Re_\tau ^*=200$ is shown in figure 15. In both cases, the accuracy of the present model is relatively high and insensitive to mesh resolution compared to that of the classical model. For the higher Reynolds number test, the matching locations in semi-local units are always in the logarithmic region of the boundary layer. Therefore, the WMLES results are not sensitive to refinement over this range of resolutions. However, for the lower Reynolds number case, the most refined meshes lead to semi-local matching locations
 $y_m^*$ in the buffer region. For the classical model, because the relative error of the modelled
 $U^+$ versus the DNS
 $U^+$ is maximal in the region of the buffer layer and early log layer (compare to similar a priori results in figure 6), the convergence behaviour for the classical model is complex in this regime. In other words, as the mesh is refined, although the LES numerical errors are diminishing, the wall modelling errors for the classical model may increase or decrease depending on the matching location since the relative modelling error does not reduce monotonically with wall-normal distance. On the other hand, the outer solution of the present model is relatively accurate irrespective of the matching location because the inner wall-modelled solution agrees well with the DNS solution throughout the viscous sublayer, buffer layer and log layer (which is consistent with similar a priori results in figure 6).
A posteriori mesh sensitivity study of a channel flow at  $M_b=3.0$ and
 $Re_\tau ^*=590$ with matching locations dependent on the grid resolution as
 $y_m = 4\varDelta$. The colours indicate semi-local matching distance
 $y_m^*$, which is also indicated with vertical dashed lines. The outer WMLES solutions and the inner wall-modelled velocity profiles are indicated with symbols and dotted curves, respectively, for (a) the present wall model and (b) the classical wall model.

A posteriori mesh sensitivity study of a channel flow at  $M_b=3.0$ and
 $Re_\tau ^*=200$ with matching locations dependent on the grid resolution as
 $y_m = 4\varDelta$. The colours indicate semi-local matching distance
 $y_m^*$, which is also indicated with vertical dashed lines. The outer WMLES solutions and the inner wall-modelled velocity profiles are indicated with symbols and dotted curves, respectively, for (a) the present wall model and (b) the classical wall model.

5. Conclusion
In this work, a wall model is proposed for turbulent wall-bounded flows with heat transfer. The model uses an established ODE description of incompressible flow, transforms that equation to account for compressibility effects, and is closed with an algebraic temperature–velocity relation. The resulting model can estimate accurately the near-wall profiles of temperature and velocity when the matching location is in the inner layer. This model is suitable for deployment as a boundary condition for an outer LES or RANS solver, an inflow generation scheme, or the base flow for perturbation methods, possibly with the incompressible model augmented with a wake profile for the outer layer of the boundary layer. The proposed method can only be as accurate as the models on which it is based, namely, the forward velocity transformation and the algebraic temperature–velocity relation. While these models have been validated widely in channel and pipe flows, and boundary layers with moderate pressure gradients, further studies in complex flows are warranted, e.g. the developing boundary layers on a blunt body behind a curved shock.
The model is first tested a priori to verify that it can recover the boundary-layer velocity and temperature data when provided with matching data from DNS. Numerical results reveal that the model recovers accurately the targeted profiles, and the predicted wall stress and heat flux are within a few per cent of their expected values for a wide database of DNS data for high-Mach-number turbulent channel flows, pipe flows and boundary layers (48 cases, with edge Mach numbers in the range 0.77–11, and semi-local friction Reynolds numbers in the range 170–5700). The model is also tested a posteriori as a boundary condition for WMLES in turbulent channel flows with bulk Mach numbers  $M_b=0.7$–
 $4.0$ and
 $Re_\tau =320$–
 $1800$. Especially in flows with strong heat transfer, the proposed model is substantially more accurate than the classical ODE-based near-wall model. The superior performance of the present model is due to two key differences with respect to the classical model: (1) the constant turbulent Prandtl number assumption is replaced with a more accurate algebraic temperature–velocity relation; and (2) the van Driest velocity transformation is replaced with the total-shear-stress velocity transformation (Griffin et al. Reference Griffin, Fu and Moin2021c).
Acknowledgements
We wish to gratefully acknowledge helpful comments from S.T. Bose. This work was authored in part by the National Renewable Energy Laboratory, operated by Alliance for Sustainable Energy, LLC, for the US Department of Energy (DOE) under contract no. DE-AC36-08GO28308. The views expressed in the paper do not necessarily represent the views of the DOE or the US Government. The US Government retains and the publisher, by accepting the article for publication, acknowledges that the US Government retains a non-exclusive, paid-up, irrevocable, worldwide licence to publish or reproduce the published form of this work, or allow others to do so, for US Government purposes.
Funding
K.P.G. acknowledges support from the National Defense Science and Engineering Graduate Fellowship, the Stanford Graduate Fellowship, the Stanford Lieberman Fellowship and the Exascale Computing Project (grant 17-SC-20SC), a collaborative effort of two US Department of Energy organizations (Office of Science and the National Nuclear Security Administration) responsible for the planning and preparation of a capable exascale ecosystem, including software, applications, hardware, advanced system engineering, and early testbed platforms, in support of the nation's exascale computing imperative. L.F. acknowledges funding from the Research Grants Council (RGC) of the Government of Hong Kong Special Administrative Region (HKSAR) with RGC/ECS project no. 26200222, and from the Guangdong Basic and Applied Basic Research Foundation (no. 2022A1515011779). P.M. acknowledges support from NASA grant no. NNX15AU93A.
Declaration of interests
The authors report no conflict of interest.
Data availability statement
The data that support the findings of this study are available from the corresponding authors upon reasonable request. Matlab code implementing the proposed model is available in the following public repository: https://github.com/kevingriffin1/comp_wall_model.


 Open access

