

I. Introduction
IN the early days of the Arab Spring, Egyptians flocked to social media to organize, follow, and participate in mass protests erupting in Tahrir Square and across the country.Footnote 1 Despite the resurgence of authoritarianism in postrevolutionary Egypt, online mass political communication has continued to grow and evolve at extraordinary rates.Footnote 2 Social media data provide new insights into the shifting attitudes and communication networks of politically engaged Egyptians during a period of increasing repression and polarization in the aftermath of the July 2013 coup that ousted Egypt’s first democratically elected president, Mohamed Morsi. Exploiting the real-time networked structure of Twitter data, this article investigates the relationship between social- network diversity—in this case, the ideological heterogeneity of an individual’s Twitter networkFootnote 3—and political intoleranceFootnote 4 in the Egyptian Twittersphere.
Twitter’s architecture allows for longitudinal analysis of users’ connections to elites, media sources, activists, and everyday citizens on the same platform, unlike traditional survey methods that rely on self-reported descriptions of individuals’ networks and attitudes at a single moment in time.Footnote 5 The platform’s structure provides detailed insight into individuals’ communication networks and the sources through which they receive political information. Furthermore, the informality and immediacy of tweets offer real-time measures of engaged individuals’ sensitive political attitudes, which can be particularly difficult to evaluate in undemocratic polities.Footnote 6
By using Twitter data to obtain temporally granular behavioral measures of network diversity and intolerance, this article offers new tests of the long-theorized relationship between exposure to ideological diversity and political tolerance. In particular, the longitudinal nature of Twitter data enables us to measure changes in network structures and publicly expressed attitudes over time. Doing so allows us to assess whether any observed relationship between network diversity and tolerance is simply a consequence of the initial self-selection of already tolerant individuals into diverse networks, or whether longer exposure to a diverse network is associated with decreased intolerance over time. Additionally, given that Twitter data enable us to examine mass and elite behavior on the same platform, we can evaluate whether the relationship between network diversity and tolerance is driven by exposure to elite,Footnote 7 non-elite,Footnote 8 or both elite and non-elite networks, providing new insights into the mechanisms by which network diversity might affect political tolerance.
We find that not only is greater network diversity associated with lower levels of intolerance, but also that spending an additional year in a diverse network is associated with a significant decrease in the use of intolerant rhetoric over time. Our results provide suggestive evidence that exposure to both elite and non-elite network diversity—particularly the presence of more moderates in an individual’s network—may reduce political intolerance. By examining the relationship between exposure to elite and non-elite ideological diversity and intolerant behavior over time, this article contributes to the political tolerance literature and adds to a growing body of research examining the relationship between online networks and political attitudes and behavior.
II. Political Intolerance in the Egyptian Twittersphere
Since the outbreak of the Arab Spring protests in late 2010, Twitter use among Arab citizens has grown dramatically.Footnote 9 Collectively, the Arab world generates 27.4 million tweets per day, with 20 percent of these tweets coming from Egypt.Footnote 10 On average, Egyptian Twitter users produce 151 million tweets each month.Footnote 11 Although Facebook and WhatsApp are more popular than Twitter in Egypt,Footnote 12 Twitter is particularly conducive to political discussions because users follow accounts based on particular interests and tend to focus on sharing information rather than reciprocal social interaction.Footnote 13
Twitter has facilitated the creation of flexible networks of political communication outside of traditional civil society and media centers.Footnote 14 In Egypt, it evolved from a tool initially used by educated youth and activists into a platform for diverse individuals, including students, blue-collar workers, and even the elderly.Footnote 15 Elites across Egypt’s political spectrum—from aged generals to clerics and prominent members of the Muslim Brotherhood—have Twitter accounts. Because Twitter allows connections to elites and non-elites on the same platform, its networks not only transcend offline social connections, but also grant everyday citizens unprecedented access to elites.
Despite early optimism during the Egyptian Revolution that social media could facilitate democratic transition and political engagement, social media has also been used to achieve short-term political goals, to manipulate public opinion, and even to incite violence.Footnote 16 In the years following the 2013 coup, Egyptians witnessed widespread civil liberties violations and human rights abuses. The Muslim Brotherhood and most other Islamist organizations were excluded from politics, the media, and civil society. SecularFootnote 17 activists were jailed, and many of their organizations were banned.Footnote 18 From 2013 to 2017, approximately sixty thousand Egyptians were imprisoned and Egyptian authorities built ten additional prisons to accommodate them. In early 2017, reports estimated that an average of three to four forced disappearances occurred per day, and local human rights groups documented hundreds of extrajudicial killings and thousands of cases of torture.Footnote 19
Following the coup, elite rhetoric became increasingly intolerant, often calling for the total exclusion of opponents from political and public life.Footnote 20 In May 2014, for example, on live television, a representative of President Abdul Fatah al-Sisi’s election campaign called for the arrest of all Muslim Brotherhood members in Egypt, asserting that those who did not love Egypt “should be hit with shoes.” Similarly, in a 2014 interview on a satellite channel, prominent host Mohammed Moussa openly called for the arrest and execution of atheists and secularists as part of a “war against destructive ideas.”Footnote 21
In this tense political environment, social media rhetoric by political elites and politically engaged citizens was often inflammatory. Among secular Egyptians, tweets commonly called for death sentences for Muslim Brotherhood leaders, decried Islamists as terrorists, and proclaimed that the Muslim Brotherhood would never again return to power in Egypt. On the Islamist side, tweets inciting violence or proclaiming that Egypt was for Islamists only were also common. Tweets documenting and denouncing the regime’s civil liberties violations proliferated as well. Examining these trends, Ingmar Weber, Venkata Garimella, and Alaa Batayneh find increasing polarization among Egyptian Twitter users after the coup, with both Islamist and secular users more likely to retweet and mention users of the same political orientation.Footnote 22 Robert Kubinec and John Owen show that the coup led to increased polarization in the Egyptian Twittersphere that diffused transnationally as well.Footnote 23 Similarly, Marc Lynch, Dean Freelon, and Sean Aday demonstrate that Egypt’s online public became progressively segregated into clusters of like-minded individuals who frequently expressed fear, paranoia, and mistrust.Footnote 24
But what is the relationship between these increasingly polarized Egyptian Twitter networks and political behavior? Does spending time in a more ideologically diverse or homogeneous online network change the content of users’ political discourse? Or do people simply self-select into networks that reflect their existing beliefs and continue to update their networks as their attitudes shift? In the tense political climate of postcoup Egypt, the Egyptian Twittersphere provides an ideal setting for studying the relationship between network diversity and political intolerance over time.
III. Theoretical Motivation and Expectations
Social scientists have long posited that diverse social networks contribute to political tolerance by broadening individuals’ horizons and exposing them to new ideas.Footnote 25 This research was initially motivated by Gordon Allport’s contact hypothesis, which suggests that interactions with outgroups alleviate hostility by undermining false stereotypes and drawing attention to individual characteristics rather than to group generalizations.Footnote 26 Numerous studies demonstrate that interactions with members of an outgroup create greater awareness of legitimate rationales for opposing views and motivate citizens to care about upholding the civil liberties of those with whom they disagree or whom they dislike.Footnote 27 Although the majority of this work has been conducted in the United States,Footnote 28 social network diversity has been found to be associated with increased political tolerance in a variety of cultural contexts, including Israel,Footnote 29 Japan,Footnote 30 and South Africa.Footnote 31 But other work suggests that the relationship may be conditional on positive social interactions, threat perception, or other factors.Footnote 32
Exposure to diversity need not come from direct interpersonal contact with outgroup members. Instead it may come from exposure to print and electronic media. Craig Calhoun argues, “In modern societies, most of the information we have about people different from ourselves comes not through any direct relationships, even the casual ones formed constantly in urban streets and shops. Rather it comes through print and electronic media.”Footnote 33 Similarly, Diana Mutz writes, “The future of communication across lines of political difference lies in technologies that transcend geographic space.”Footnote 34 Thus, online social network diversity may serve as a form of indirect contact—albeit quite different from the direct contact Allport envisioned in the 1950s.
Indeed, more recent research suggests that online social networks force users to confront political information that they would otherwise avoid.Footnote 35 Online social networks have sometimes been optimistically portrayed as a means of spreading information and proliferating points of contact across political and sectarian divides.Footnote 36 For example, Ceren Budak and Duncan Watts find that exposure to members of opposition groups online during the 2013 Gezi Park protests in Turkey led to greater support of these groups.Footnote 37 But other studies indicate that although social media increases exposure to diverse political information, it also enables individuals to seek out content that reinforces their existing views, creating echo-chamber environments that foster social extremism and political polarization.Footnote 38
Most of the literature on network diversity and tolerance (both online and offline) focuses on the link between non-elite or peer networks and tolerance.Footnote 39 We therefore first explore the relationship between non-elite network diversity and tolerance. Motivated by theory and empirical findings in the political tolerance literature, we hypothesize:
—H1a. Non-Elite Network Diversity: Egyptian Twitter users in diverse non-elite networks will express less political intolerance than those in more homogeneous networks.
In line with past studies of the relationship between network diversity and tolerance outlined above, we first expect that greater non-elite network diversity will be associated with lower levels of intolerance. But merely observing this association tells us nothing about the direction of the relationship. For example, imagine a hypothetical Egyptian Twitter user, Ahmed, who has both a relatively diverse network and a relatively low level of intolerance. Does Ahmed choose to cultivate a Twitter network that reflects his preexisting level of tolerance? Does exposure to diversity through Ahmed’s Twitter network cause him to become more tolerant? Do both processes play out at the same time?
Examining how Ahmed’s network and level of tolerance change over time helps us to assess the hypothesized association between network diversity and tolerance. Even if Ahmed already expressed low levels of intolerance when he initially chose to create a diverse network, does he become more tolerant after spending more time in his diverse network? We hypothesize that beyond the general association between network diversity and tolerance, individuals who spend more time in diverse networks will become more tolerant over time:
—H1b. Non-Elite Network Diversity over Time: Egyptian Twitter users in diverse non-elite networks will express less political intolerance after spending more time (from t 1 to t 2) in their diverse networks, whereas those in more homogeneous networks will express more intolerance over time.
What might lead Ahmed to express less intolerance after spending more time in a diverse network? Does more time in the network make Ahmed less likely to tweet intolerant content because he has been repeatedly exposed to outgroup members or to a wider range of ideas than he would otherwise encounter? Or do exogenous events lead Ahmed to continue to adapt both the structure of his network and the content of his tweets as his beliefs evolve over time?
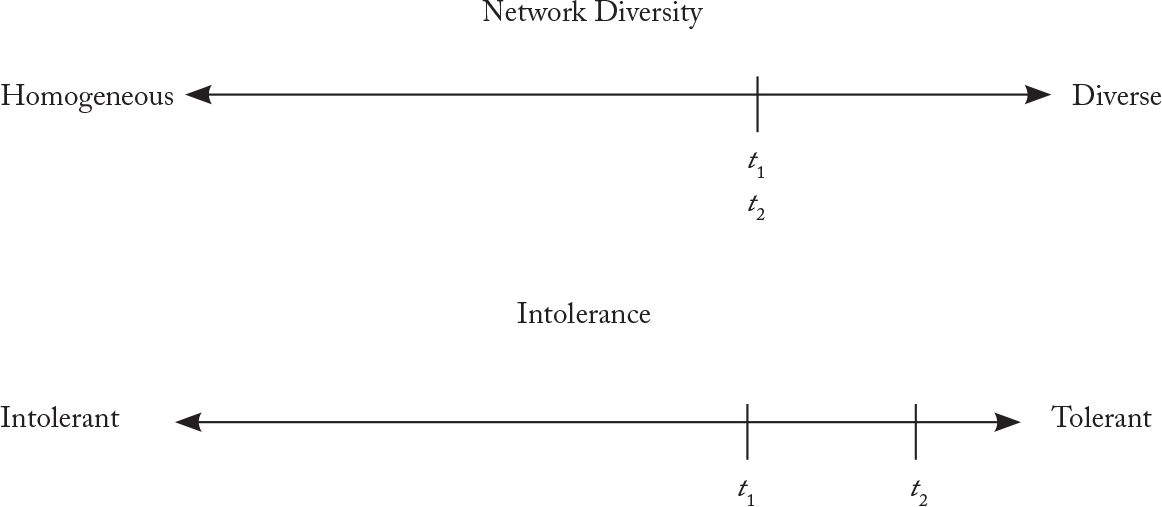
Figure 1 illustrates H1b, depicting Ahmed’s network diversity and tolerance at t 1 and a year later at t 2. The composition of Ahmed’s Twitter network does not change and he becomes more tolerant over the course of spending an additional year in a diverse network.
Network Diversity and Intolerance over Timea
a Figure displays the relationship between network diversity and intolerance over time (from t 1 to t 2) for a hypothetical Egyptian Twitter user, Ahmed.

Beyond descriptively assessing whether exposure to network diversity is associated with increased intolerance over time, we can interpret H1b causally if the following assumptions are met:
—1. Changes in Twitter users’ tolerance over time from t 1 to t 2 are not associated with a simultaneous change in the diversity of Twitter users’ networks.
—2. Twitter users’ decisions to select into either diverse or homogeneous networks at t 1 are independent of a subsequent bidirectional change in Twitter users’ behavior, whereby users in diverse networks express less intolerance and users in homogeneous networks express more intolerance at t 2 than they did at t 1. Along these lines, the ignorability assumption requires that individuals who self-select into a particular type of network at t 1 are not more likely to have a particular subsequent change in their behavior.
—3. The Stable Unit Treatment Value Assumption (sutva) requires that the response of a particular individual depends only on the treatment to which that unit was assigned, not the treatments of others.
The first assumption is met in Figure 1, as the diversity of Ahmed’s network does not change over time from t 1 to t 2. But is this a reasonable assumption for Egyptian Twitter users more broadly? Research on the Egyptian Twittersphere suggests that Egyptians became increasingly polarized into Islamist and secular networks in the immediate aftermath of the 2013 coup and subsequent violent repression of Islamists.Footnote 40 The period after the coup was marked by a great unfollowing in which anti-Brotherhood social media users stopped following Islamists, and vice versa, en masse, with social media campaigns calling on people to defriend Islamists. This suggests that by the time of our study in 2015, individuals who intended to change the ideological composition of their networks would likely have already done so. We can test empirically whether this first assumption is met by evaluating whether individuals in our study changed the diversity of their network from t 1 to t 2 and the degree to which this change is associated with simultaneous changes in tolerance.
The second assumption would be violated if (1) individuals like Ahmed who self-select into a particular network were more likely to change their behavior in a particular direction over time, or (2) a confounder both drove individuals like Ahmed to select into a diverse network by t 1 and caused them to express less intolerance at t 2 than they did at t 1, while driving others to both self-select into more homogeneous networks by t 1 and to express more intolerance at t 2 than they did at t 1. For example, if Ahmed held relatively tolerant beliefs at t 1, he might self-select into a diverse network at t 1, and then exogenous events between t 1 and t 2 might lead him—as an already tolerant person—to express lower levels of intolerance over time, independent of his network. At the same time, Twitter users who held relatively intolerant beliefs at t 1 might select into homogeneous networks and then been driven by the same events to express even more intolerance by t 2 than they did at t 1. Although this example is plausible, it would require that the confounder drive initial selection into networks and drive individuals in those networks to change their behavior in different directions.
Regarding the third assumption, in the event that sutva were violated, we would need to interpret our results as the effect of an individual’s network diversity on their level of tolerance given that other people’s behavior is also simultaneously being impacted by the level of network diversity to which they are exposed. Although this interpretation is narrower, it is also more in line with the naturalistic experience of participating in an online social network.
Finding evidence for H1b will, at a minimum, improve our descriptive understanding of how the relationship between network diversity and tolerance evolves over time. If we believe that our three assumptions are reasonable, then we can offer suggestive evidence that exposure to network diversity increases tolerance over time. Because these assumptions are difficult to test, we also conduct sensitivity analysis to understand how strong a confounder would need to be to change our results.
Although studies of social network diversity and political tolerance tend to focus on interactions among ordinary citizens or non-elite network diversity, exposure to elite cues may also play a role.Footnote 41 Research in the US and in comparative contexts suggests that citizens rely on simple and reliable cues from elites to make policy judgments.Footnote 42 Elites often have incentives to shape public opinion toward an outgroup, and when elites perceive a threat to their power, they may advocate punitive policies or work to mobilize public opinion against outgroups.Footnote 43
Exposure to more diverse elite cues—particularly through the opening of the media following democratic transitions—has been shown to move public opinion against policies that violate the civil liberties of an outgroup.Footnote 44 Connecting elite cue theory to political tolerance, Allport notes that the effect of intergroup contact on tolerance relies on “authority support.”Footnote 45 Elites alert the public to social norms within their political ingroup and shape attitudes and behaviors toward outgroups.Footnote 46 On Twitter, individuals can choose to follow particular elites, cultivating networks that shape their exposure to elite cues. The literature on the key role of elite actors motivates our second set of hypotheses:
—H2a. Elite Network Diversity: Egyptian Twitter users who follow more ideologically diverse elite actors will exhibit less political intolerance relative to those who follow more ideologically homogeneous elites.
—H2b. Elite Network Diversity over Time: Egyptian Twitter users in more diverse elite networks will exhibit less political intolerance over time (from t 1 to t 2), whereas those in more homogeneous elite networks will exhibit more intolerance over time.
We hypothesize that a negative relationship exists between elite network diversity and intolerance generally, and that spending more time in a diverse elite network will be associated with a decrease in an individual’s expression of intolerance from t 1 to t 2. Although this hypothesis is descriptive, it can again be interpreted causally if individuals do not change the diversity of their networks from t 1 to t 2 and if we assume that the decision to initially select into a particular network at t 1 is not associated with a future bidirectional change in tweeting behavior—toward less intolerance for those in diverse networks and more intolerance for those in homogeneous networks—between t 1 and t 2.
IV. Measurement and Data Measuring Political Intolerance on Twitter
Tolerance is traditionally defined in the political science literature as the degree to which citizens support the extension of civil liberties to political rivals, including groups advocating highly disagreeable viewpoints and ideologies.Footnote 47 Civil liberties include the right to vote, to participate in political parties, to organize politically, to free speech and assembly, and to a fair and speedy trial, as well as other basic civil rights. Political intolerance, by contrast, is a form of exceptionalism that seeks to limit the civil liberties of particular citizens or groups, and hence, their ability to compete for political power.Footnote 48
The three main approaches to measuring political tolerance use survey questions that ask, respectively, whether the respondent believes political activities should be allowed for members of a specific outgroup (fixed-group approach), whether political activities should be allowed for members of a group that the respondent reports liking least (leastliked approach), and whether the respondent approves of polices that would limit civil liberties generally.Footnote 49 A crucial aspect of tolerance is the so-called “objection precondition,” which states that tolerance is restraint of the urge to repress one’s political enemies or members of an outgroup.Footnote 50 For example, in the US context, Democrats cannot be said to be “tolerant” of other Democrats because they are both members of the same political group, but they may or may not be tolerant of Republicans (their primary political competitors). Measuring tolerance is therefore a two-step procedure. First, researchers must establish that an individual dislikes or is in competition with a political group. Then they must measure the extent to which the individual supports or opposes the political rights of that group.Footnote 51 Measuring intolerance is a simpler endeavor. Expressing a desire to limit any group’s civil liberties implies dislike.
We operationalized Egyptian Twitter users’ political intolerance by measuring the frequency and the relative frequency with which they tweeted intolerant content online. We chose to measure intolerance— rather than tolerance—because it is easier to measure, given that the objection precondition is, by definition, satisfied. We measured intolerance through a two-step process. We first classified tweets as relevant or not to civil liberties in Egypt. We next determined whether these relevant tweets were or were not intolerant.
We began with a data set of approximately 130 million tweets related to Egypt or Egyptian politics containing the Arabic key words “Egypt,” “Sisi,” “Morsi,” “Muslim Brotherhood,” “coup,” “protest,” “revolution,” or “military rule,” as well as a data set of approximately eighteen million tweets with geolocation metadata indicating they were sent from Egypt. Many tweets in these initial data sets were likely irrelevant to Egyptian politics—not to mention civil liberties—because they contained the very broad key word “Egypt” or were included simply because geolocation metadata indicated that they were sent from Egypt. To obtain a training data set that contained a sufficient number of relevant tweets, we first identified the two hundred most common terms in our data and selected those that were plausibly relevant to civil liberties, including “court,” “constitution,” “prison,” “arrest,” “rights,” “law,” “coup,” and “military.”Footnote 52 We next took a sample of five thousand tweets from the data set that contained key words that we might expect to be relevant to civil liberties.
We then used the data enrichment platform Figure Eight to code each of these five thousand tweets according to whether they were relevant to civil liberties in Egypt. The coding was done by three native Arabic-language speakers. Using the human-coded data, we trained a Naive Bayes classifier to classify the roughly 148 million tweets in our data set as relevant (or not) to civil liberties in Egypt.Footnote 53 After using our classifier to identify relevant tweets, we used human-coded data to train a second classifier to classify relevant tweets as intolerant or not.Footnote 54
Under our coding scheme for the training data, translated and presented in Appendix A of the supplementary material, intolerant tweets support restricting civil liberties in Egypt. These tweets include those that favor civilian arrests, death sentences, or torture; those that support limiting the right to free speech, protest, or assembly; and those that advocate for banning political parties or excluding certain groups from formal or informal political participation.Footnote 55
An example of an intolerant tweet found in the Twittersphere shows a graphic image portraying former President Morsi and other prominent Muslim Brotherhood members on their way to the gallows. The Arabic text of the tweet states, “God willing, the traitors, spies, and terrorists will be executed. The people want the execution of the Brotherhood.” Because this tweet clearly opposes the civil liberties of Islamists, it is classified as intolerant. Translated examples of randomly selected relevant and intolerant tweets are provided in Appendix A. Our intolerance classifier enabled us to obtain longitudinal measures of intolerance for any Egyptian Twitter users who repeatedly tweeted content relevant to civil liberties in Egypt.
Measuring Twitter Network Diversity
To measure network diversity, we first developed a measure of political orientation—namely, whether a Twitter user was Islamist, secular, or neither (moderate).Footnote 56 Following the 2013 coup, the Islamistsecular divide became more deeply entrenched as the primary fault line in Egyptian politics, and it is therefore the political dimension on which we assessed network diversity.Footnote 57
It is possible to estimate the political orientation of Twitter users based on the political elites whom they choose to follow.Footnote 58 Pablo BarberáFootnote 59 argues that the decision to follow a politician or political account on Twitter is a “costly signal” that provides information about a Twitter user’s ideological position. This is grounded in the assumption that Twitter users prefer to follow accounts that share their political orientations because social networks are homophilicFootnote 60 and individuals gravitate toward those with similar leanings. Borrowing from Yosh Halberstam and Brian Knight,Footnote 61 we therefore measured the political orientation of Egyptian Twitter users based on the politicians whom they followed on Twitter.
We compiled a list of all Egyptian political elites on Twitter who had more than ten thousand followers and well-known political affiliations. This yielded a list of eighty-five Egyptian political elites (forty-four secular and forty-one Islamist).Footnote 62 We used the political affiliation (Islamist or secular) of these elites to classify the political orientation of each Twitter user as well as the political orientation of each Twitter user’s non-elite friends.Footnote 63 Users were classified as Islamist if 60 percent or more of the elites they followed were Islamist, secular if 60 percent or more of the elites they followed were secular, and moderate if Islamists and secularists each constituted between 40 and 60 percent of the elites they followed. We chose the 60 percent cutoff point because it appeared to be accurate upon examining the networks of a hundred politically engaged Egyptians on Twitter whose political orientation could be easily determined based on the content of their tweets.Footnote 64 But to ensure that our threshold choice did not bias our analysis, we also tried a series of other percentages—ranging from 55 percent to 85 percent—and found that using these alternatives did not substantively change our results.Footnote 65 Because the elites whom we chose were either secular or Islamist, our definitions of secular, Islamist, and moderate Egyptian Twitter users were mutually exclusive, allowing us to code the political orientation of each user in our sample and each of their non-elite friends. Users who did not follow any political elites were classified as moderate.
Users in completely homogeneous networks followed only Islamist or only secular elites, whereas those in completely diverse networks followed an even proportion of Islamist and secular elites. Elite network diversity can therefore be measured on a zero to one continuous scale, with those in completely homogeneous networks receiving a score of 0 and those in maximally diverse networks receiving a score of 1 as follows:
Elite Network Diversity = 1 – | % Secular Elites – % Islamist Elites |
To measure non-elite network diversity, we first classified the political orientation of each non-elite user whom individuals followed on Twitter. Our first measure of non-elite network diversity is analogous to our measure of elite network diversity:
Non-Elite Network Diversity = 1 – | % Secular Non-Elites – % Islamist Non-Elites |
We also developed a second measure of non-elite network diversity that makes the diversity score higher for users who followed large numbers of moderates, accounting for exposure to secular, Islamist, and moderate users in a network. This measure is also on a zero to one continuous scale:
Non-Elite Network Diversity = (Non-Elite Network Diversity + Moderate Non-Elites)/2
Data
As we describe above, our initial data set consisted of tweets that included either the Arabic word for Egypt or a reference to Egyptian politics, or geolocation metadata indicating that they were sent from Egypt. This initial data set contained 148,361,405 tweets. Of these, 11,141,302 were sent by non-elite Egyptians.Footnote 66 Using our relevance classifier, we determined that 3,050,983 of these tweets were relevant to civil liberties in Egypt. These relevant tweets were produced by 159,619 unique Egyptian Twitter users.
To identify Egyptian Twitter users who were likely to tweet about civil liberties, we next limited this data set to users who had published at least four tweets from March 2014 to April 2015 that were relevant to those liberties. Doing so produced a data set of 9,400 non-elite Egyptian Twitter users. This number is relatively small given the size of our tweet collection because the majority of tweets in the initial data sets were produced by news organizations, verified Twitter accounts, and users who did not appear to be located in Egypt. Further, rather than attempting to capture the full universe of intolerant tweets in the Egyptian Twittersphere, our classifier prioritized precision over recall to ensure that we had accurate data with which to test our hypotheses. Many users deleted their accounts, stopped tweeting, or made their accounts private in the period under study. We also removed users with more than five thousand friends at the time of our initial collection, although this cohort accounted for less than 1 percent of the total data set. To identify bots in our data, we ran all our users through Botometer,Footnote 67 an automated bot-detection tool. The results suggested that fewer than 2 percent of the users in our data had above a 50 percent likelihood of being classified as a bot. We also manually examined a random sample of 500 of the 9,400 accounts searching for common indicators of bot activityFootnote 68 and did not identify any bots.
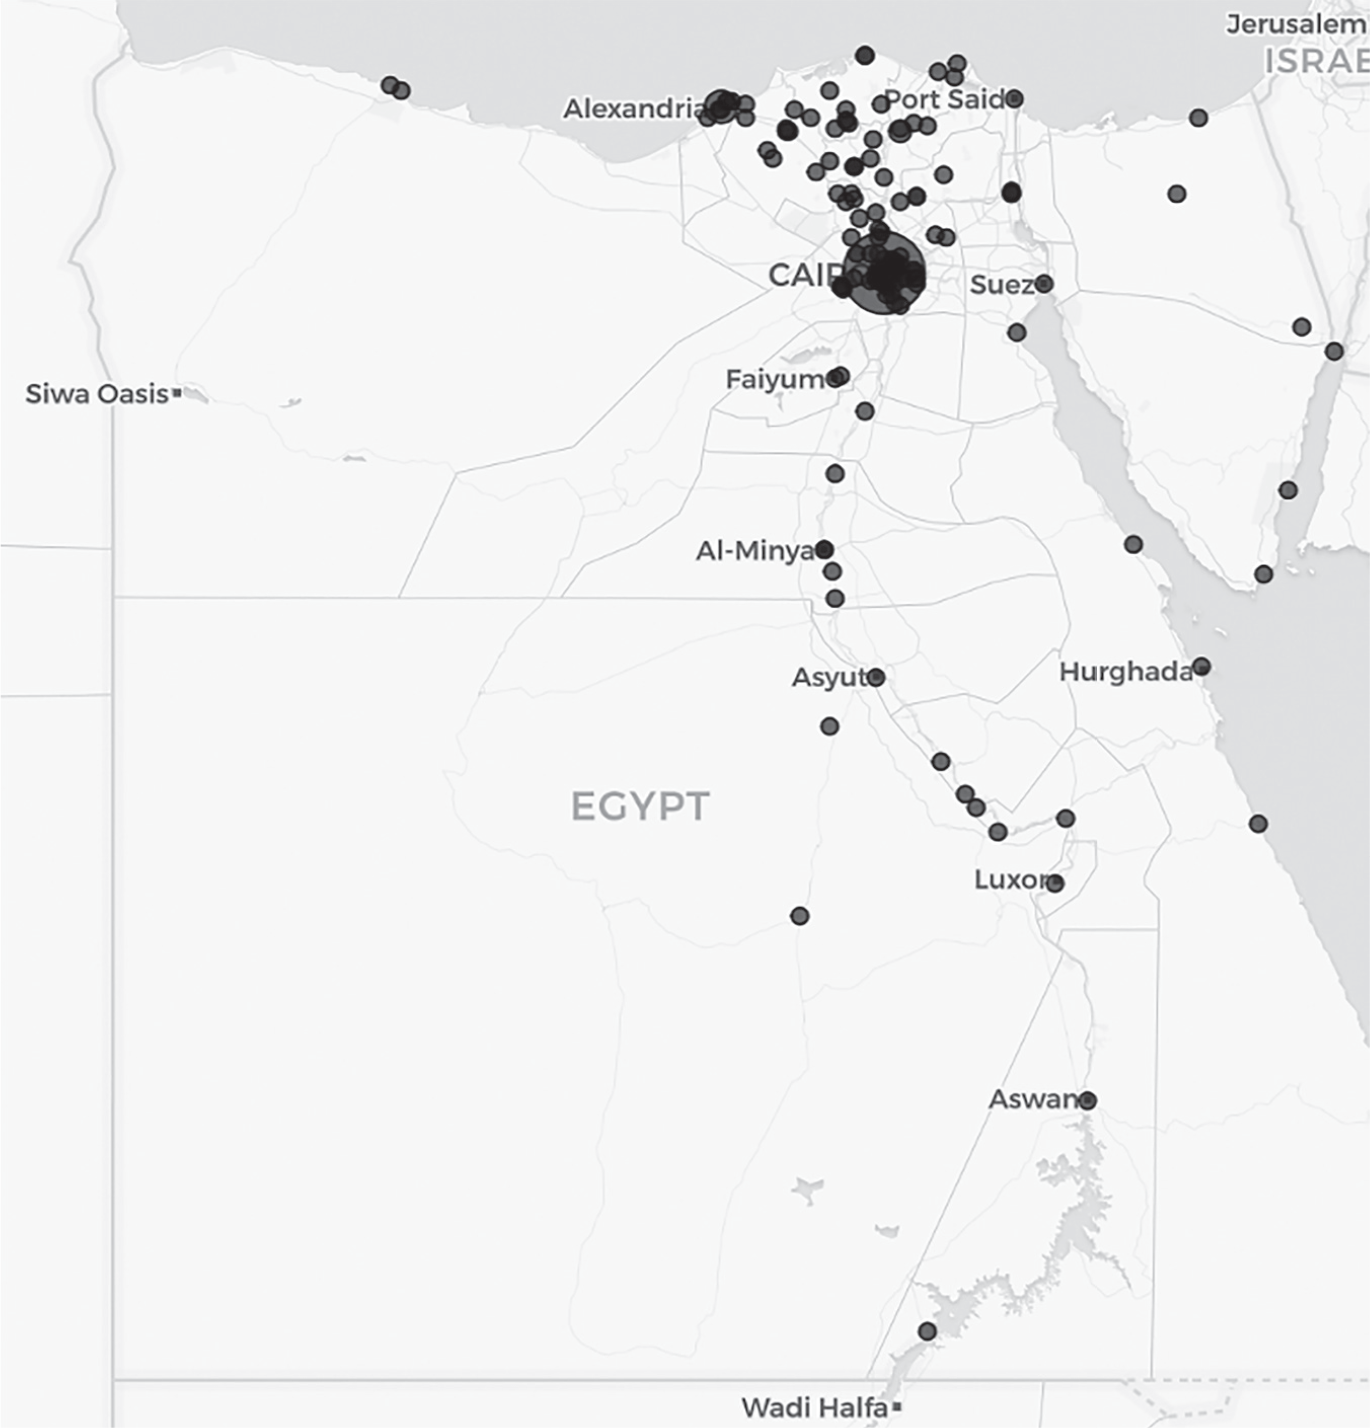
We next collected network data for each of the 9,400 Twitter users every day from April 2015 through October 2016 to classify their political orientation, to measure their network diversity, and to evaluate how their networks changed over time. In October 2016, at the end of the data collection period, we scraped the 3,200 most recent tweets of each of these users.Footnote 69 For most of these users, these tweets covered several years of Twitter activity and could even date back to their earliest tweet. This collection gave us a data set of almost 29 million tweets produced by 9,400 politically engaged Egyptian Twitter users. As Figure 2 demonstrates, the users in our data set were geographically diverse. Although they were concentrated in Cairo, their locations generally mirrored the distribution of the Egyptian population along the Nile.
Geographic Distribution of Twitter Users in Samplea
a Figure shows the locations of geolocated Twitter users in our data set. We have geolocation data for 6,431 of the 9,400 users in our sample.

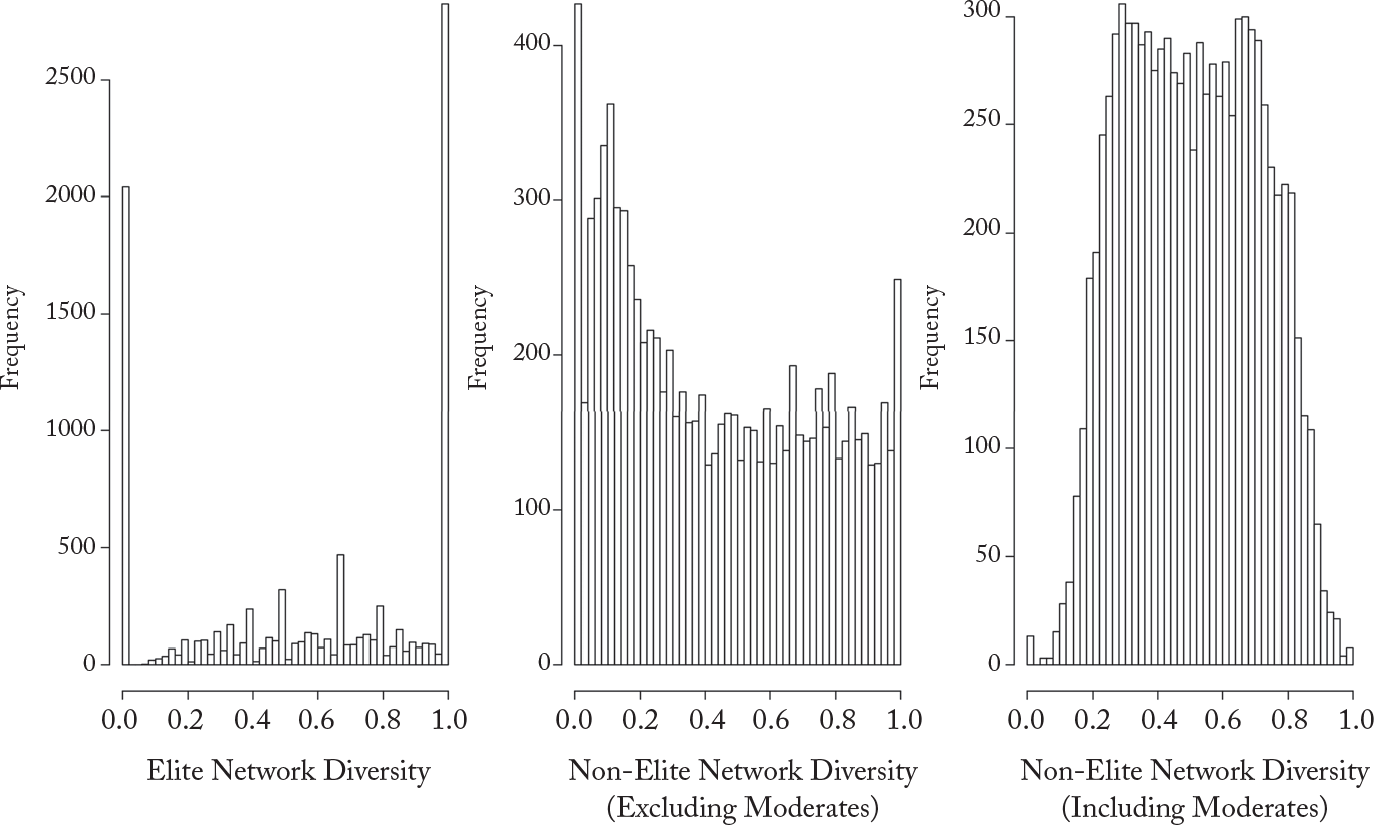
Our data set consists of 1,341 Islamist, 3,748 moderate, and 4,311 secular Egyptian Twitter users. As Table A3 of the supplementary material demonstrates, elite and non-elite network sizes varied dramatically, with users following from zero to sixty-two elites and having from zero to 48,800 non-elite friends.Footnote 70 The number of relevant tweets and the number of intolerant tweets also differed a great deal across users.Footnote 71 Further, as Figure 3 suggests, network diversity varied quite a bit, with concentrations of users in both diverse and homogeneous networks. The large number of users with maximally diverse or maximally homogeneous elite networks was partly driven by the fact that many users followed very few elites, as Table A3 suggests.Footnote 72
Distributions of Twitter Network Diversitya
a Figure shows variation in elite and non-elite network diversity (including and excluding moderates) of the 9,400 Twitter users in our data set.

V. Empirical Strategy and Results
We first assessed whether users in more ideologically diverse networks exhibited lower levels of intolerance relative to users in more homogeneous networks (H1a and H2a). When measuring intolerance as a raw count of intolerant tweets, we used a quasi-Poisson model. QuasiPoisson regression accounts for overdispersion in count data, addressing the fact that many users in our sample rarely tweeted intolerant tweets in the period under study. Although intolerant tweets are a rare outcome,Footnote 73 because thousands of Egyptians produce this rhetoric, a small difference in individual tweet volume represents a meaningful reduction in the volume of intolerant tweets in the Egyptian Twittersphere. When measuring intolerance as a proportion of relevant tweets, we used ols regressions.
Because having a larger political communication network may increase tolerance,Footnote 74 we included elite network size and non-elite network size as control variables measured as log(number of elite friends) and log(number of non-elite friends).Footnote 75 We also included an Islamist dummy variable to account for political orientation.Footnote 76 Additionally, we controlled for the time a user had been on Twitter, measured as log(number of days on Twitter) and—in the count model—included a control for each user’s number of relevant tweets.
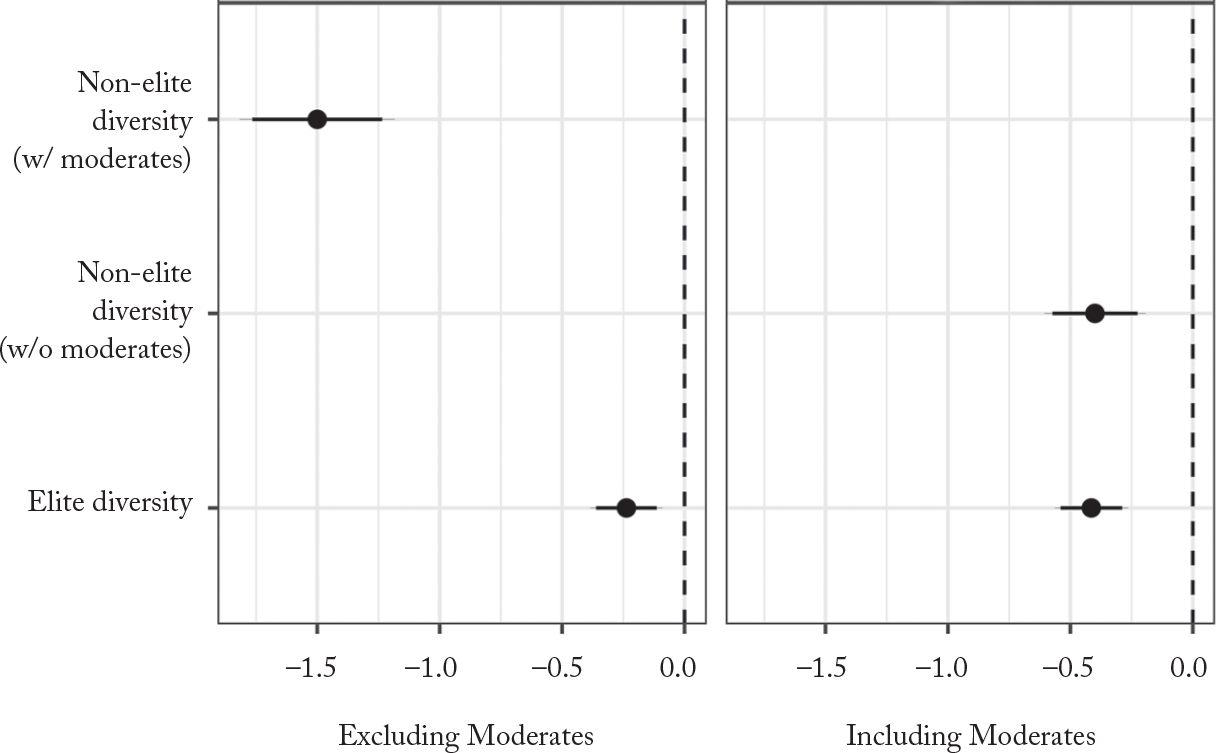
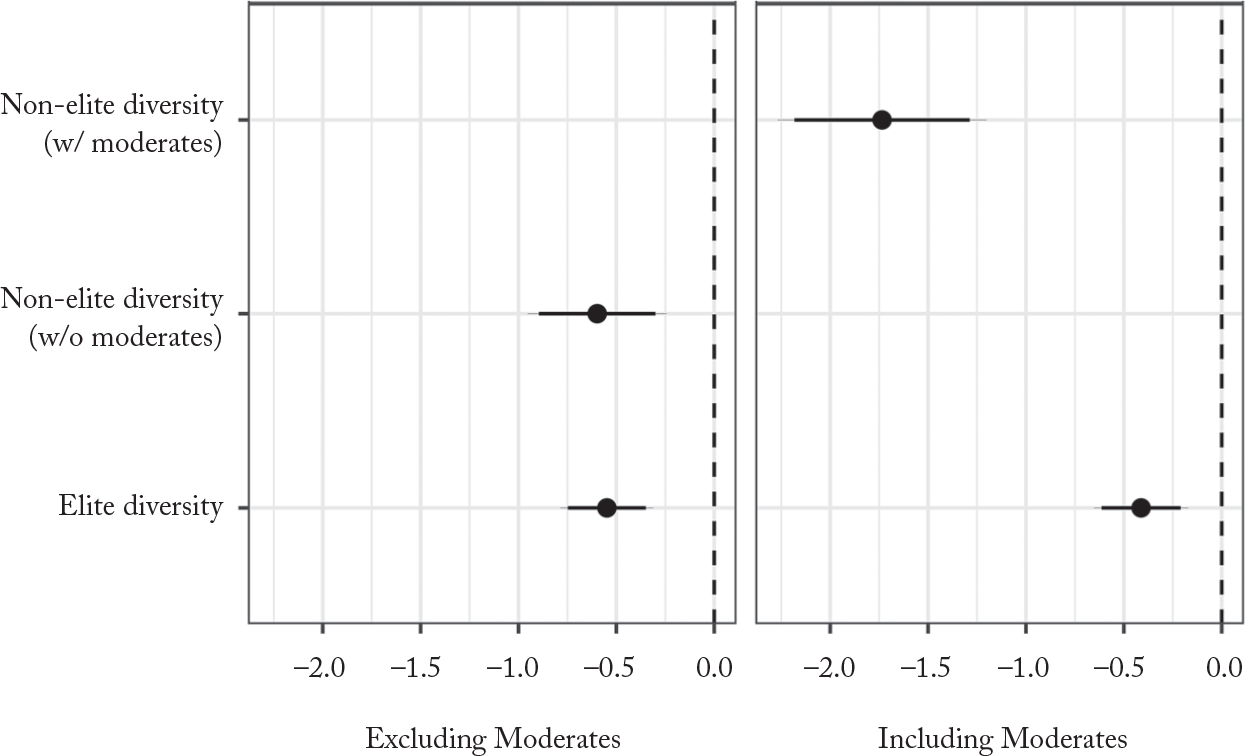
Figure 4 plots the coefficients from our quasi-Poisson model, demonstrating that both elite and non-elite network diversity are associated with statistically significant lower levels of intolerance whether we measure non-elite network diversity including or excluding moderates. Tables B1 and B2 of the supplementary material demonstrate that these results are consistent whether measuring intolerance as a count or as a proportion, with and without controls. Converting the point estimates to exponentiated coefficients to facilitate interpretation, a oneunit increase in elite network diversity from a fully homogeneous to a maximally diverse elite network is associated with a 34 percent decrease in a user’s intolerant tweets. Similarly, a one-unit increase in non-elite network diversity (excluding moderates) is associated with a 33 percent decrease in a user’s intolerant tweets. But when we measure network diversity including moderates, we see a much stronger relationship between non-elite network diversity and intolerance, with a one-unit increase in non-elite network diversity associated with a 78 percent decrease in intolerance. A larger non-elite network is also significantly associated with lower levels of intolerance. By contrast, a larger elite network is associated with a higher level of intolerance. Demonstrating the validity of our intolerance classifier, we see similar results using only the human-coded data with which we created our training data set (Table B3 of the supplementary material).Footnote 77
Network Diversity and Intolerance (Quasi-Poisson Models)a
a Figure displays coefficient plots of quasi-Poisson models demonstrating the association between network diversity (with and without moderates) and users’ intolerant tweet count. The figure reports nonexponentiated coefficients. The models include controls for users’ relevant tweet count, days on Twitter, and political orientation. N = 9,400. The plot shows 95 percent confidence intervals. Full regression tables with and without controls can be found in Appendix B of the supplementary material (Siegel et al. 2021).

Next, we tested hypotheses H1b and H2b, that beyond the general association between network diversity and tolerance, individuals who spend more time in diverse networks will exhibit less intolerance over time. The time series structure of Twitter data gave us temporally granular behavioral measures of both network diversity and tolerance that allowed us to better understand the dynamics of the relationship between them. We measured the association between network diversity and the change in a users’ level of intolerance from t 1 to t 2. To do so, we used lagged dependent variable modelsFootnote 78 to assess the degree to which spending an additional year in a diverse network was associated with a decrease in public expression of intolerance in the next six-month period, relative to the six months preceding t 1. As in the previous models, we included controls for network size, time on Twitter, political orientation, and—in the case of the count models—the number of relevant tweets.
The results of these analyses—whether we apply proportional or count measures of intolerance, including and excluding controls— suggest that spending a year in a more diverse network is associated with a decrease in intolerance, relative to the previous six-month period. Figure 5 plots the coefficients from our quasi-Poisson lagged dependent variable model. Both elite and non-elite network diversity (with and without moderates) are associated with a decrease in a user’s level of intolerance after spending an additional year in a given Twitter network, and the result is statistically significant. Converting the point estimates to exponentiated coefficients for ease of interpretation, we see that spending an additional year in a maximally diverse elite network is associated with a 42 percent decrease in a user’s intolerant tweets in the following six-month period, controlling for prior levels of intolerance. Similarly, spending an additional year in a maximally diverse non-elite network excluding moderates is associated with a 45 percent decrease in a user’s intolerant tweets in the following six-month period, and spending an additional year in a diverse non-elite network including moderates is associated with an 82 percent decrease in intolerant tweets. As in the aggregate analysis, following a larger number of elites is significantly associated with an increase in intolerance.Footnote 79
Network Diversity and Change in Intolerance over Time (Quasi-Poisson Lagged Dependent Variable Models)a
a Figure displays coefficient plots of lagged dependent variable models evaluating the association between network diversity (with and without moderates) and the change in a user’s intolerant tweet count after spending one additional year in a network. The models also include controls for users’ relevant tweet count, days on Twitter, and political orientation. N = 7,843. Users in our sample who did not have relevant tweets before May 2015 and after May 2016 were excluded from the analysis. The plot shows 95 percent confidence intervals. Full regression tables with and without controls and models that control for changes in network diversity can be found in the supplementary material (Siegel et al. 2021).

These results provide support for our descriptive hypotheses. As we argue in our discussion of the hypotheses, we can interpret these results causally if changes in Twitter users’ levels of intolerance over time are not associated with a simultaneous change in the diversity of their networks and we assume that users’ decisions to select into a diverse or homogeneous network at t 1 are independent of their likelihood of bidirectionally changing the frequency with which they tweet intolerant rhetoric a year later at t 2, such that those in more diverse networks express less intolerance and those in more homogeneous networks express more.
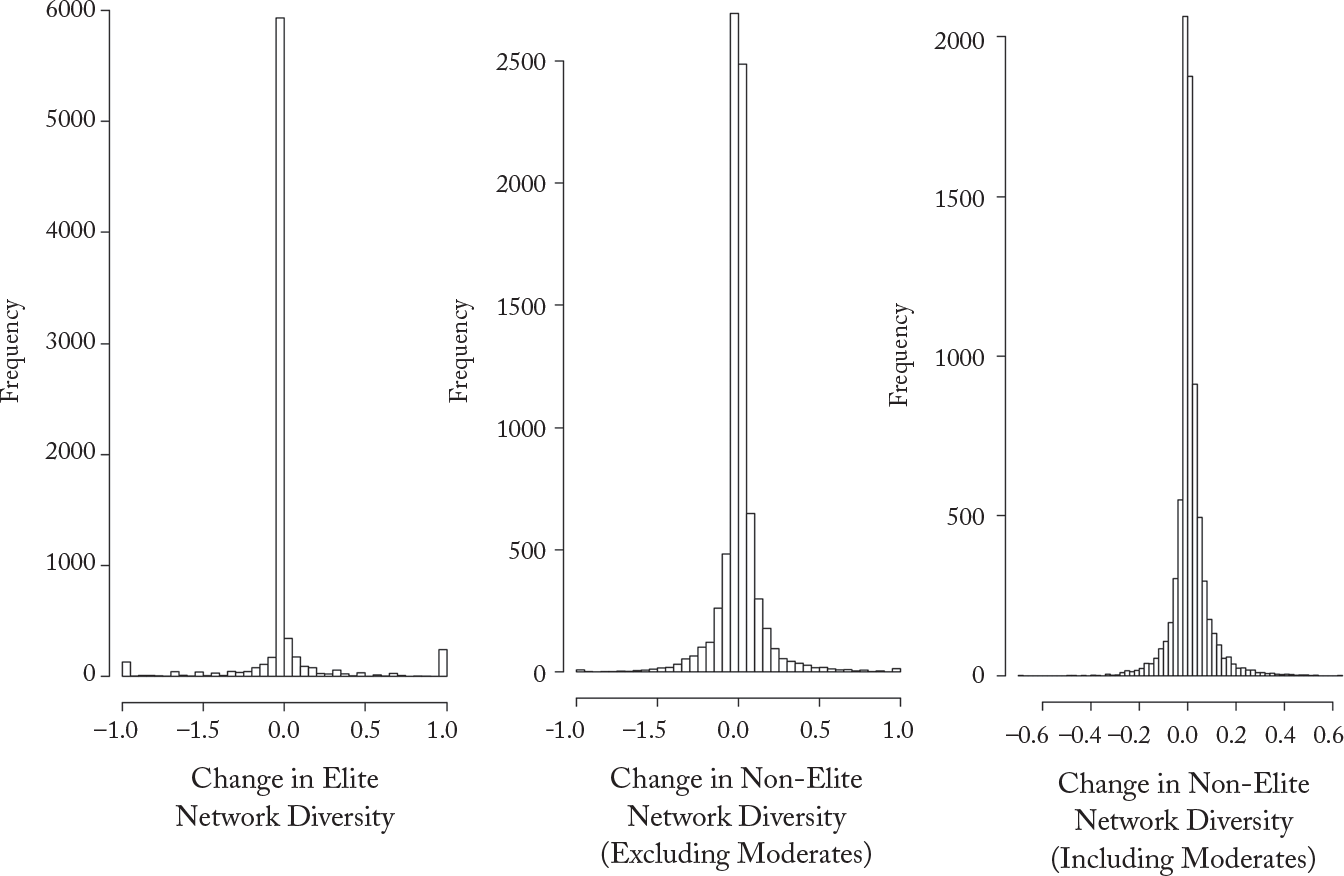
The histograms in Figure 6 plot the distribution of users’ changes in network diversity from May 2015 to May 2016, demonstrating that changes in both elite and non-elite network diversity are clustered around zero. Furthermore, the degree to which users in our sample changed the composition of their elite and non-elite networks over the course of our study is not significantly associated with a change in their intolerance levels after spending an additional year on Twitter. This result suggests that our first assumption is valid—the decision to select into a particular network initially is not associated with the likelihood of tolerance changing over the subsequent year.
Change in Network Diversitya
a Figure shows the change in elite and non-elite network diversity (with and without moderates) from May 2015 to May 2016. Most users had minimal change in network diversity in this period, with most of the data clustered around zero.

Of course, we could not randomly assign individuals to initially select into particular networks, which would meet the gold standard for interpreting our results causally. But we could control for cross-sectional variation of initial selection into diverse or homogeneous networks. We reestimated our conditional change models using a fixed effect to mark users in diverse (network diversity greater than 0.5) and non-diverse (network diversity less than 0.5) networks. The results of this analysis are reported in Table B10 of the supplementary material and are consistent with our findings reported in Figure 5, although the effect sizes are of course much smaller, as they only represent differences among users in diverse (or homogeneous) networks.
Again, without random assignment we cannot rule out the possibility that our findings are biased by omitted variables. We therefore also explored the sensitivity of our results to the inclusion of an omitted variable exogenous to and correlated with both network diversity and a change in intolerance. Sensitivity analysis allows us to assess how strong unobserved confounders would need to be to change our results. The results of this sensitivity analysis, explained in detail in Appendix C of the supplementary material, suggest that it is unlikely that our results are being driven by omitted-variable bias. The effect of elite network diversity and non-elite network diversity on the change in intolerance over time is robust to confounding variables between one and three times as strong as any of the covariates observed in our models. Taken together, we interpret our results as providing support for our descriptive hypotheses and as suggestive evidence that network diversity may cause a reduction in the public expression of intolerance over time.
VI. Discussion and Conclusions
Our findings indicate that individuals in more diverse political communication networks—particularly those that include moderate peers— express lower levels of intolerance toward outgroups than those in homogeneous networks and that the amount of intolerant rhetoric they express decreases after spending more time in the network. By contrast, the amount of intolerance expressed by those in homogeneous networks increases over time. Further, individuals rarely changed the ideological diversity of their networks over the time period under study. Thus, as we assume that the decision to initially select into a given network is independent of a bidirectional change in the expressed level of tolerance in the future—such that those in diverse networks express less intolerance and those in homogeneous networks express more—we interpret our results as providing suggestive evidence that greater exposure to network diversity decreases intolerance over time.
What do our results tell us about the mechanisms by which network diversity might affect tolerance over time? As we outlined above, a diverse elite network may expose individuals to a wider range of viewpoints from well-known, influential political actors. Similarly, spending time in a diverse non-elite network exposes individuals to a wider range of political viewpoints from their peers. As noted previously, decades of social science literature suggest that exposure to members of an outgroup can create greater awareness of the rationale for opposing views.Footnote 80 Thus, the associations we observe could be driven by attitude changes from repeated exposure to new information over time.
But spending time in a diverse peer network that contains moderates may influence tolerance over time through a second mechanism: social norms. Recent research suggests that the norms of online communities heavily influence the individuals who belong to them. Experimental evidence demonstrates that being sanctioned by a peer for uncivil or intolerant behavior or being called out for expressing a particular political view can cause individuals to express less extreme and less intolerant rhetoric online.Footnote 81 Moreover, individuals in networks where intolerant language is less common are even more affected by social sanctions from peers, who set the bounds of what behavior is acceptable or not within a network.Footnote 82 Our finding that diverse networks—particularly those with greater numbers of moderate peers—contain less intolerant speech than more homogeneous networks suggests that using intolerant discourse in these settings may violate their norms. As individuals spend more time in a network where intolerant language is uncommon or is sanctioned by other users, they may reduce their expression of this rhetoric over time.
By exploiting Twitter’s architecture to develop a much more detailed measure of elite and non-elite political communication networks than traditional survey methods allow and by describing the relationship between network diversity and tolerance both in the aggregate and over time, this article provides a key contribution to the tolerance and elite cues literatures. Additionally, our analysis offers insight into the potential short- and long-term effects of online social networks on political attitudes and behavior, a topic of great interest in political communication research.
In the vast majority of tolerance studies to date, social scientists have been seriously limited in their ability to comprehensively map and characterize people’s networks.Footnote 83 The challenge of accurately measuring political communication networks has forced researchers to either rely on self-reported descriptions of individuals’ networks or to painstakingly develop detailed pictures of such networks (through anthropological participant observation, for example), which can only be compiled for a small number of people.Footnote 84 This article, by contrast, demonstrates the tremendous potential of social media data to thoroughly characterize the elite and non-elite political communication networks of large numbers of people in diverse contexts.
Similarly, this article elucidates the opportunity that machine- learning text-analysis techniques afford for using social media data to study shifting behavior over time. By using a relatively small amount of human-coded data to train a classifier, we were able to analyze more than 29 million tweets produced by 9,400 politically engaged Egyptians over two years. Obtaining these types of repeated longitudinal measures of intolerance and networks over time would be impossible using more traditional data sources, particularly in nondemocratic polities.
But before generalizing the findings in this analysis beyond postcoup Egypt, we must consider three caveats. First, this study was conducted using Twitter data because those data are publicly available and allow us to measure the behavior of elites and everyday citizens on the same platform. Twitter users tended to be younger and more politically engaged than users of other social media platforms in Egypt in this period. Moreover, our analysis is further constrained to individuals who regularly talked about politics on Twitter (that is, those who either were geolocated in Egypt or tweeted about Egyptian politics in Arabic and who published at least four tweets relevant to civil liberties from March 2014 to April 2015). Additionally, these individuals did not delete their accounts, have their accounts suspended, or stop tweeting over the course of the study. This means that our analysis is also limited to active Twitter users and likely excludes extremist users whose accounts may have been suspended during the period under study. Although this population is in no way representative of Egyptians or even of Egyptian social media users, we believe it is a reasonable proxy for politically engaged Egyptian Twitter users.
Second, the depth of ideological polarization in postcoup Egypt, exacerbated by the exclusion of Islamists from almost all formal political channels, is extreme. But in other parts of the Arab world, including Jordan, Morocco, and Tunisia, the Islamist-secular divide has also deepened, and we might expect to find similar results.Footnote 85 Recent work suggests that polarization and ideological animosity have increased in established democracies, developing democracies, and authoritarian contexts alike over the past decade,Footnote 86 perhaps making postcoup Egypt less of an outlier.
Third, our real-world observational data does not enable us to randomly assign individuals to networks to make robust causal inferences. Although our sensitivity analysis suggests that our results are robust to the presence of large confounders in the data, more experimental research is needed to precisely estimate the causal effects of network diversity on tolerance in diverse contexts.
Although evaluating the relationship between network diversity and intolerance in the online sphere may not appear to have immediate consequences on the ground, a growing body of literature suggests that online activity reveals important information about offline attitudes and behavior. Notably, in their study of ideological homophily and segregation on Twitter, Halberstam and KnightFootnote 87 find that the degree of ideological segregation in Twitter networks is similar to that in networks of face-to-face interactions with friends and coworkers. This suggests that the effects we observe in the online sphere could be occurring offline as well. The connections between online and offline behavior also deserve further study.
Given that the “Twitter revolutions” failed to bring democratic change and that virulent Islamist-secular polarization continues to threaten Egypt’s stability, understanding the structure of political communication among elites and engaged citizens has become particularly pertinent. The results of this article indicate that the online social networks that Egyptian Twitter users cultivate may shape their level of intolerance— or at least their propensity to use intolerant rhetoric—over time. More substantively, they suggest that online social network structures may influence political attitudes and behavior. We hope future research will continue to examine the dynamics of online network diversity and political tolerance in other contexts, paying particular attention to how the patterns we observe in postcoup Egypt might differ in less sharply polarized contexts or other regime types.
Supplemenary Material
Supplementary material for this article can be found at https://doi.org/10.1017/S0043887120000295.
Data
Replication files for this article can be found at https://doi.org/10.7910/DVN/KOIKBJ.
Acknowledgments
Alexandra Siegel developed the initial idea, collected the data, conducted the statistical analyses, and wrote the original draft of the manuscript. All the coauthors contributed to the research design and editing the manuscript. We thank Duncan Penfold-Brown, Jonathan Ronen, and Yvan Scher for programming support.
Funding
We gratefully acknowledge financial support from New York University’s Center for Social Media and Politics, the INSPIRE program of the National Science Foundation (Award SES-1248077); the NYU Global Institute for Advanced Study, and the NYU Faculty of Arts and Sciences Research Investment Fund.
Authors
Alexandra A. Siegel is an assistant professor of political science at the University of Colorado Boulder. Her research interests include comparative political behavior, Middle East politics, social media and politics, networks, and text as data. She can be reached at alexandra.siegel@colorado.edu.
Jonathan Nagler is a professor of politics at New York University. His research interests include campaigns and elections, political behavior, econometrics, and social media and politics. He is a coauthor, with Jan E. Leighley, of Who Votes Now? Demographics, Issues, Inequality, and Turnout in the United States (2014). He can be reached at jonathan.nagler@nyu.edu.
Richard Bonneau is a professor of biology and computer science at New York University. His research interests include systems biology and protein modeling, and social media and politics. He can be reached at richard.bonneau@nyu.edu.
Joshua A. Tucker is a professor of politics at New York University. His research interests include exploring the effects of social media on political participation and politics, as well as developing methods for using social media data to study politics in new ways. He is a coauthor, with Grigore Pop-Eleches, of Communism’s Shadow: Historical Legacies and Contemporary Political Attitudes (2017), and the author of Regional Economic Voting: Russia, Poland, Hungary, Slovakia, and the Czech Republic, 1990–1999 (2006). He can be reached at joshua.tucker@nyu.edu.