




No CrossRef data available.
Article contents
Cost induced by viral particles manipulating superparasitism behaviour in the parasitoid Leptopilina boulardi
Published online by Cambridge University Press: 18 April 2005
Abstract
Vertically transmitted symbionts can be maintained in a host population only if they do not reduce host fitness, unless they compensate by manipulation of their host's reproduction or have alternative mode of transmission. In Leptopilina boulardi, a parasitoid of Drosophila larvae, some females are infected by viral particles showing both maternal and horizontal transmission. Horizontal transmission occurs when larvae from infected and uninfected individuals of L. boulardi compete in the same host. This situation is facilitated by the increasing tendency to accept already parasitized hosts that viral infection induces in L. boulardi females. Estimation of the adaptive significance of this behavioural modification requires measuring the effect of viral presence on other parasitoid physiological features. Here, we show that viral infection in females imposes no cost on adult survival, a low cost on developmental rate and tibia length, and leads to a strong reduction of locomotor activity. Surprisingly, infected females show higher egg load which could be accounted for by a redirection of energy allocation to egg production. The high intensity of superparasitism in infected females induced a dramatic decrease in pre-imaginal survival of the parasitoid's offspring, representing a potential indirect cost of infection. Low overall pathogeny induced by viral particles appears to be well suited to both transmission modes, both of them requiring females ability to locate and (super)parasitize hosts.
Keywords
Information
- Type
- Research Article
- Information
- Copyright
- 2005 Cambridge University Press
INTRODUCTION
We recently reported that viral particles capable of infecting females of the solitary Drosophila parasitoid wasp Leptopilina boulardi are responsible for induction of superparasitism behaviour, which drives female wasps to accept to oviposit in a host previously infested by the same individual or by a conspecific (Varaldi et al. 2003). These viral particles (LbFV, for L. boulardi Filamentous Virus) seem to multiply in the oviducts of the parasitoid and to be injected together with the egg into the host larva, where they are vertically transmitted. At that time, the precise mode of vertical transmission is not known, either the particules reinfect parasitoid embryo at each generations or they show a transovarian transmission through the egg cytoplasm (or both). By engaging in superparasitism, infected females expose their offspring to harsh within-host larval competition that only one individual survives. It has been shown (Varaldi et al. 2003) that when the within-host struggle brings together infected and uninfected larvae, particles can be horizontally transmitted from infected larvae to uninfected ones, which then can develop into infected adults. In this system, the opportunities that viruses have to obtain new hosts consist of a mixture of vertical and horizontal transmission, which are mutually exclusive, since horizontal transmission of particles from infected to uninfected larvae implies the defeat and death of the former.
Theory on the evolution of virulence predicts that vertically transmitted parasites can only be maintained if they inflict low costs to their hosts (Ebert & Herre, 1996). Some maternally transmitted symbionts, such as Wolbachia, are known to sometimes inflict significant physiological costs to their host (Fleury et al. 2000a), which they compensate by manipulating host reproduction to their own advantage (O'Neill, Hoffmann & Werren, 1997; Vavre et al. 2000). Parasite-induced cost can also be counter-balanced if there is an alternative horizontal transmission, which is predicted to increase parasite virulence because it makes host's and parasite's reproduction independent (Ebert & Herre, 1996). This hypothesis has found significant support (Bull, Molineux & Rice, 1991; Herre, 1993; Messenger, Molineux & Bull, 1999). For some parasites with a mixed mode of transmission, horizontal transmission is even dependent on host death (Bull et al. 1991; Koella & Agnew, 1999).
From this viewpoint, the L. boulardi/virus system is somewhat particular. The overall invasiveness of the particles depends on a set of complex conditions. First, the ability of females to produce eggs, find and infest hosts, should not be reduced by infection, since viral propagation depends on the number of host larvae that infected wasps parasitize. Thus, evaluating consequences and costs of viral infection on L. boulardi adults is of obvious importance to understand and to predict the dynamics of the particles in natural populations. Furthermore, in the case of high competition for hosts, superparasitism can also be advantageous for the wasp, depending on the probability of winning within host competition (Van Alphen & Visser, 1990). Evaluation of the consequences of infection on other physiological parameters can help us to define the overall payoff from viral infection and thus better understand the evolutionary status of the association.
Apart from promoting the horizontal transmission of viruses within the host population, acceptance of superparasitism may also have indirect effects on the fitness of the wasp. By re-infesting a host already parasitized, possibly by herself, the wasp wastes eggs, and moreover exposes her offspring to harsh competition during early larval development, from which even the winner may suffer a cost that has been so far poorly documented (Visser et al. 1992a).
We present here an attempt to evaluate the overall cost that L. boulardi suffers from viral infection, considering both the direct cost of being infected, and the indirect cost resulting from superparasitism, which infected females are inclined to accept. We found that viral infection inflicts a low direct cost on most features of adults, except on locomotor activity of females, but has an unexpected positive effect on egg load, which could be accounted for by a redirection of energy allocation to egg production. Uninfected females can accept moderate superparasitism when hosts are scarce, which has little effect on the development and the adult features of their offspring. In contrast, viral infection induces intense superparasitism that results in severe mortality among both the developing parasitoids and their Drosophila hosts. The indirect cost of viral infection through superparasitism appears to be much greater than the direct cost of infection.
MATERIALS AND METHODS
Strains
Effects of superparasitism and viral infection on fitness of L. boulardi were investigated by comparing lines differing only in their infection status: an uninfected line (NS for non-superparasitizing) originating from Sienna (Italy) and made homozygous by 8 generations of sib-mating (more than 82% of homozygous loci), compared to an infected line (S for superparasitizing), derived from the former and artificially infected by injection of viral particles. This newly infected line expresses the superparasitism phenotype and has proved stable over generations (Varaldi et al. manuscript in preparation). This allows comparison of infected and uninfected individuals with exactly the same nuclear background. Experiments on locomotor activity and survival were performed on two other lines, originating from Sienna, either infected (S) or not (NS), also sharing the same nuclear background, but obtained in a different way. Briefly, the non-superparasitizing NS uninfected line was obtained by repeatedly crossing NS females with S males during 5 generations of back crosses. The fact that the introgressed line conserved NS phenotype illustrates the maternal transmission of the trait (mean number of eggs per para sitized host±S.D., introgressed line=1·00±0·00, n=15, infected line=3·23±0·33, n=14, P<0·0001).
Rearing and experiments were performed on Drosophila melanogaster fed with standard diet (David, 1962) at 26 °C, 70% RH, L.D. 12[ratio ]12. In the experiment [Lt ]manipulation of superparasitism intensity[Gt ], females were isolated at emergence and put with a male to ensure their fertilization.
Manipulation of the intensity of superparasitism
One, three, six or ten 3- to 5-day old L. boulardi females were isolated for 24 h with a group of first instar Drosophila larvae hatched from 100 eggs, foraging on 15 g of standard diet (David, 1962). For each wasp density, 15 replicates with infected females and 15 with uninfected ones were performed. Ten control replicates were kept without L. boulardi to quantify the spontaneous mortality of Drosophila larvae in the absence of parasitoids.
Three days after being parasitized, 5 third instar Drosophila larvae were dissected in each replicate to determine the number of parasitoid they harboured. This allowed estimation of the distribution of infestations among Drosophila larvae, and quantification of the occurrence and intensity of superparasitism.
After development, emerging adult Drosophila and wasps were collected every day, sexed and counted to estimate 3 parameters in each replicate. (1) Death by parasitism (DP) is the number of Drosophila killed by wasps, estimated by the difference between mean numbers of flies emerged from controls (without L. boulardi) and from experimental replicates (with L. boulardi). The pre-imaginal survival (PS) is the ratio of emerging wasps to parasitized hosts as estimated by DP. This parameter estimates the larval survivorship of the wasp. (2) The development duration of sexes. (3) The sex ratio (SR) measured as the percentage of females among adult offspring.
For each wasp density and for the two infection statuses, the following parameters were measured on emerging adult females.
Superparasitism behaviour
As described by Varaldi et al. (2003), a 1 or 2-day-old virgin female was isolated with 10 first instar Drosophila larvae, between 5 pm and 10 am, in a Petri dish with agar and a yeast layer. Then 24–48 h later, 3 Drosophila larvae were dissected to count the number of parasitoid eggs they harboured. Superparasitism behaviour of each female was then estimated as the mean number of parasitoids per Drosophila larva (excluding unparasitized Drosophila larvae). Superparasitism behaviour was estimated on 8–11 females in each combination.
Tibia length
Newly emerged wasps were killed and their hind left tibia was gently pulled out and placed on a glass slide under light microscope. In total, 15–25 females were measured in each combination.
Egg load
Since L. boulardi is proovigenic (no egg production occurs at the adult stage), egg load at emergence gives a good estimation of the reproductive potential of females. Newly emerged females (<24 h), kept without host since their emergence, were killed and dissected in a drop of physiological saline. One ovary was transferred into disodic eosin (1%) and eggs were carefully scattered between slide and cover-glass. Coloured eggs were counted under the microscope with the help of a video system. Egg load (1 ovary) was estimated on 12–19 females in each combination. Previous experiments showed that both ovaries contained approximatively the same number of eggs and that overall fecundity could be estimated as twice of the number of eggs in one ovary.
Locomotor activity and survival of adults
Measurements were achieved on individuals emerged from low densities rearing tubes (1 female with 100 hosts), to ensure that superparasitism was absent in the NS line, and kept at the lowest in S line. Individual locomotor activity and rhythm were monitored using an automatic video-tracking and image analysis system which allows continuous individual measurement of 120 insects over several days (Allemand et al. 1994; Fleury et al. 2000b). Individuals were isolated in circular glass arenas (diameter=1·5 cm) without hosts but with honey as food. Females were 3 to 4 days old and males were 4 to 5 days old. The locomotor activity of each individual was quantified every 3 min by binary data (1 if wasp has moved during a 2-sec video recording and 0 if not). Hourly activity was calculated as the proportion of active recordings among the 20 hourly ones. S and NS individuals (30 of each sex) were measured for 2 days under LD 12[ratio ]12 (light from 08.00 am to 08.00 pm). The average rate of locomotor activity (RLA), calculated as the mean daily proportion of active recordings, was calculated for each individual. Profile of the activity rhythm (illustrating the temporal organization of behaviour) will be shown elsewhere (in prep).
After locomotor activity experiments, animals (30 males and 30 females) were kept in their individual circular glass arena (with honey as food) and were checked every day for mortality.
Statistical analysis
RLA, PS, and SR analyses were carried out after arcsine square root transformation. Survival curves were compared using log-rank tests.
RESULTS
Occurrence of superparasitism in the two lines
As expected, intensity of superparasitism was clearly influenced by the number of wasps foraging on the same host patch, and by their infection status: S females readily superparasitized whatever their density (Fig. 1), while ‘NS’ females only did so in cases of host scarcity (3 or more females for 100 hosts). For both lines of wasps, the number of parasite eggs per Drosophila larva increased when female density increased, but infected females always showed a higher level of superparasitism than uninfected ones.

Fig. 1. Estimation of superparasitism intensity during development for each wasp density and each infection status. Cumulative frequency of the number of eggs per host represents the proportion of larvae bearing as many or less parasitoids than indicated on the x axis. Dissections obtained from all replicates were pooled together within each combination. Two-way ANOVA on the mean number of eggs/parasitized host calculated for each replicate indicates a strong effect of wasp density (F(3,91)=25·3, P<0·0001) and of infection status (F(1,91)=25·6, P<0·0001). Note that superparasitism intensity was under-estimated for S females, especially at high densities, because larvae suffered mortality before we collected them, probably because of superparasitism intensity.
Superparasitism intensities by S and NS females overlapped but they showed quite different ranges, which precluded a direct test of the effects of superparasitism and of infection status on the different parameters measured. Thus, we first tested separately in both lines the effect of superparasitism on each trait, using a linear regression. Then, in cases where this effect was not significant in both lines, we compared infected and uninfected lines (by pooling data of the different densities), to evaluate the ‘infection’ effect.
Developmental parameters
In both lines, Drosophila death by parasitism (DP) increased with wasp density (F(3,92)=7·9, P<0·0001), but was not affected by wasp infection status (F(1,92)=0·66, N.S.), indicating that viral infection does not reduce females' ability at finding and attacking hosts.
The moderate superparasitism accepted by uninfected females did not influence the pre-imaginal survival of their offspring (Preimaginal Survival PS, Fig. 2A and Table 1). In contrast, higher superparasitism in the infected line led to a clear decrease of pre-imaginal survival of offspring (Fig. 2A and Table 1), which only occurred for superparasitism intensities (higher than 3 eggs/parasitized host) that uninfected females never achieved. This pattern could have several different explanations (see Discussion section). For lower superparasitism intensities (lower than 3 eggs/host), PS did not differ between strains (F(1,74)=1·18, N.S.).

Fig. 2. Effect of development under superparasitism conditions on pre-imaginal and adult features of S and NS lines. (A) Pre-imaginal survival (PS), (B) developmental duration of males, (C) developmental duration of females, (D) superparasitism behaviour of the emerging females, (E) tibia length of emerging females and (F) egg load of emerging females. Superparasitism intensity is measured as the mean number of eggs/parasitized host. Data are grouped by wasp density (1,3,6,10) and are ranked as expected from left to right. Bars indicate S.E.
Table 1. Statistical tests of the effect of superparasitism development and of infection (Dissection data were pooled together within each wasp density, because of the low number of dissections per replicate. Superparasitism intensity was then estimated as the mean number of eggs/parasitized host. The effect ‘Development under superparasitism’ was first tested using linear regression. Infection effect was only tested when regressions were non-significant for both lines.)

In both lines, developmental time of males and females appeared to be independent of the superparasitism intensity they experienced as larvae (Fig. 2B, C and Table 1). However, infected individuals of both sexes developed more slowly (+3% of development time) than uninfected ones.
Offspring sex ratio, an important feature for this maternally transmitted virus, was not affected by infection status nor by the intensity of superparasitism (% females±S.E.=0·67±0·01, Table 1). This result was unexpected since in haplo-diploid species, response to local mate competition (Hamilton, 1967) usually allows females to adjust their offspring sex-ratio to the presence of competitors (female biased when alone, and more balanced when competition rises). However, adjustment of primary sex-ratio and differential larval mortality between sexes could cancel each other, as observed in another parasitoid species (Van Baaren et al. 1999).
Adult parameters
Upon emergence of females, we measured superparasitism behaviour (1 female on 10 Drosophila larvae), tibia length and egg load. Superparasitism behaviour appeared clearly to be dependent on infection status: S females superparasitized, whereas NS did not (Fig. 2D). Furthermore, the increasing superparasitism suffered by developing NS larvae did not induce superparasitism behaviour in emerging females, demonstrating that no maternal effect could induce such behaviour (Fig. 2D). However, a slight tendency was observed for S females to more readily accept superparasitism after development under heavy superparasitism (Fig. 2D and Table 1, P=0·06). For tibia length and egg load, no effect of superparasitism intensity was observed in either line (Fig. 2E, F and Table 1), but infection status had significant and opposite effects on both traits: infected females had shorter tibia (−2%) and higher egg loads (+11%). This positive effect of infection was quite unexpected, and we then decided to measure these two traits on the same animals, to evaluate the correlation between them. We thus measured these two parameters on wasps emerged from replicates with wasp densities of 3, 6 and 10. On this data set, again no effect of superparasitism was detected on tibia length (infected: F(1,58)=0·74, N.S.; uninfected: F(1,67)=3·59, N.S.), nor on egg load (infected: F(1,56)=1·58, N.S.; uninfected: F(1,61)=0·0003, N.S.). Plots of individual egg-load against tibia length within each line revealed that the two features are correlated, but this correlation is also affected by infection states. For a given tibia length, infected females had higher egg loads than uninfected ones (Fig. 3).

Fig. 3. Relation between egg load and tibia length. Results of the ANCOVA are shown on the graph. **P<0·001.
Locomotor activity and adult survival
NS and S males had the same overall locomotor activity (mean±S.E., uninfected: 0·33±0·05, infected: 0·33±0·05, F(1,52)=0·95, N.S.), whereas activity of infected S females (0·15±0·025) was reduced by 46% compared to uninfected NS ones (0·28±0·043; F(1,46)=5·78, P=0·02). Survival duration showed the opposite pattern: NS males lived longer than S ones (Fig. 4A, log-rank test, χ2=5·78, 1 D.F., P=0·01), whereas no significant difference was detected in females (Fig. 4B, log-rank test, χ2=0·44, 1 D.F., P=0·5). To date, male infection has never been investigated and this cost constitutes the first argument for the presence of the virus in males.

Fig. 4. Survival curves of infected (S, solid lines) and uninfected (NS, broken line) males (A) and females (B).
DISCUSSION
Before discussing costs and benefits of infection, it is worth noting that females of the non-superparasitizing line (Varaldi et al. 2003) proved able to superparasitize when competition levels increased (high parasitoid density). This is in full agreement with current theory on the adaptive significance of superparasitism, which predicts that when foraging alone, females should never superparasitize, whereas when foraging in groups, they should do so (Visser, Van Alphen & Hemerik, 1992b; Visser, 1995). Superparasitism behaviour thus appears to be a component of L. boulardi females' own repertoire, which viral particles exaggerate, thereby increasing their chances of horizontal transmission. This modulation can lead to potential conflicts of interest, depending on the degree of competition for Drosophila hosts among parasitoids (Bronstein, 1994).
The possible adaptive value of superparasitism depends strongly on the fitness consequences that surviving adults may suffer from having developed under superparasitism. Uninfected L. boulardi females only accept weak superparasitism (average 2·7, max 7 eggs/infested hosts) when thickly grouped (10 females/100 hosts for 24 h), and this low level has no significant negative effect on the fitness of emerging offspring. This result is consistent with those of Visser et al. (1992a) on the related species L. heterotoma. The adaptive significance of the tendency to superparasitise thus mainly depends on the probability of winning competition within the host, which remains to be evaluated (but see Visser et al. 1992; Field, Keller & Calbert, 1997).
At the same female/host ratio, infected females superparasitize far more heavily (average 3·8, max 16 eggs/host), and this results in a strong decrease in the developmental success of their offspring (=larval survival probability), which drops from 0·82 to 0·31. Since uninfected females never engaged in this intensity of superparasitism, we cannot determine whether this preimaginal mortality is due to superparasitism itself, and to the corresponding high numbers of eggs and excess amounts of associated products, excluding LbFV, that host larvae receive (Dupas et al. 1996; Labrosse et al. 2003), or to LbFV infection. It is likely that a constant amount of viral particles is injected into the larvae together with each parasitoid egg, and can perhaps reach quantities that kill superparasitized Drosophila larvae and developing parasitoids. Such lethal viral quantities could also be achieved through replication within host larvae. Regulation of viral replication by the parasitoid embryo has been proposed for an ascovirus carried by a parasitoid and transmitted to the next generation through injection together with the egg into the host (Bigot et al. 1997; Whitfield & Asgari, 2003). These authors showed that when the same ascovirus is associated within the lepidopteran host with another parasitoid that ususally does not carry it, rapid virus amplification in the host prevents the development of parasitoid larvae. This hypothesis that the amount of viral particles within the host increases with the intensity of superparasitism during development is further supported by the observation that S females superparasitize more readily after development within a superparasitized host.
Clearly, viral infection of L. boulardi can lead females to engage in a behaviour that is totally maladaptive for both wasps and viral particles, namely laying so many eggs in a host that none can develop. In our experiments, such deviant behaviour occurred at higher wasp densities (6 and 10 for 100 host larvae), but the actual lethal threshold of superparasitism is not known, since when we dissected 3rd instar larvae to count their parasitoids, it was clear that heavy superparasitism had already killed some larvae (in some cases it was difficult to find 5 larvae alive), and that we had thus underestimated its intensity. This result suggests that a high prevalence of such viral infection in wasp populations can profoundly affect the dynamics of host parasitoid association, especially in the case of strong competition for hosts, which appears to be common in L. boulardi/Drosophila natural communities (dozens of females are often found on the same fruit colonized by Drosophila; personal observation, Fleury et al. 2004).
Virulence of LbFV, defined as the reduction of host fitness due to infection, consists of the indirect negative effect due to behavioural change (apart from situations where superparasitism is advantageous, sensuVan Alphen & Visser, 1990), and in direct negative effects on host physiology. The first component is difficult to assess experimentally, and it will be investigated theoretically elsewhere (Varaldi et al. manuscript in preparation). Here, we show that viral infection has direct negative consequences on several components of the fitness of infected females (locomotor activity, size, developmental duration), no effect on their adult survival, and an unexpected positive effect on egg load.
Parasites are predicted to exploit host fitness traits that are not essential to their own transmission, allowing resource re-allocation to host traits that favor it (Hurd, 2001). For example, the rat tapeworm Hymenolepis diminuta reduces the fecundity of its Tenebrio molitor hosts, and increases their life-span, which seems to favour its own transmission to the definitive host Rattus rattus or R. norvegicus (Hurd, Warr & Polwart, 2001). In the L. boulardi/virus system, host fitness traits that are a priori relevant to viral propagation (egg-load and life-span) appear to be unaffected or even favored by viral infection, at the expense of other fitness components. Indeed, each egg brings to viral particles an opportunity for transmission, be it vertical or horizontal. Furthermore, females accepting superparasitism use their eggs faster, and thus incur higher risks of being egg-limited (Ellers, Sevenster & Driessen, 2000), which would drop viral fitness to zero. This increase in egg load of infected females can then be interpreted as a manipulation of wasp resources by the virus favouring viral horizontal transmission, although alternative explanations (host adaptation or side-effect) cannot be ruled out.
We have now many indications that horizontal transmission is a common transmission mode for these viral particles in the field, which complements its vertical transmission. First, females of this species and other parasitoid species are known to aggregate their infestations in the same host patches (Boulétreau, Chassain & Fouillet, 1991; Driessen & Hemerik, 1991; Wertheim et al. 2000, and unpublished data), thus enhancing opportunities for horizontal transmission (Ebert & Herre, 1996). Second, superparasitism of Drosophila larvae is quite frequent in the field (Fleury et al. 2004; unpublished). Such frequent horizontal transmission is expected to be associated with high virulence (Herre, 1993; Ebert & Herre, 1996; Messenger et al. 1999) which, on the contrary, proves to be rather low in the case that we have studied. It must be recalled that here, horizontal transmission of viruses also depends on the ability of infected females to forage, to locate and infest hosts. A sound approach to the evolution of virulence must thus take into account not only the transmission mode of parasites (horizontal vs vertical), but also all host traits that they use to transmit themselves successfully.
We are grateful to P. Fouillet for locomotor activity measurements, D. MacKey for correction of the English and E. Darrouzet for helpful comments on a previous draft. This work was financially supported by the Centre National de la Recherche Scientifique (UMR CNRS 5558 and GDR 2153) and the French Ministery ‘Education Nationale, de l'Enseignement Supérieur et de la Recherche, Fond National de la Science, ACI Jeunes Chercheurs 2004’.
References
REFERENCES
ALLEMAND, R.,
POMPANON, F.,
FLEURY, F.,
FOUILLET, P. &
BOULÉTREAU, M. (
1994).
Behavioural circadian rhythms measured in real-time by automatic image analysis: application in parasitoid insects.
Physiological Entomology 19,
1–8.CrossRefGoogle Scholar
BOULÉTREAU, M.,
CHASSAIN, C. &
FOUILLET, P. (
1991).
Mutual interference and spatial distribution of infestations in two sympatric Trichogramma species: T. brassicae and T. cacoeciae.
Biologicol Control 1,
176–182.Google Scholar
BIGOT, Y.,
RABOUILLE, A.,
DOURY, G.,
SIZARET, P. Y.,
DELBOST, F.,
HAMELIN, M. H. &
PERIQUET, G. (
1997).
Biological and molecular features of the relationships between Diadromus pulchellus ascovirus, a parasitoid hymenopteran wasp (Diadromus pulchellus) and its lepidopteran host, Acrolepiopsis assectella.
Journal of General Virology 78,
1149–1163.CrossRefGoogle Scholar
BRONSTEIN, J. L. (
1994).
Conditional outcomes in mutualistic interactions.
Trends in Ecology and Evolution 9,
214–217.CrossRefGoogle Scholar
BULL, J. J.,
MOLINEUX, I. J. &
RICE, W. R. (
1991).
Selection for benevolence in a host-parasite system.
Evolution 45,
875–882.CrossRefGoogle Scholar
DAVID, J. (
1962).
A new medium for rearing Drosophila in axenic condition.
Drosophila Information Service 36,
128.Google Scholar
DRIESSEN, G. &
HEMERIK, L. (
1991).
Aggregative responses of parasitoids and parasitism in popultions of Drosophila breeding in fungi.
OIKOS 61,
96–107.CrossRefGoogle Scholar
DUPAS, S.,
BREHELIN, M.,
FREY, F. &
CARTON, Y. (
1996).
Immune suppressive virus like particles in a Drosophila parasitoid: significance of their intraspecific morphological variations.
Parasitology 113,
207–212.CrossRefGoogle Scholar
EBERT, D. &
HERRE, E. A. (
1996).
The evolution of parasitic desease.
Parasitology Today 12,
96–101.CrossRefGoogle Scholar
ELLERS, J.,
SEVENSTER, J. G. &
DRIESSEN, G. (
2000).
Egg load evolution in parasitoids.
The American Naturalist 156,
650–665.CrossRefGoogle Scholar
FIELD, S. A.,
KELLER, M. &
CALBERT, G. (
1997).
The pay-off from superparasitism in the egg parasitoid Trissolcus basalis, in relation to patch defence.
Ecological Entomology 22,
142–149.CrossRefGoogle Scholar
FLEURY, F.,
VAVRE, F.,
RIS, N.,
FOUILLET, P. &
BOULÉTREAU, M. (
2000 a).
Physiological cost induced by the maternally-transmitted endosymbiont Wolbachia in the Drosophila parasitoid, Leptopilina heterotoma.
Parasitology 121,
493–500.Google Scholar
FLEURY, F.,
ALLEMAND, R.,
VAVRE, F.,
FOUILLET, P. &
BOULÉTREAU, M. (
2000 b).
Adaptive significance of a circadian clock: temporal segregation of activities reduces intrinsic competitive inferiority in Drosophila parasitoids,
Proceedings of the Royal Society of London, B 265,
1005–1010.Google Scholar
FLEURY, F.,
RIS, N.,
ALLEMAND, R.,
FOUILLET, P.,
CARTON, Y. &
BOULÉTREAU, M. (
2004).
Ecological and genetic interactions in Drosophila-parasitoids communities: a case study with D. melanogaster, D. simulans and their common Leptopilina parasitoids in south-eastern France.
Genetica 120,
181–194.Google Scholar
HERRE, E. A. (
1993).
Population structure and the evolution of virulence in nematode parasites of fig wasps.
Science 259,
1442–1445.CrossRefGoogle Scholar
HURD, H. (
2001).
Host fecundity reduction: a strategy for damage limitation?
Trends in Parasitology 17,
363–367.Google Scholar
HURD, H.,
WARR, E. &
POLWART, A. (
2001).
A parasite that increases host lifespan.
Proceedings of the Royal Society of London, B 268,
1749–1753.CrossRefGoogle Scholar
KOELLA, J. &
AGNEW, P. (
1999).
A correlated response of a parasite's virulence and life cycle to selection on its host's life cycle.
Journal of Evolutionary Biology 12,
70–79.CrossRefGoogle Scholar
LABROSSE, C.,
CARTON, Y.,
DUBUFFET, A.,
DREZEN, J. M. &
POIRIE, M. (
2003).
Active suppression of D. melanogaster immune response by long gland products of the parasitic wasp Leptopilina boulardi.
Journal of Insect Physiology 49,
513–522.Google Scholar
MESSENGER, S. L.,
MOLINEUX, I. J. &
BULL, J. J. (
1999).
Virulence evolution in a virus obeys a trade-off.
Proceedings of the Royal Society of London, B 266,
397–404.CrossRefGoogle Scholar
O'NEILL, S. L.,
HOFFMANN, A. A. &
WERREN, J. H. (
1997).
Influencial Passengers.
Inherited Microorganisms and Arthropod Reproduction.
Oxford University Press,
New York.
VAN ALPHEN, J. J. M. &
VISSER, M. E. (
1990).
Superparasitism as an adaptive strategy for insect parasitoids.
Annual Revue of Entomology 35,
59–79.CrossRefGoogle Scholar
VAN BAAREN, J.,
LANDRY, B. L. &
BOIVIN, G. (
1999).
Sex allocation and larval competition in a superparasitizing solitary egg parasitoid: competing strategies for an optimal sex ratio.
Functional Ecology 13,
166–171.CrossRefGoogle Scholar
VARALDI, J.,
FOUILLET, P.,
RAVALLEC, M.,
LOPEZ-FERBER, M.,
BOULÉTREAU, M. &
FLEURY, F. (
2003).
Infectious behavior in a parasitoid.
Science 302,
1930. doi:10·1126/science.1088798.Google Scholar
VAVRE, F.,
FLEURY, F.,
VARALDI, J.,
FOUILLET, P. &
BOULÉTREAU, M. (
2000).
Evidence for female mortality in Wolbachia-mediated cytoplasmic incompatibility in haplodiploid insects, epidemiologic and evolutionary consequences.
Evolution 54,
191–200.CrossRefGoogle Scholar
VISSER, M. E. (
1995).
The effect of competition on oviposition decisions for Leptopilina heterotoma (Hymenoptera: Eucoilidae).
Animal Behaviour 49,
1677–1687.CrossRefGoogle Scholar
VISSER, M. E.,
LUYCKX, B.,
NELL, H. W. &
BOSKAMP, J. F. (
1992 a).
Adaptive superparasitism in solitary parasitoids: marking of parasitized hosts in relation to the pay-off from superparsitism.
Ecological Entomology 17,
76–82.Google Scholar
VISSER, M. E.,
VAN ALPHEN, J. J. M. &
HEMERIK, L. (
1992 b).
Adaptive superparasitism and patch time allocation in solitary parasitoids: an ESS model.
Journal of Animal Ecology 61,
93–101.Google Scholar
WERTHEIM, B.,
SEVENSTER, J. G.,
EIJS, I. E. &
VAN ALPHEN, J. J. M. (
2000).
Species diversity in a micophagous insect community: the case of spatial aggregation vs. resource partitioning.
Journal of Animal Ecology 69,
335–351.Google Scholar
WHITFIELD, J. B. &
ASGARI, S. (
2003).
Virus or not? Phylogenetics of polydnaviruses and their wasp carriers.
Journal of Insect Physiology 49,
397–405.CrossRefGoogle Scholar
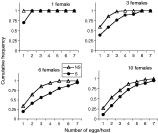
Fig. 1. Estimation of superparasitism intensity during development for each wasp density and each infection status. Cumulative frequency of the number of eggs per host represents the proportion of larvae bearing as many or less parasitoids than indicated on the x axis. Dissections obtained from all replicates were pooled together within each combination. Two-way ANOVA on the mean number of eggs/parasitized host calculated for each replicate indicates a strong effect of wasp density (F(3,91)=25·3, P<0·0001) and of infection status (F(1,91)=25·6, P<0·0001). Note that superparasitism intensity was under-estimated for S females, especially at high densities, because larvae suffered mortality before we collected them, probably because of superparasitism intensity.
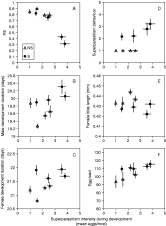
Fig. 2. Effect of development under superparasitism conditions on pre-imaginal and adult features of S and NS lines. (A) Pre-imaginal survival (PS), (B) developmental duration of males, (C) developmental duration of females, (D) superparasitism behaviour of the emerging females, (E) tibia length of emerging females and (F) egg load of emerging females. Superparasitism intensity is measured as the mean number of eggs/parasitized host. Data are grouped by wasp density (1,3,6,10) and are ranked as expected from left to right. Bars indicate S.E.
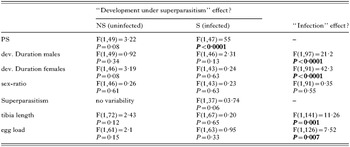
Table 1. Statistical tests of the effect of superparasitism development and of infection
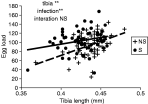
Fig. 3. Relation between egg load and tibia length. Results of the ANCOVA are shown on the graph. **P<0·001.
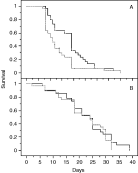
Fig. 4. Survival curves of infected (S, solid lines) and uninfected (NS, broken line) males (A) and females (B).
 You have
Access
- 32
- Cited by