INTRODUCTION
Durum wheat (Triticum turgidum L. var. durum Desf.) is grown on 10% of the world's wheat area and occupies about 11 million ha in the Mediterranean basin. However, its cultivation suffers from variable yields due to limiting environmental conditions. Rainfall and air temperature in Mediterranean dryland areas show large and unpredictable fluctuations within and among cropping seasons. In Iran, durum wheat is cultivated across diverse environments, ranging from warm lowlands to cold highlands. The improvement of a crop's productivity under stress conditions requires genotypes with stress tolerance and yield stability (Mohammadi et al., Reference Mohammadi, Sadeghzadeh, Armion and Amri2011). If relative performances of the genotypes grown in different environments are highly different, then genotype × environment (GE) interaction becomes a major challenging factor as well as potentially useful for breeding crops in specific geographical areas. In such cases, the breeder is faced either with developing specific breeding populations for each environment and/or with selecting genotypes that generally perform well across many environments (Isik and Kleinschmit, Reference Isik and Kleinschmit2005).
Grain yield is a very complex quantitative trait, and its expression is the result of genotype, environment and the GE interaction. Complexity of this trait results from different reactions of genotypes on variable environmental conditions during plant development. To optimize growers’ yields, despite GE interactions that cause no single genotype to win everywhere all the time, the growing region must be subdivided into relatively homogeneous mega-environments and appropriate genotypes must be targeted for each of these mega-environments. A mega-environment is defined as a group of environments that consistently share the same best genotype(s), (Gauch and Zobel, Reference Gauch and Zobel1997; Yan and Hunt, Reference Yan and Hunt2001). With no subdivision, only broad adaptation can be exploited, but with subdivision, narrow adaptations can also be exploited. Historically, breeders have understood the importance of GE interactions in plant breeding programmes (Allard and Bradshaw, Reference Allard and Bradshaw1964; Gauch, Reference Gauch1992; Yan et al., Reference Yan, Hunt, Sheng and Szlavnics2000; Yang et al., Reference Yang, Crossa, Cornelius and Burgueno2009). The existence of significant crossover GE interactions can be a serious constraint to crop improvement, leading to reduced genetic gains from selection and a waste of valuable resources. Most of the common statistical techniques available to analyse GE interactions are empirical in nature, focusing on quantification of GE interaction effects, identifying stable cultivars and identification of mega-environments. These include techniques such as ANOVA, joint linear regression, restricted maximum likelihood (REML), AMMI and GGE biplots.
In several cases, AMMI analysis appeared to be able to extract a large part of the GE interaction and is thus more efficient in analysing GE interaction pattern, as demonstrated by earlier reports (Gauch, Reference Gauch1992; Gauch and Zobel, Reference Gauch and Zobel1997; Ebdon and Gauch, Reference Ebdon and Gauch2002). The AMMI model uses analysis of variance (ANOVA, an additive model) to characterize genotype and environment main effects and principal components analysis (a multiplicative model) to characterize their interactions. Among multivariate methods, AMMI analysis is widely used for GE interaction investigation. This method has been shown to be effective because it captures a large portion of the GE interaction SS, it clearly separates main and interaction effects and may provide agronomically meaningful interpretation of the data (Ebdon and Gauch, Reference Ebdon and Gauch2002). The results of AMMI analysis are useful in supporting breeding programme decisions, such as specific adaptation and selection of environment. Usually, the results of AMMI analysis shown in common graphs are called biplot. The biplot shows both the genotypes and the environments values and relationships using singulars vectors technique (Gauch and Zobel, Reference Gauch and Zobel1997). For the accurate analysis of multi-environment trials (MET), the AMMI model is a valuable tool due to the accuracy that it provides in GE interaction studies (Ebdon and Gauch, Reference Ebdon and Gauch2002; Gauch, Reference Gauch2006; Li et al., Reference Li, Yan, Wei, Lan and Zheng2006). The AMMI biplots is the most well-known and appealing component of AMMI analysis. The AMMI1 provides a means of visualizing the mean effects and the stability (IPCA1) of the genotypes simultaneously, while AMMI2 shows its IPCA1 on the abscissa and IPCA2 on the ordinate (Gauch and Zobel, Reference Gauch and Zobel1997). In addition, the use of AMMI stability estimates (Purchase et al., Reference Purchase, Hatting and Van Deventer2000; Sneller et al., Reference Sneller, Kilgore-Norquest and Dombek1997) would be useful as another application of AMMI model.
Understanding the causes of GE interaction would reveal the genotypic characteristics that contribute to a superior genotype and the environmental factors that can be manipulated to facilitate selection of such genotypes (Yan et al., Reference Yan, Hunt, Sheng and Szlavnics2000). Numerous methods have been used for understanding the causes of GE interaction (van Eeuwijk, Reference van Eeuwijk1995). These methods can be categorized into two major strategies. The first strategy involves factorial regression analysis of the GE interaction matrix (i.e., the yield matrix after the environment and genotype main effects are removed) against environmental factors, genotypic traits or combinations thereof (Baril et al., Reference Baril, Denis, Wustrnan and van Eeuwijk1995). The second strategy is associated with the use of the AMMI model in multi-environment trials (MET) data analysis. However, both strategies, although different in approaches, have been shown to produce similar results (Vargas et al., Reference Vargas, Crossa, Van Eeuwijk, Ramirez and Sayre1999). By relating the PC1 and PC2 scores to environmental conditions and genotypic traits, the environmental and genotypic basis of the GE interactions can be assessed (Yan and Hunt, Reference Yan and Hunt2001). Accordingly, van Eeuwijk and Elgersma (Reference van Eeuwijk and Elgersma1993) showed that the AMMI IPCA1 and IPCA2 scores of environments can be regressed against measured meteorological variables to investigate the causes of GE interactions in ryegrass.
The main objectives of this investigation were to (i) analyse GE interaction in durum wheat multi-environment trials and (ii) investigate the relative influence of genotypic and meteorological variables on the GE interactions of durum wheat under rainfed conditions.
MATERIALS AND METHODS
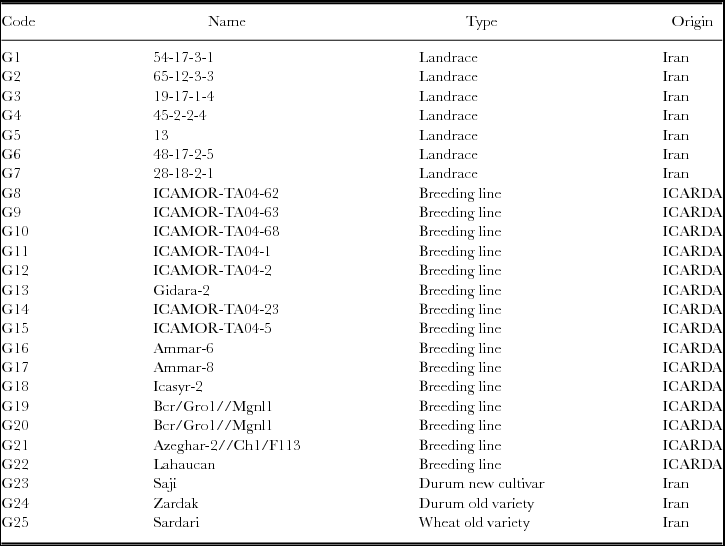
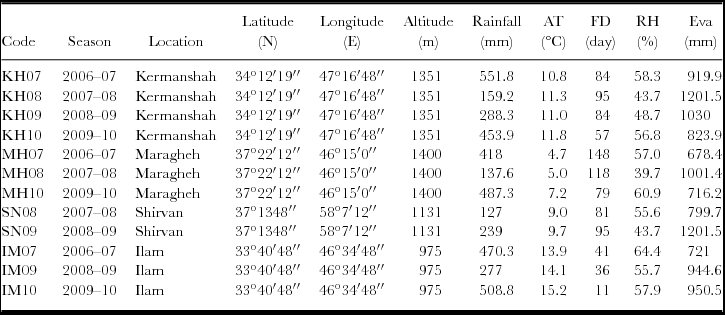
Twenty-five wheat genotypes (Table 1) including seven durum wheat landraces (G1-G7), 15 durum wheat breeding lines (G8−G22), one modern durum cultivar (G23, Saji), one old durum variety (G24, Zardak), along with one popular old bread wheat cultivar (G25, Sardari) were tested in uniform yield trials across four rainfed research stations representative of the major rainfed durum wheat-growing areas in Iran, during four cropping seasons (2006 to 2010), resulting in 12 environments (combinations of locations and years, with missing some combinations due to crop failure). Information on test environments is given in Table 2.
Code, name, origin and type of tested genotypes.

ICARDA: International Center for Agricultural Research in the Dry Areas.
The test environments and their main climatic characteristics in the study.

AT: annual average air temperature; FD: freezing days (number of days below zero degree) in a year; RH: annual average relative humidity; Eva: annual evaporatranspiration (Mahmoudi, 2010).
In each environment, the experimental layout was a randomized complete block design with three replications. Plot size was 7.2 m2 (6 rows, 6-m long, with 20-cm row spacing). Management practices (e.g., planting date before effective rainfall, seeding rate, row spacing, weed control, crop rotation) recommended for each environment were followed in all environments. The traits recorded were days to 50% flowering (DH) and maturity (DM), plant height (PLH), grain filling period (GFP), 1000-kernel weight (TKW) and grain yield (YLD), which were measured for each genotype in each environment. The grain yields were measured on a plot basis and converted to kg ha−1 for the statistical analyses. The AMMI analysis was performed using the raw data from 12 environments through the Gen Stat Release 15 statistical software (Payne et al., Reference Payne, Harding, Murray, Soutar, Baird, Glaser, Welham, Gilmour, Thompson and Webster2012). The model first fits additive effects for the main effects of genotypes and environments followed by multiplicative effects for GE interaction by principal component analysis (PCA, Zobel et al., Reference Zobel, Wright and Gauch1988). The AMMI model is as follows:
 $$\begin{equation*}
Yij = \mu + {G_i} + {E_j} + \sum\limits_{k = 1}^n {{\lambda _k}{\gamma _{ik}}{\delta _{jk}}} + {\rho _{ij}} + {\varepsilon _{ijk}},
\end{equation*}$$
where Yij is the yield of genotype i in environment j; μ is grand mean; Gi is the main effect of genotype i (i = 1, ... ,n) and Ej is the main effect of environment j (j = 1, ... ,m); λk is the singular value for IPCA; γik is the genotype i eigenvector value for kth PC; δjk is the environment j eigenvector value for kth PC, ρij is the interaction residual and εijk is the random error.
The number of significant terms in the AMMI model was evaluated with the method of Gollob (Reference Gollob1968). The results of the AMMI analysis were interpreted on the basis of AMMI biplots, integrating genotypic and environmental mean yields and stability (Gauch and Zobel, Reference Gauch and Zobel1997). In ANOVA, the SS for genotypes (G), GE signal (GES) and GE noise (GEN) provide a preliminary indication whether AMMI analysis will be worthwhile. The SS values for G and GE are direct outputs from ANOVA. To estimate SS for GE interaction, the error mean square (from replication) was multiplied by the number of degrees of freedom (df) for GE (Gauch, Reference Gauch1992; Reference Gauch2013). Then, GES was obtained by subtracting GEN from GE. AMMI analysis is appropriate for datasets having substantial G and GES. Especially when SS for GE is as large as that for G, as happens frequently, AMMI analysis will probably be worthwhile (Gauch, Reference Gauch2013). We used this criterion, as suggested by Gauch (Reference Gauch2013), for the model diagnosis in AMMI. The IPCA1 score of a genotype in the AMMI analysis was used as indicator of the stability of a genotype over environments (Grausgruber et al., Reference Grausgruber, Oberforster, Werteker, Ruckenbauer and Vollmann2000).
The predicted nominal yields estimated on the basis of the AMMI model equation without the environmental deviation across environmental IPCA1 scores, which indicates that the adaptability of each genotype (Gauch and Zobel, Reference Gauch and Zobel1997) was applied. This information allows the evaluation of the effects of genetic improvement on yield stability and adaptability and the identification of the highest yielding genotypes in specific environment. A correlation analysis between genotypic/environmental lPCAs scores from the best AMMI model and genotypic and meteorological variables was applied to identify most sources of GE interaction in rainfed durum wheat MET data.
RESULTS
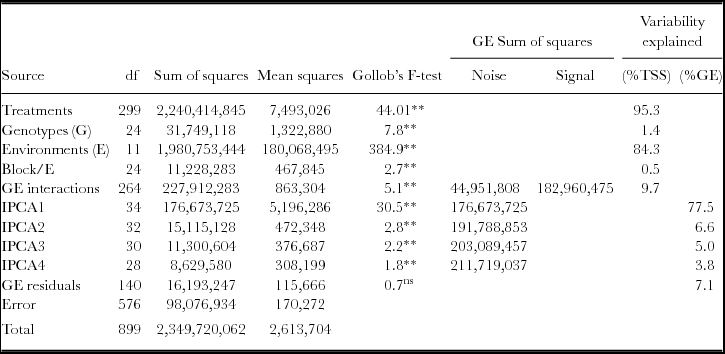
The AMMI analysis of variance for grain yield of durum wheat genotypes across environments showed highly significant main effects (p <0.01) of genotypes, environments and GE interaction (Table 3). Of the total variation, 84.3% contributed by the environment and GE interaction contributed for 9.7% of the total variation. Genotypic main effect accounted for 1.4% and the residual variance (i.e., error variance) captured for 4.2% of the total variation. The partitioning of GE interaction matrix constitutes the multiplicative term. The first four significant IPCAs were accounted for 77.5%, 6.6%, 5.0% and 3.8% of the total GE interaction, respectively. The residual effect contributed 7.1% of the total GE interaction (Table 3). The first interaction principal component axis (IPCA 1) alone captured 77.5% of the GE interaction SS using 12.8% of the GE interaction df. The postdictive success through the multiplicative terms indicated four significant IPCAs, which indicated AMMI-4 as the best model, while the predictive success method suggested AMMI-1 as the best model.
Analysis of variance of main effects and interactions for grain yield of 25 wheat genotypes across 12 environments.

**Significant at 1% level of probability; ns: non-significant; TSS: total sum of squares; GE: genotype × environment interaction.
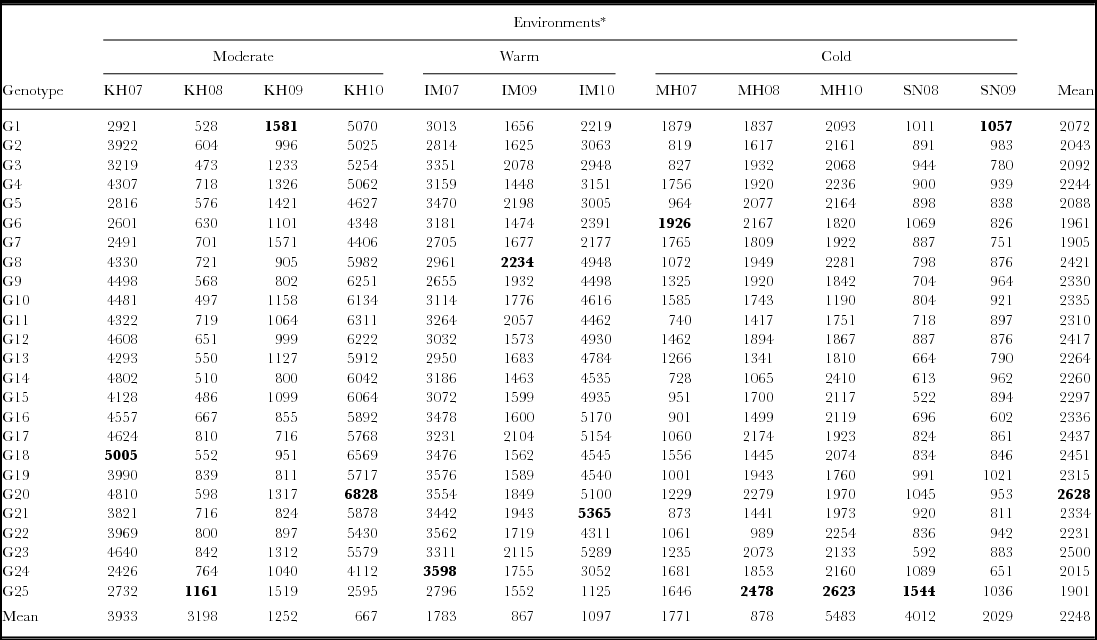
The breeding line G20, followed by G23 (new cultivar), G18, G17 and G8 had the highest mean yield productivity across environments, while the genotype G25 (bread wheat old variety) followed by G7, G6, G24 and G2 had the lowest yield productivity across environments (Table 4).
Mean yields (kg ha−1) for 25 wheat genotypes across 12 environments. In each column, bold values indicate the winner genotype for each environment.

*For environments code see Table 2.
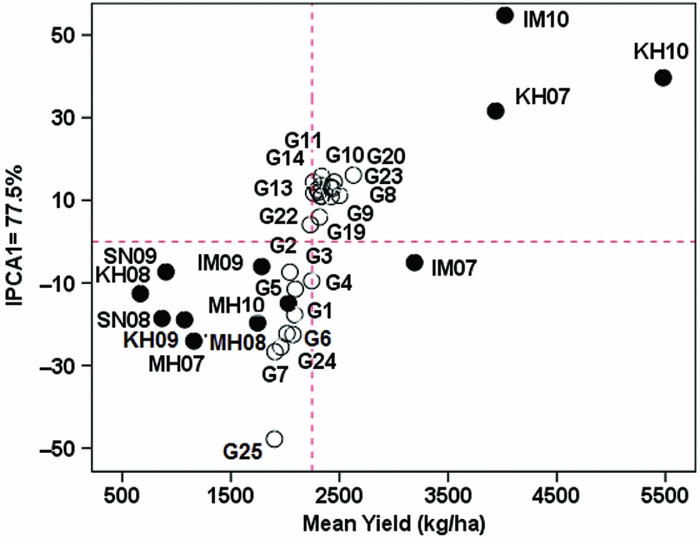
To characterize GE interaction, an AMMI-1 biplot was plotted using the genotype and environment mean yields and their IPCA1 scores (Figure 1). The biplot accounted for 97.7% of the treatment SS and is thus suitable for interpreting the GE interaction and main effects. Environments with scores near zero have little GE interaction across genotypes and provide low discrimination among genotypes. This pattern was observed for some test environments, i.e., IM09, IM07 and MH10. In contrast, the environments of IM10, KH10 and KH07 with high interaction across genotypes provided highest discrimination among genotypes. The environment KH08 with lowest yielding productivity had the low IPCA1 score and led to low interaction, whereas the environments IM10, KH10 and KH07 with high-yielding performance tended to have the highest contribution to GE interaction (Figure 1).
The AMMI-1 biplot for 25 wheat genotypes (open circles) evaluated for grain yield across 12 rainfed environments (solid circles) during 2006–10 cropping seasons. G1–G7 durum landraces, G8–G22 durum breeding lines, G23 durum new cultivar, G24 durum old variety, G25 bread wheat old variety. For details on genotype and environment codes see Tables 1 and 2.
The lowest IPCA1 as indicator of stability was observed for breeding line G22 followed by G19, landraces of G2 and G4 and breeding line G8. In contrast, the highest IPCA1 was found for bread wheat old variety (G25) followed by landraces G7, G6, G1 and durum old variety of G24 (Zardak) (Figure 1).
The breeding lines G20, G18, G8, G10 and new cultivar (G23) interacted positively with the KH10, KH07 and IM10, belonging to moderate and warm locations, but negatively with the cold locations and some moderate and warm environments (Figure 1). All landraces (G1–G7) along with old durum (G24) and bread wheat (G25) varieties adapted to the cold environments. The breeding lines G19, G8 and G10 had high yield and stable performance, with the IPCA1 value closest to zero. Similar IPCA1 values were found for the landrace G4.
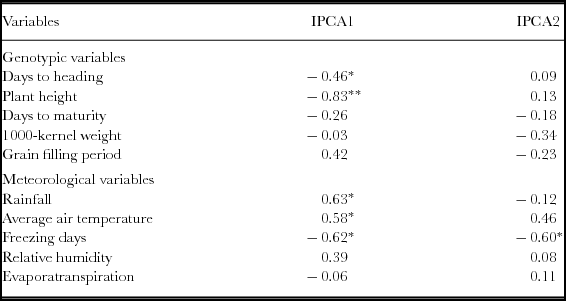
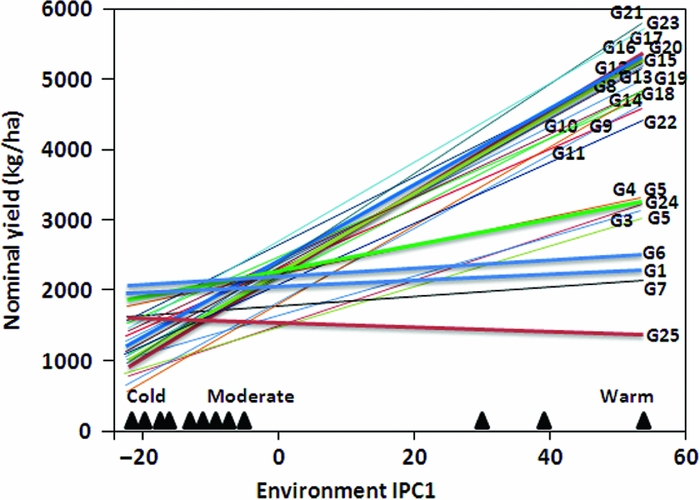
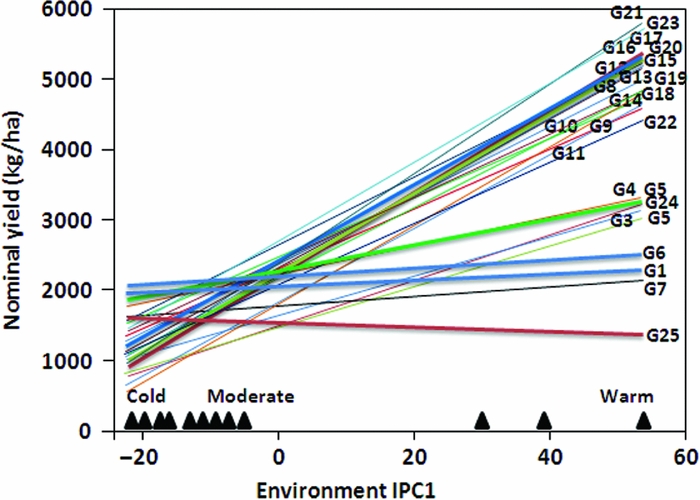
Adaptation map which shows the predicted nominal yields of 25 wheat genotypes as a function of the score on the environment IPCA1 scores of 12 test environments is presented in Figure 2. Lines resulted from the projection of the mean yield of each genotype versus the environmental IPCA1 scores. The order of the environments along the IPCA1 axis suggested that the climatic conditions, mainly rainfall and air temperature, have a greater impact on the occurrence of GE interaction. The slope of the lines reflects the adaptation patterns of the genotypes across the environmental IPCA1 scores. The results show that these interactions lead to different rankings of the genotypes across environments. From Figure 2, the breeding lines G21, G23, G20, G17, G16, G15 and G12 showed a sharp slope (highest instability) and exhibited the lowest yield productivity in cold environments (low IPCA1 values) and the highest mean yield at warm environments (high IPCA1 values). In contrast, the landraces and old variety with low slope had general stability and low to moderate yield productivity. The landraces G1 and G6 with average yield performances found to be the most stable genotypes. The correlation coefficients of genotypic and meteorological variables with the first two IPCA scores from AMMI model are presented in Table 5. IPCA1 scores were positively correlated with meteorological variables of rainfall (p <0.05), average air temperatures (p <0.05) and freezing days (p <0.05). IPCA1 showed negative correlations with plant height (p <0.01) and heading date (p <0.05), indicating that shorter plants and those with late in flowering tended to contribute to GE interaction. IPCA2 scores were not correlated with various genotypic variables and among the meteorological variables only correlated with freezing days (p <0.05), indicating that the contribution of most variables can be defined in relation to IPCA1 scores.
Correlation coefficients between the first two IPCAs from AMMI analysis and various genotypic/environmental variables.

*, **Significant at 5% and 1% level of probability, respectively.
Yield estimates of the winning genotypes, as related to the AMMI1 score of the environments (IPCA1). The lines are the responses of genotypes to different environments and the black triangles are the environments which are ranked based on their IPCA1.
DISCUSSION
The significance of the GE interaction suggests that there are significant differences in responses of genotypes to variable environments, and hence sensitivity and instability. The greater GE interaction relative to genotype effect suggests different mega-environments. Pronounced influences of environment on the grain yield compared to the genotype or the GE interaction effects have been documented in many crops (Fan et al., Reference Fan, Kang, Chen, Zhang, Tan and Xu2007; Ramburan et al., Reference Ramburan, Zhou and Labuschagne2011; Yan et al., Reference Yan, Hunt, Sheng and Szlavnics2000). The large variation due to environment confirms that the testing environments were different, with large differences among environmental means causing most of the variation in genotypic performances (Fan et al., Reference Fan, Kang, Chen, Zhang, Tan and Xu2007). Genotypic rank differences over environments showed the existence of crossover GE interaction, which showed the necessity to assess the response of the genotypes to environmental variation.
The GE interaction had a strong impact on grain yield (p <0.01), which explains the 9.7% (about 7-fold the genotype effect) of the model SS. METs have often shown that the yield variation due to GE interaction exceeds that due to genotype (Bidinger et al., Reference Bidinger, Hammer, Muchow, Cooper and Hammer1996). This is supported by the fact that the GE interaction mean yield varied from 473 kg/ha (corresponding to G3 at environment KH08) to 6828 kg/ha (corresponding to G20 at environment KH10) (Table 4), indicating a considerable variation in yield productivity of 25 genotypes in 12 environments. However, the strong GE interaction for quantitative traits such as grain yield can severely limit gain in selecting superior genotypes for improved cultivar development. In the present study, significant yield improvements were observed mostly in environments without stress (moderate and warm environments) rather than those with stress (cold). This agrees with findings reported by others (Ceccarelli, Reference Ceccarelli, Cooper and Hammer1996; Muñoz et al., Reference Munoz, Voltas, Igartua and Romagosa1998; Voltas et al., Reference Voltas, Romagosa, Lafarga, Armesto, Sombrero and Araus1999b). However, the breeding lines and modern cultivar showed high superiority over bread and durum old varieties and landraces under moderate and warm conditions, whereas the landraces and old varieties showed superiority over the breeding lines under cold stress conditions. The high superiority of landraces over the breeding lines and modern cultivar under cold stress conditions suggested that the evaluation of breeding lines in moderate and warm locations should be continued. These differences could be attributed to differences in the genetic material tested as well as to differences in the testing environments. However, under rainfed conditions, bread wheat cultivation is more profitable than durum wheat due to higher yield production and even the higher price of durum wheat (6% higher than bread wheat) has not encouraged farmers to expand durum cultivation. Thus, in durum wheat breeding programmes, a popular bread wheat cultivar is usually used as a control to test for superior of durum wheat genotypes in Iran. Among the check genotypes, Sardari (bread wheat) is an outstanding landmark bread wheat genotype, which is grown on a large scale in rainfed cold and moderate cold regions for 40 years in the whole country (Mohammadi and Amri, Reference Mohammadi and Amri2013). However, durum breeding in the Mediterranean basin, particularly in Iran, has made little progress in cold regions and most progress was in warm and moderate cold regions, highlighting the difficulty to increase yield of durum wheat under cold conditions.
Predictive accuracy as assessed by the signal and noise GE interaction (Gauch, Reference Gauch2013) showed that AMMI-1 as the best AMMI model for interpreting the variation in the data. This indicates that AMMI-1 estimation is closer to the true value of yield prediction. So, in this dataset, AMMI-1 is better procedure to estimate the mean yield of genotype in each environment. The IPCA1 effect was 5.5 times greater than the genotype effect, indicating the high importance of IPCA1 to contribute in the total GE interaction. However, the first IPCA was accounted for the majority (>77%) of GE interaction in the AMMI analysis, indicating the importance of AMMI-1 model for interpretation of yield data. As the GE interaction noise (GEN) was larger than genotype effect, it is valuable that AMMI-1 discards this large amount of noise. This was in agreement with Sneller et al. (Reference Sneller, Kilgore-Norquest and Dombek1997), who suggested that GE interaction pattern is collected in the first IPCA. The earlier reports indicate that AMMI analysis is adequate in characterizing GE interaction for grain yield in different crop species (Crossa et al., Reference Crossa, Fox, Pfeiffer, Rajaram and Gauch1991; Ebdon and Gauch, Reference Ebdon and Gauch2002; Li et al., Reference Li, Yan, Wei, Lan and Zheng2006). A graphically represented AMMI analysis enables selection of stable and high-yielding genotypes for variable environments, as well as genotypes with specific adaptability.
The adaptation pattern of different types of genotypes indicated that the landraces and old variety were different from breeding lines in stability and yield productivity. This indicates that the breeding lines are opposite to the landraces and old varieties in adaptation, yield performance and stability. Despite the relatively low potential of breeding lines at cold areas, majority of breeding lines and new cultivar had the highest mean yield, implying that they had good dynamic stability concept. According to Figure 2, there were two mega-environments including warm environments as breeding lines, especially G21 and new cultivar (G23) were wining genotypes, and cold environments as the landraces and old varieties with wining genotypes G6 and G1. The moderate lactation in some years was correlated with cold and in some years with warm location, indicating that the moderate location as already suggested can be used as a representative location to share breeding materials for both the warm and cold regions of Iran (Mohammadi et al., Reference Mohammadi, Haghparast, Amri and Ceccarelli2010).
The AMMI-1 biplot can be used to identify the appropriate check cultivar for all locations (general check) or for specific locations (specific check). Durum breeders would then compare their promising lines against either the general or specific check cultivar in selecting for the next high-yielding cultivar. For example, results from this study suggest that breeding lines G19 and G22 should be the general check genotypes for all environments because of their high yield and stability performance across environments. In addition, Saji new cultivar (G23) should be included in the MET and serve as an additional check cultivar at the warm and moderate test locations, since it had the highest yield at these locations. Results from AMMI biplot analysis indicated that breeding line G21 and new cultivar (G23) were the best genotypes in terms of better yield mostly at warm and moderate environments. The analyses also indicate that most of breeding lines qualify as check genotypes in moderate and warm environments.
The IPCA1 summarizes the most important part of the crossover GE interaction in rainfed durum wheat yield trials. Any genotypic traits and environmental factors that are highly correlated with the IPCA1 scores can thus be interpreted as possible genotypic and environmental causes of crossover GE interaction (Yan and Hunt, Reference Yan and Hunt2001). The correlation of genotypic and environmental factors with IPCA1 indicates again the importance of AMMI-1 as the best model for interpreting these dataset in durum wheat. The results verified that plant height and days to heading are important traits responsible for the observed GE interaction and suggest that GE interaction could be reduced by optimizing the earliness and plant height (i.e., by selecting plants with medium height). This means that extremely tall genotypes can be discarded with confidence even at early stages of breeding. Thus, the phenotypic traits led some genotypes to perform more favourably in some environments but less so in others. In the case of meteorological variables, rainfall and average temperature were significantly (p <0.05) contributed to GE interaction and can be more effective in identifying superior genotypes for different environments. This finding suggests that environments with greater rainfall and higher winter temperature tended to have greater IPCA1 scores. These relatively high correlations indicate that there were large differences among genotypes in response to rainfall and air temperature. By using this approach, van Eeuwijk and Elgersma (Reference van Eeuwijk and Elgersma1993) in ryegrass, Van Oosterom et al. (Reference van Oosterom, Mahalakshmi, Bidinger and Rao1996) in pearl millet and Yan and Hunt (Reference Yan and Hunt2001) in winter wheat identified the major environmental/genotypic causes of GE interaction in different crop species.
The cold environments characterized by low rainfall and temperatures, tend to favour a category of genotypes which are taller (with more susceptible to lodging in favourable years) and generally late in maturity with higher TKW. These genotypes are mainly represented by landraces and old varieties. The relatively short plant height of breeding lines and new cultivar might have allowed these genotypes to took advantage of good water status during grain filling, because it was associated to lower lodging susceptibility (Voltas et al., Reference Voltas, van Eeuwijk, Sombrero, Lafarga, Igartua and Romagosa1999a; Yan and Hunt, Reference Yan and Hunt2001). The heading date of breeding lines, was strongly correlated to GE interaction, may have been important for the specific adaptation, possibly allowing a higher level of yield productivity. On the other hand, the landraces with taller stature performed relatively better when growing conditions were harsher. The lateness of the landraces and the lower temperatures during grain filling period might have exerted an influence on the grain growth, and hence leading to a higher TKW. This reveals a better adaptation of these kinds of genotypes to water limitations during their terminal growth stages, in agreement with previous studies on durum wheat landraces (Moragues et al., Reference Moragues, Garci´a del Moral, Moralejo and Royo2006).
CONCLUSION
The results have demonstrated the existence of large and complex GE interactions, which imply repressiveness of some entries to different environments but not others, that may be exploited for improved selection and evaluation. However, the environment was the major source of variation in grain yield and accounted for more than 80% of total variation. In addition to the effects of some seasonal variables (rainfall and temperature) on separation of rainfed environments, substantial variation was also observed between environments, which showed variation along IPC axes. This suggests that in addition to GE interaction patterns, grouping of environments based on seasonal variables can be regarded in durum breeding programme. However, the use of genotypic variables to investigate the responses of genotype groups to environmental factors will help better understanding about the variation in test environments and could the facilitate specific breeding objectives. According to AMMI, appropriate check genotypes for all locations or for specific locations were identified, with the breeding lines being qualified as check genotypes in moderate and warm environments, and old varieties and landraces in cold locations. The presence of specific adaptation evidenced by our results is of particular relevance in Mediterranean environments, such as Iran. The breeding line G20 is recommended for further inclusion in the breeding programme due to its highest yield performance among genotypes, and breeding line G19 is recommended because of its stability and high yield. The findings indicated that plant height and heading date were the major genotypic causes of GE interaction, and climatic variables of rainfall, average temperature and freezing days were significantly contributed to the GE interaction.