


Introduction
Records from several Antarctic ice cores now provide a picture of Antarctic climate and its changes on glacial– interglacial time-scales, making an important contribution to our understanding of the climate system and dynamics, and thus our ability to predict future climate changes.
Much of this long-term Antarctic climate information comes from the few deep-coring projects in central East Antarctica: Vostok, Dome C, Dome Fuji and the current European Project for Ice Coring in Antarctica (EPICA) project at Kohnen station, Dronning Maud Land. It is misleading, however, to think in terms of Antarctic climate without accounting for the significant variations in regional climate across the continent (see, e.g., Reference BromwichBromwich, 1988). The precipitation rates and regime in the high-elevation central Antarctic are very different than in the marginal regions, the lower-elevation West Antarctic or the Antarctic Peninsula. Other cores from the Ross embayment (Taylor Dome and Siple Dome), West Antarctica (Byrd) and coastal East Antarctica (Law Dome) provide an important, but still limited, extension of our knowledge of past changes of Antarctic climate on glacial–interglacial time-scales.
Accumulation patterns are an indicator of atmospheric circulation, and are essential in computing the mass balance of the Antarctic ice sheet. Accumulation in marginal regions is of particular interest when considering potential sea-level responses to climate forcings, because these regions have both relatively high rates of accumulation and relatively rapid glacier response times when compared with the continental interior. Here we present the age-scale for the deep Law Dome ice core, Dome Summit South (DSS), and with it the derived palaeo-accumulation record.
Law Dome is situated on the coast of East Antarctica (Fig. 1), and the DSS site is located near the summit, approximately 100 km from the sea, at 1370m elevation (Reference Morgan, Wookey, van Ommen and FitzpatrickMorgan and others, 1997). Law Dome extends further north than any other grounded ice on the Antarctic continent with the exception of the northern Antarctic Peninsula. Consequently, the regional climate is strongly influenced by cyclonic precipitation and shows a strong maritime signature (Reference Curran, van Ommen and MorganCurran and others, 1998; Reference Masson-DelmotteMasson-Delmotte and others, 2003) with links to lower latitudes (Reference McMorrow, Curran, van Ommen and MorganMcMorrow and others, 2002).
Map of Law Dome showing the DSS drill site, elevation contours and accumulation isopleths (kgm–2 a–1).

In this work, we use data from the DSS deep core augmented in the upper portion by dating from other cores recovered at the same site (DSS97 and DSSW0k). Hereafter we refer to the composite record as the Law Dome record and neglect the site identifier (DSS) unless the distinction is necessary.
Age-Scale and Ice-Flow Model
Overview
The DSS ice-core age-scale presented here, which we denote as LD1, is derived from a combination of directly counted annual layers and age-ties to other records. Between tie points, ages are interpolated using a simple glaciological model (Reference Dansgaard and JohnsenDansgaard and Johnsen, 1969) applied to ice-layer thinning at DSS.
The model parameters are fitted to observed annual-layer thicknesses which are measured continuously through the upper ∼400m (the past ∼700 years) and at intervals below this; clear annual layers are seen in δ18O down to 104m (∼5.4 kyr BP, 0BP = AD 1950), but become difficult to resolve by 1080 m (∼6.9 kyr BP). Thus, the flow model is constrained by data through 85–90% of the total ice-sheet thickness, corresponding to the late Holocene. We assume that this period of relatively stable sea level, insolation and mean climate is free of major accumulation trends. Age-ties to other palaeo-records are established via (i) changes in the composition of trapped air (methane concentration and δ18Oair) through the deglacial period 19–9 kyr BP, (ii) relative changes in dust concentration, and (iii) direct matching of major changes in δ18Oice.
Accumulation estimates are derived from the combination of flow model and age-ties, and these are explored in the subsequent discussion.
Flow model
Following the method of Reference Morgan, Wookey, van Ommen and FitzpatrickMorgan and others (1997), we fit observed layer-thinning data with the model of Reference Dansgaard and JohnsenDansgaard and Johnsen (1969). The data, together with the model curve and the residuals from the model, are shown in Figure 2.
Layer-thickness data and model fit (upper panel and curve) and residuals from model (lower panel) for DSS. Depths are expressed in metres ice equivalent, as described in the text. Layer-thickness measurements in the firn are likewise density-corrected to ice equivalent.
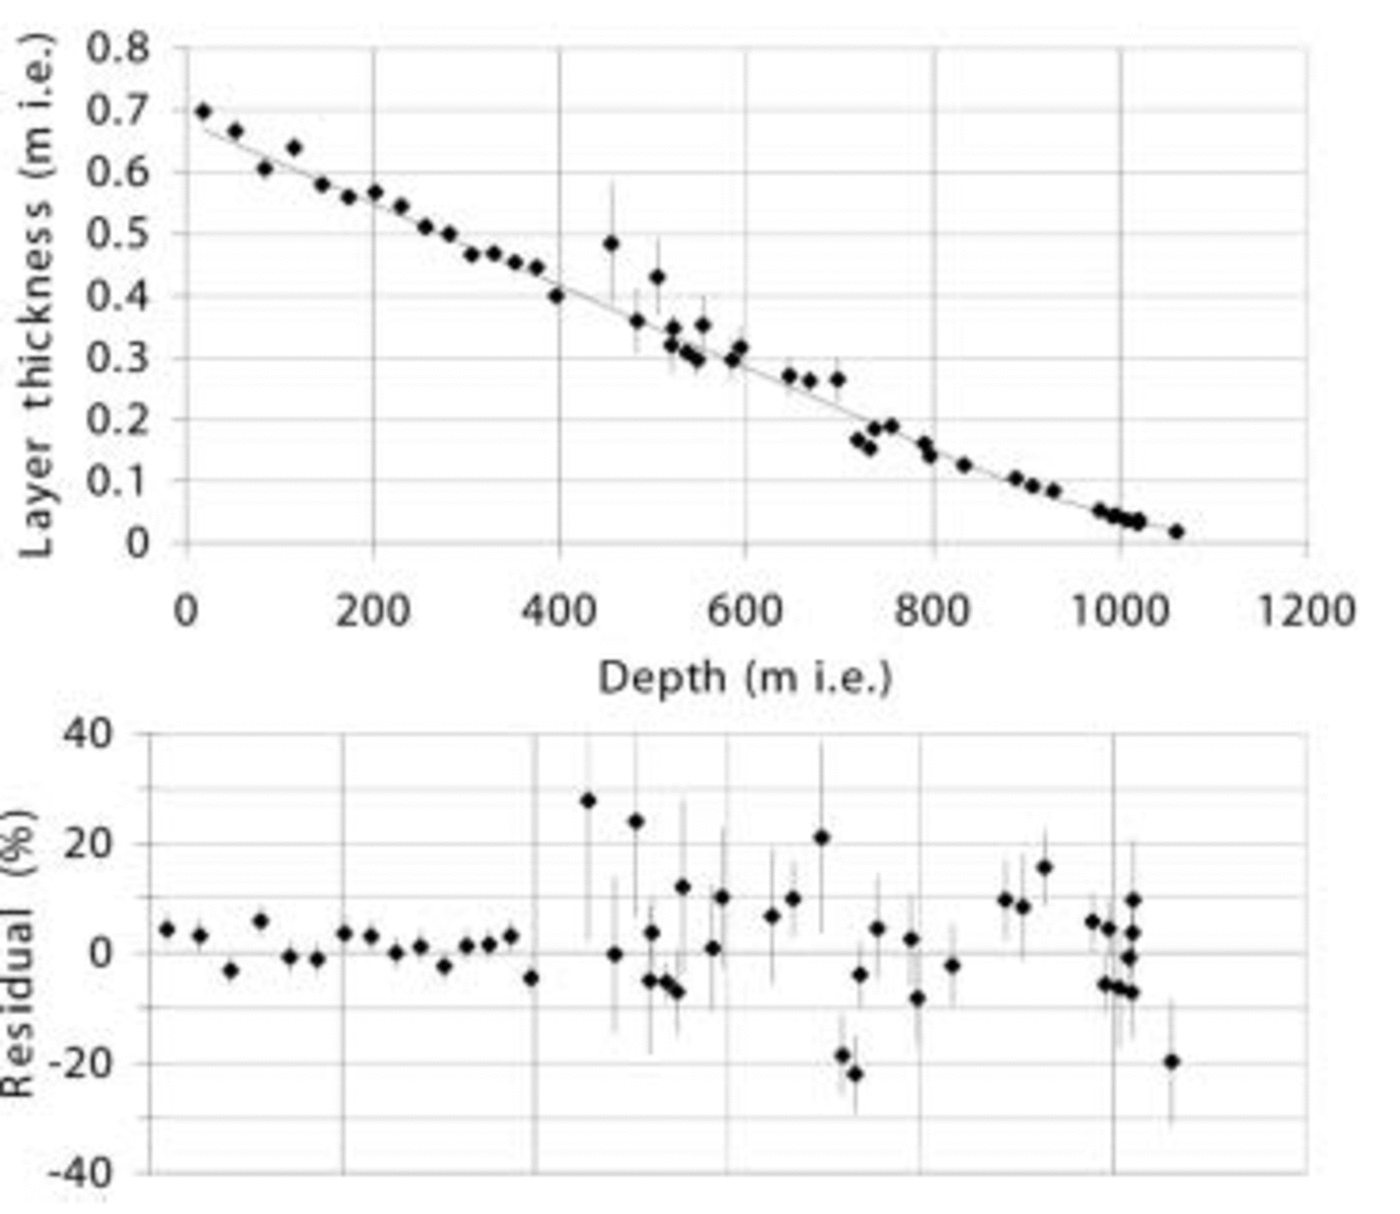
The conversion of depths and layer thicknesses to metres ice equivalent uses an empirically derived fit to firn densities at DSS (Reference Van Ommen, Morgan, Jacka, Woon and ElcheikhVan Ommen and others, 1999). At depths below the firn column where the density effectively reaches that of glacial ice, the correction to ice equivalent depth amounts to a reduction of the actual depth by 21.5 m.
The layer-thickness dataset is an extension of the data available for earlier flow-model development (Reference Morgan, Wookey, van Ommen and FitzpatrickMorgan and others, 1997), and here we have reduced the continuous layer-thickness measurements in the upper 400 m to a series of averages over 50 years, in order not to unduly constrain the fit by the high density of measurements in the upper ice sheet.
The model fit gives the following parameter values:
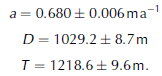
Following the notation of Reference Morgan, Wookey, van Ommen and FitzpatrickMorgan and others (1997), a is the ice equivalent accumulation rate, D is the intercept on the ice equivalent depth axis of the linear segment of the thinning model, and T is the effective ice-sheet thickness (also in m ice equivalent). Note that the transition from the linear thinning (region of uniform vertical strain) to quadratic thinning (region of linearly reducing vertical strain) in this model occurs at a depth of 2D– T, or 839.8 m; a number of the layer-thickness data come from below this depth and so serve to constrain the model parameters in this strain regime. The model fit reveals considerable covariation in the parameters, indicating that the quoted errors may significantly underestimate the potential for variation in the parameters where they vary together.
While the parameter values of this fit differ somewhat from the earlier published values (Reference Morgan, Wookey, van Ommen and FitzpatrickMorgan and others, 1997), it should be noted that this earlier work had fewer layer-thickness data, particularly in the region below the ‘break depth’ of ∼840 m. The ‘effective’ ice-sheet thickness obtained here is approximately 44m greater than the total recovered core length, and close to the upper limit of the estimated ice-sheet thickness from radio-echo soundings (Reference Morgan, Wookey, van Ommen and FitzpatrickMorgan and others, 1997). The drilling terminated in silty ice and it is likely that a few tens of metres of silty ice underlie the borehole. The bottom ∼14m of the DSS core is of indeterminate age, showing increasing signs of disruption toward the bottom when compared with other records. The bottom 9 m shows interglacial isotopic values. Whether this ice is from the last interglacial period, or much older, is not known.
Age-ties
Table 1 lists the 17 age-ties used to constrain the LD1 age-scale (an 18th tie at the core bottom generates a pseudo-age-scale for the basal disturbed record but has no physical basis).
Age-ties for the LD1 age-scale. Type codes as follows: 1. layer counting; 2. layer thickness; 3. δ18Oair matched with GRIP; 4. CH4 concentration matched with GRIP; 5. dust concentration matched via Byrd to GRIP; 6. δ18Oice matched via Byrd to GRIP

The top tie is based on direct layer counting of continuous annual layers (type 1 tie) to AD 1213 (737 years BP). This is an extension (using continuous δ18O measurements) of earlier dating to AD 1301 derived from continuous δ18O and trace-ion data (Reference Palmer, van Ommen, Curran, Morgan, Souney and MayewskiPalmer and others, 2001). The precision of the dating at AD 1301 is estimated at ±1 year, and this degrades in the absence of chemistry data to ±2 years at 737 years BP. The ties of type 2 from 1236 to 6872 years BP use the deviations of layer thickness from the mean flow-model value in Figure 2 (and, in fact, constrain the dating in this region consistently with the flow-model assumption of trend-free accumulation through this period).
The age-scale through the Holocene is essentially an interpolation, using the flow model, between the high-precision age from layer counting at ∼0.8 kyr BP and the tie at ∼9.7 kyr BP from gas composition (discussed below), which has an estimated precision of approximately ±200 years. Additional data that presently provide a weak constraint through this period come from Holocene measurements of CH4 in the DSS core (personal communication from D. M. Etheridge and C. MacFarling,). These measurements track the trend in global CH4 from ∼6 to 10 kyr BP and provide an estimated upper limit to the dating error of ±400 years. The sharper global drop in CH4 at around 8.2 kyr should provide a tighter constraint once sampling and measurement through this region are complete. Current measurements do provide a constraint on the possible location within the core of this 8.2 kyr event and suggest the underlying age error is <200 years.
The ties from 9682 to 16 385 years BP rely upon measurements of trapped air (type 3 and 4 ties), and have been discussed elsewhere as part of the overall deglacial timing at Law Dome (Reference MorganMorgan and others, 2002). It is important to note that the timing of these air-composition measurements, which is tied to the Greenland Icecore Project (GRIP) record, is dependent upon the air-trapping process, and this, in turn, depends upon the local temperature and accumulation rate.
Since the accumulation rate is estimated from the flow and age-ties, the estimation process is iterative; however, it converges quickly, given estimation methods for palaeo-accumulation and palaeotemperature.
In order to explore timing variability, Reference MorganMorgan and others (2002) adopted two schemes for estimating palaeo-accumulation and palaeotemperature. One scheme, chosen for its bias to rapid trapping, was to estimate palaeotemperature variations from modern levels using the oxygen isotope data and the spatially derived temperature conversion of 0.7‰˚C–1; the palaeo-accumulation rate was estimated from the relationship between temperature and saturation vapour pressure. The use of the saturation vapour pressure to estimate accumulation implicitly assumes a thermodynamic limit to accumulation rather than a transport limit. This may be appropriate in the high interior of Antarctica (Reference LoriusLorius and others, 1985; Reference Ciais, Petit, Jouzel, Lorius and BarkovCiais and others, 1992), but for coastal Antarctica, subject as it is to precipitation from cyclonic systems, this is probably not the case (e.g. Reference SteigSteig and others, 2000). In fact, as we show below, the thermodynamic limit seems to break down at Law Dome in the Holocene.
In contrast, for the LD1 age-scale, we estimate air trapping by using palaeotemperatures derived from the conservative temporal value of 0.44‰˚C–1 (Reference Van Ommen and MorganVan Ommen and Morgan, 1997) and by using palaeo-accumulation values derived here (which are obtained iteratively from the LD1 dating and associated ice flow).
The trapping ages are estimated from palaeotemperature and palaeo-accumulation data using the model of Barnola (Reference Barnola, Pimienta, Raynaud and KorotkevichBarnola and others, 1991), and the resulting age-ties are those presented as the ‘LD (default)’ scenario in Reference MorganMorgan and others (2002).
Over the period 32–16 kyr BP, large dust-concentration changes are used to constrain two ties (type 5). Figure 3 shows the dust concentration records for DSS, Byrd (Reference Thompson, Hamilton and BullThompson and others, 1975) and Vostok (Reference Petit, Mounier, Jouzel, Korotkevich and KotlyakovPetit and others, 1990). The age-scales for Byrd and Vostok are tied by methane measurements to GRIP (Reference BlunierBlunier and others, 1998). For comparison, the absolute dust concentrations are expressed as deviations from the mean Holocene values, normalized by the peak value at the Last Glacial Maximum (LGM).
Late-glacial dust concentrations for Law Dome (LD), Byrd and Vostok ice cores. The age-scales for Byrd and Vostok are tied to GRIP (Reference BlunierBlunier and others, 1998). Concentrations are expressed as deviations from mean Holocene values, normalized to the peak values.

The final type of age-ties employed (denoted as type 6) also use the Byrd record and GRIP-tied chronology. For these ties, the δ18O records of DSS and Byrd are matched over six intervals from 87.2 to 14.7 kyr BP (Fig. 4). The ties were chosen to give good visual accord between the records over the intervals with a minimum number of ties and without large changes in implied accumulation across each tie.
Oxygen isotope records for Law Dome (LD) and Byrd prior to 10 kyr BP, with age-ties (vertical dashed lines). Byrd δ18O offset by +9.3‰.

Derived palaeo-accumulation
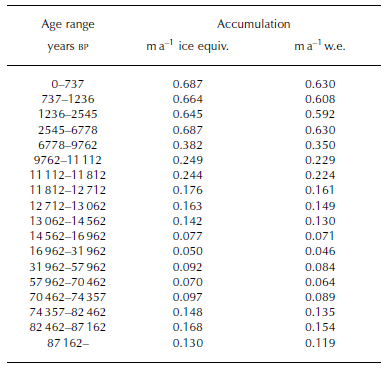
Figure 5 shows the accumulation implied by the age-ties and flow model (heavy solid ‘staircase’ line) with the isotope record for reference. The staircase line overlying the isotope curve shows the averages of the isotope data over the same age intervals as the accumulation. The inferred accumulation ranges from the modern Holocene value of ∼0.7ma–1 down to 0.05ma–1 at the LGM; the values are listed in Table 2. Two observations stand out as remarkable: (i) The LGM-to-modern change is very large compared with central Antarctica, and (ii) the lower average accumulation through the early Holocene is somewhat surprising during a period of relatively stable temperature and hence inferred climate stability. In the next section, we discuss these issues, the existence of corroborating evidence and the possibility of alternative interpretations.
Oxygen isotope record for Law Dome (fine line) and model-implied accumulation (thick line). The staircase-style line overlying the isotope record indicates the average δ18O value over the corresponding interval.

Inferred accumulation values between age-ties
Results and Discussion
The key issue which should be stressed is that the accumulation values derived above are dependent upon the thinning from the flow model and the assumption that the layer-thickness data used to constrain the model are not influenced by gross trends in mean accumulation (especially from 0 to ∼4kyr BP where most layer-thickness measurements have been made).
We investigated the sensitivity of the accumulation estimates to the flow thinning by making simple adjustments to the Reference Dansgaard and JohnsenDansgaard and Johnsen (1969) flow model (principally by introducing a gradual transition between the region of uniform strain rate and the underlying region of linearly decreasing strain rate). These changes have little effect on accumulation estimates in the late deglacial and Holocene. Also, they tend not to greatly alter the relative accumulation changes between tie periods, but, rather, influence the absolute levels and overall trend through the glacial period. We conclude that the accumulation level at the LGM has a likely error range of 50–200% of the derived value of 0.05 m, although this still makes the LGM accumulation rate less than one-sixth of its present value. Without independently corroborating palaeo-accumulation estimates, the possibility remains that the ice flow is yet more complex.
We presently have just one independent estimator for accumulation change at Law Dome; this uses dust-concentration changes. The peak LGM-to-mean-Holocene dust-concentration ratios for Law Dome and Vostok (Reference Petit, Mounier, Jouzel, Korotkevich and KotlyakovPetit and others, 1990) are ∼36 and ∼12 respectively. If we assume that the dust flux is dominated by distant sources, the change in flux ratios at each site should be similar. This implies that the accumulation-rate increase at Law Dome from LGM to Holocene is approximately 3 times greater than at Vostok. Thus, the Vostok accumulation increase by a factor of ∼2.5 (Reference Yiou, Raisbeck, Bourles, Lorius and BarkovYiou and others, 1985; Reference Raisbeck, Yiou, Bourles, Lorius, Jouzel and BarkovRaisbeck and others, 1987; Reference Salamatin, Lipenkov, Barkov, Jouzel, Petit and RaynaudSalamatin and others, 1998) implies an accumulation increase at Law Dome by a factor of 7–8. This simple estimate implies a more dramatic accumulation shift at Law Dome, and, given uncertainties in circulation changes and comparability of dust measurements, it is in broad agreement with the overall magnitude of accumulation change inferred here.
The other widely used estimator for palaeo-accumulation is concentrations of the cosmogenic isotope 10Be, and future measurements at Law Dome may be helpful in this regard. However, late-Holocene measurements of 10Be at Law Dome show a significant seasonal cycle and that the flux is strongly dominated by wet deposition (Reference SmithSmith and others, 2000; Reference PedroPedro, 2002), making interpretation of LGM–Holo-cene 10Be concentration changes problematic.
There is little information on LGM–Holocene accumulation changes for coastal Antarctica, where cyclonic precipitation is dominant, although data from Taylor Dome show LGM accumulation that is <20% of the Holocene value (Reference SteigSteig and others, 2000).
Past changes of ice geometry at Law Dome are also relevant, particularly as these could have produced different ice flow near the summit, with implications for thinning and inferred accumulation. As discussed by Reference Morgan, Wookey, van Ommen and FitzpatrickMorgan and others (1997), we believe the overall geometry, both extent and elevation, of Law Dome has not changed greatly from the glacial to the present. Reference Delmotte, Raynaud, Morgan and JouzelDelmotte and others (1999) show from decreases in trapped-air volume at the LGM that the elevation was 136–245m higher at that time, if the concurrent temperature changes are estimated using the 0.44‰˚C–1 isotope–temperature conversion used elsewhere in this work. Also, trapped-air volume measurements at 1100m depth (Reference Delmotte, Raynaud, Morgan and JouzelDelmotte and others, 1999), corresponding to ∼8.5 kyr BP, show no departure from modern values, indicating no significant changes in ice-sheet elevation since this time. Additional evidence arises from marine limit data and modelling of isostatic uplift (Reference Goodwin and ZweckGoodwin and Zweck, 2000). This work shows data consistent with the LGM margin of Law Dome extending seaward typically 50– 65 km, with a concurrent elevation increase of 150 m at the present summit. This extended glacial ice cap retreats to its present location by around 9 kyr BP.
The absence of large changes in ice-sheet geometry near the DSS drill site from the LGM to the present suggests we are correct to assume the layer-thinning changes between age-ties are dominantly reflective of accumulation changes and not ice flow. This is particularly so in the period 9– 7 kyr BP, by which time the ice-sheet geometry has reached essentially its present configuration.
This leads to the conclusion that the inferred accumulation shifts from LGM to Holocene, including the significant change in the early Holocene, are likely to reflect real changes at the drill site. However, accumulation changes at the drill site may not necessarily indicate genuine climatological changes but a rearrangement of the topographically induced accumulation pattern across the dome. From Figure 1, it may be seen that present-day accumulation at Law Dome is marked by a very sharp east–west gradient; high accumulation on the east side is the result of predominant cyclonic flow from the southeast and the orographic effect of the dome. The question is, has the location or shape of this pattern changed in such a way that we see ‘accumulation’ changes that are only local? To address this, we look at evidence from two other measured parameters: (i) the ion chemistry and (ii) the isotopic signal.
The ion chemistry, specifically the sea-salt sodium concentration (Fig. 6), shows a significant increase through the early and mid-Holocene. However, sodium concentration measurements across the dome over the late Holocene show that this species is essentially 100% wet-deposited, with concentrations at DSS and DE08 (16km east of DSS) that are the same despite the fact that accumulation at DE08 is twice that at DSS. So sodium concentration changes are not expected to accompany accumulation changes arising from pattern changes, and therefore the Holocene changes in sodium suggest real changes in transport and accumulation over this period.
Sodium concentrations from DSS during the late deglacial and early Holocene. High-resolution data (light curve) show approximately 20 year averages, and the thick solid curve is a running median over approximately 200 years. The light dashed line is the median concentration for 0–700 years BP, and the thick dashed line shows the median concentration over the ~6.8–9.8 kyr interval defined by the age-ties above.

The isotopic signal in precipitation across the dome provides additional constraints on the observed changes that would likely accompany a changed accumulation pattern. Progressive distillation of vapour during transport across the dome produces a strong east–west gradient in isotopes that accompanies the accumulation gradient. Under present-day conditions, both the accumulation and isotope ratio are linearly correlated over an east–west transect of >30km centred on the DSS site, with increasingly depleted isotopic values at lower-accumulation sites. This trend covers an accumulation range of approximately 10–200% of the DSS value. If we now equate the accumulation change of some 180% before and after 6.8 kyr BP to a pattern shift and use this modern fractionation as a guide, we expect an isotopic ‘warming’ in excess of 1‰. The isotope record shows no indication of such a change through this period, thus further supporting the hypothesis that the inferred accumulation changes around this time are not due to local topographical effects.
We have noted above that the association between accumulation rate and temperature commonly used to estimate accumulation rates in central Antarctica may not be applicable at Law Dome, or indeed other coastal locations. The accumulation-rate estimates here permit further exploration of this argument. Figure 5 suggests a linear relationship (R 2 = 0.75) between the isotope and accumulation time series in the glacial period. It must be stressed that this relationship was not used a priori to constrain the age-ties in the glacial period, but rather it arises naturally from the synchronization described above.
Figure 7 shows the relation between isotope and accumulation data over the full Law Dome record. Accumulation in the glacial period exhibits a strong linear correlation with isotopic depletion, and hence temperature. More properly, the accumulation should be related to the derivative of the saturation-vapour-pressure–temperature relation, which is slightly non-linear. Using our 0.44‰˚C–1 coefficient to compute temperature and hence the derivative of saturation vapour pressure gives a similarly strong relationship with accumulation: the correlation improves marginally to R 2 = 0.76.
The relationship between Law Dome accumulation and δ18O. Open squares correspond to Holocene averages between age-ties, as labelled. Filled diamonds are pre-Holocene averages between tie points, also labelled for selected periods. The dashed line is a least-squares regression for the pre-Holocene data.

The precipitation regime at Law Dome during the glacial thus appears to behave more like the present-day Antarctic Plateau, where moisture content is a good estimator for accumulation (Reference LoriusLorius and others, 1985; Reference Ciais, Petit, Jouzel, Lorius and BarkovCiais and others, 1992), but after the early Holocene the relationship breaks down, and accumulation is essentially independent of temperature. The alternative control on moisture delivery is transport. Reference BromwichBromwich (1988) notes that intensity of cyclonic activity is the dominant governing factor for Antarctic precipitation, and that coastal snowfall is episodic, and associated with synoptic-scale features, whereas precipitation above 3000 m is much more continuous. Taylor Dome, like Law Dome, shows changes in precipitation, from a glacial that is more like the central Antarctic to a Holocene with strong cyclonic influence (Reference SteigSteig and others, 2000). The local changes at Taylor Dome associated with the disappearance of the Ross Sea ice sheet are also identified as an important influence through the Holocene.
The Law Dome changes in accumulation and sea salt are consistent with increased cyclonic influence, with modern levels only being reached sometime after 7 kyr BP (this timing can be further probed using the detailed Law Dome Holocene trace chemistry, as this becomes available). The Law Dome sea-salt loading is a valuable indicator of the atmospheric pressure, both on the continent (Reference Souney, Mayewski, Goodwin, Morgan and van OmmenSouney and others, 2002) and at mid-latitudes (Reference Goodwin, van Ommen, Curran and MayewskiGoodwin and others, 2004) where the moisture originates. Comparison between US National Centers for Environmental Prediction (NCEP)/US National Center for Atmospheric Research (NCAR) re-analyses and modern sea-salt levels at Law Dome (Goodwin and others, in press) shows that sea-salt concentrations are elevated during periods of enhanced meridional circulation, and closely linked to the Southern Hemisphere Annular Mode (Reference Thompson and WallaceThompson and Wallace, 2000). Thus, the pattern of postglacial accumulation changes at Law Dome indicates a gradually increasing intensity of cyclonic input up to 7 kyr BP or possibly later. This increased intensity may arise from any combination of changes in cyclonic tracks, depth, radius or frequency.
Although Holocene climate is typically regarded as relatively stable, this is not generally accurate, with significant changes as late as the mid-Holocene (Reference SteigSteig, 1999). Orbitally driven changes in mean annual insolation have an influence on the meridional transport of moisture and the isotopic signature of Antarctic precipitation (e.g. Reference Vimeux, Masson, Jouzel, Stievenard and PetitVimeux and others, 1999). Recent climate modelling (Reference Liu, Brady and Lynch-StieglitzLiu and others, 2003) suggests that such insolation changes through the Holocene have produced changes in sea surface temperature. Early-Holocene high-latitude insolation has decreased, and with it there has been a slight cooling (up to 0.4˚C) that is reflected in proxy data. Insolation at low latitudes, in contrast, has increased, and with it sea-surface temperatures (up to 0.5˚C). These changes combine to increase the temperature gradient between low and high latitudes over the Holocene. General circulation model (GCM) tests of climate response to an increased latitudinal temperature gradient (Reference RindRind, 2000) suggest an increase in global water-vapour loading, increased precipitation (including high-latitude snowfall) and a stronger atmospheric connection between low and high latitudes that are all consistent with the Holocene accumulation increase observed here.
Concluding Remarks
Our results point to large changes in accumulation at Law Dome between the LGM and the late Holocene, with significant change in the first half of the Holocene. This is not altogether surprising since the coastal location of Law Dome gives a climate that is much more strongly influenced by the changes in ice-sheet boundary and sea level through the deglacial transition and early Holocene.
The present-day Law Dome is also different to the inland sites in that practically all its precipitation is transported by cyclonic systems centred to the north of Antarctica. Law Dome is strongly influenced by a persistent ‘climatological’ low-pressure feature (Reference Simmonds and KeaySimmonds and Keay, 2000) and has a strong oceanic influence (Reference Curran, van Ommen and MorganCurran and others, 1998) that produces a contrasting precipitation regime to the continental interior. The interior precipitation is dominated by ‘clear-sky’ (ice-crystal) precipitation that accumulates much more continuously than the cyclonic precipitation near the coast (Reference BromwichBromwich, 1988). These different mechanisms also constitute a significant change to the way in which the ice-core ‘palaeo-recorder’ operates.
While the Law Dome accumulation record contrasts with the interior records, it shares some features in common with Taylor Dome, the only other coastal record of LGM accumulation. Taylor Dome also has a large accumulation change from LGM to Holocene and shows changes in maritime influence (Reference SteigSteig and others, 2000) that may be local or may, with Law Dome, reflect more generally increasing meridional transport during the Holocene period.
The low accumulation rates at Law Dome and Taylor Dome during the LGM reflect local climates much more like present-day central Antarctica. The results here suggest that glacial accumulation rates at Law Dome were closely tied to saturation vapour pressure, and hence temperature, again like central Antarctica.
At present, there is a significant lack of coastal Antarctic palaeoclimate records from the early Holocene and LGM, and these are needed to establish whether the changes observed at Law Dome and Taylor Dome are more widespread.



