I. INTRODUCTION
Elastic strains in passivated conductor lines have been studied by wafer curvature measurementsReference Yeo, Ho and Anderson1 and by x-ray diffraction (XRD) measurements on arrays of parallel lines,Reference Flinn and Chiang2–Reference Besser, Marieb, Lee, Flinn and Bravman4 yielding average strain values as a function of sample temperature or of thermal history. AnalyticalReference Eshelby5, Reference Korhonen, Black and Li6and finite element methods (FEM)Reference Sauter and Nix7, Reference Shen8 have also been used to predict thermal strains in passivated conductor lines. X-ray microbeam diffraction measurements have been used to determine spatially resolved elastic strains in conductor lines, sometimes on a grain-by-grain basis.Reference Wang, Cargill, Noyan, Liniger, Hu, Lee, Clement, Keller, Krisch, Sanchez and Suo9–Reference Zhang, Cargill, Ge, Maniatty and Liu12 In some cases, changes in conductor line strains resulting from temperature changes and relaxation have been measured and compared with FEM calculations.Reference Vinci, Zielinski, Bravman, Børgesen, Coburn, Sanchez, Rodbell and Filter13, Reference Vinci, Marib, Bravman, Townsend, Weihs, Sanchez and Børgesen14 In this article, results of x-ray microbeam deviatoric strain measurements in passivated Al and Cu conductor lines at room temperature (RT) and at elevated temperatures are described and are compared with limiting case models of equibiaxial and uniaxial thermal stress. Good agreement is found between the experimental results for elastic strains resulting from temperature changes and a uniaxial thermal stress model that incorporates full relaxation along line width and line thickness directions and partial relaxation along the line length direction of thermal stresses resulting from temperature changes.
II. SAMPLES
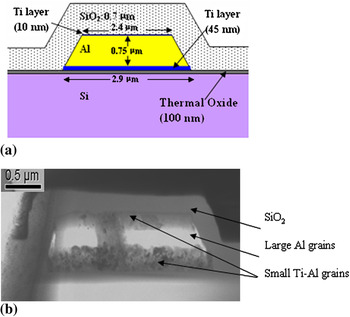
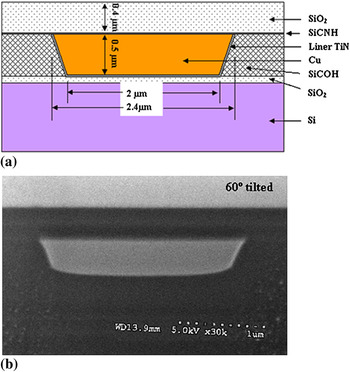
The Al conductor line samples were 30 μm long, 2.6 μm wide, and 0.75 μm thick, with Ti-rich top and bottom layers, as shown in Fig. 1 and described in Reference Reference Zhang, Cargill, Ge, Maniatty and Liu12. The transmission electron micrograph Fig. 1(b) shows that the conductor line consists of micron-size columnar grains of about 0.35 μm thickness. On the top and bottom surfaces of the large grain Al line are smaller (<100 nm) grain size polycrystalline layers, probably mixtures of Al and TiAl3, each about 0.2-μm thick. The Cu conductor line samples were made by electrodeposition and patterned by the dual damascene process using chemical mechanical polishing.Reference Steigerwald, Murarka and Gutmann15 Adjacent to and coplanar with the Cu conductor lines are layers of low-k SiCOH dielectric. A schematic cross section and a scanning electron micrograph of the line are shown in Figs. 2(a) and 2(b). Each line is 0.45-μm thick, 2-μm wide and 100-μm long. The SiO2 cap layer is 0.4-μm thick. The Al samples were held at 400 °C for 4 h during processing, but they were then stored at RT for several years before being used in this study. The Cu samples were also heated during processing, and they were held at 300 °C for 50 h, followed by 15 days storage at 10 °C and at RT, immediately before the x-ray measurements.
(a) Schematic cross section of the Al line before reaction of Ti and Al. (b) Cross section transmission electron micrograph after reaction of the Ti and Al.

(a) Schematic cross section of the Cu line. (b) Scanning electron micrograph of cross section.

III. X-RAY MICRODIFFRACTION METHODS
X-ray microbeam diffraction measurements were made at the Advanced Photon Source (APS) on beamline 34-ID, as described in Reference Reference Zhang, Cargill, Ge, Maniatty and Liu12. Each conductor line sample was on a ceramic chip carrier, which was mounted on an electrical heater. The samples could be scanned in three orthogonal directions to position the conductor line at the focus of the x-ray optics and to raster scan the area of the conductor line. Two Al conductor line samples with nominally identical structures were studied, one by white-beam Laue diffraction and another by monochromatic beam diffraction. Spatially resolved measurements of deviatoric strains and grain orientations were made in the white beam mode, and full elastic perpendicular strains were measured in the monochromatic mode. The x-ray beam size was about 0.5 μm for the white beam measurements and 1.0 μm for the monochromatic beam measurements. The step size of the raster was 0.5 μm across and along the line for white beam measurements, and 0.5 μm across the line and 1.5 μm along the line for monochromatic beam measurements. Each cycle of measurements required about 3.6 h in the white beam mode and about 5.5 h in the monochromatic mode. Only white beam measurements were made for the Cu samples.
Laue diffraction patterns were obtained at each measurement location from grains with various orientations. Grain-scale determination of the local crystal orientations and local deviatoric elastic strains was obtained by indexing and fitting the Laue patterns.Reference Ice and Larson16–Reference Tamura, MacDowell, Celestre, Padmore, Valek, Bravman, Spolenak, Brown, Marieb, Fujimoto, Batterman and Patel18 In some measurement locations, diffracted intensities were too weak, or too many grains were contributing, to allow reliable indexing, and so no grain orientations were determined for those locations. At some locations where orientations could be determined, there were too few indexed peaks, or peak shapes were too distorted, to allow reliable strain analyses, and so no strain values were determined for those locations.
The relationship between the deviatoric normal elastic strains  that are determined from the Laue patterns and the full normal elastic strains εxx,εyy,εzz is given by
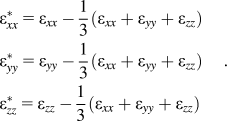
Note that  . In the coordinate system used to describe the strain components in the conductor lines, the x direction is across the width of the line, the y direction is along the length of the line, and the z direction is perpendicular to the top surface of the line.
The monochromatic beam diffraction at RT and at 190 °C provided spatially resolved measurements of the full perpendicular strain εzz for (111) oriented grains of the fiber-textured Al sample, as described in Ref. 11.
IV. GRAIN ORIENTATION AND STRAIN MEASUREMENT RESULTS
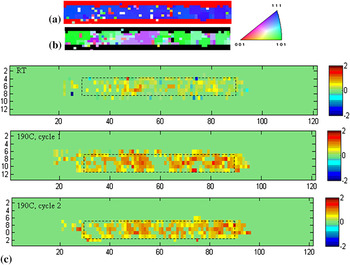
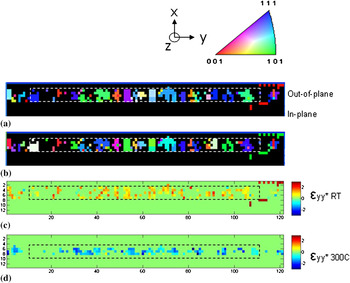
The out-of-plane and in-plane grain orientation maps for an Al conductor line are shown in Figs. 3(a) and 3(b), indicating that this line has a strong (111) fiber texture and a near-bamboo microstructure, with many grains spanning the width of the line. Grain orientation maps for the Cu conductor line shown in Figs. 4(a) and 4(b) indicate that this line also has a near-bamboo microstructure but without a strong fiber texture. In Figs. 3(b) and 4(b), the in-plane grain orientations are given with respect to the x direction, across the width of the lines.
(a) Out of plane and (b) in-plane orientation maps for Al conductor line.  (×10−3) strain maps for (c) room temperature (RT) and for 190 °C.

(a) Out of plane and (b) in-plane grain orientation maps for the Cu conductor line.  (×10−3) strain maps for (c) RT and (d) for 300 °C for Cu conductor line.

The RT strains for the Al conductor line were measured first and then the sample was heated to 190 °C and kept at this temperature for about 1 h. Two strain maps were then obtained at this temperature.
For the Cu conductor line, strain measurements were first made at RT, after the sample had been held at 300 °C for 50 h, at RT for 76 h, at 10 °C for 258 h, and at RT for 36 h. After these RT strain measurements, the sample was heated to 300 °C and held at this temperature for 10 h. The strain measurements were then made at 300 °C. About 1 h after cooling to RT, two further sets of strain measurements were obtained.
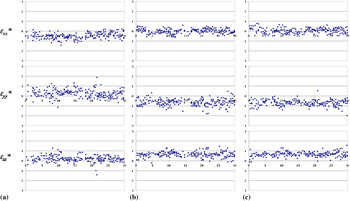
Maps of  strain for the Al conductor line are shown in Fig. 3(c) for RT and for the two repeated measurements at 190 °C. The distributions of deviatoric strains along the length of the Al conductor line are shown in Fig. 5 for RT and for the two measurements at 190 °C, respectively. The measured deviatoric strains of the line at both RT and 190 °C vary from point to point. These variations are due to the measurement uncertainty and to local microstructure variability, and possibly to varying local strain relaxation.
Distributions of deviatoric strains along the length of the Al conductor line (a) for RT and (b,c) for the two measurements at 190 °C. The unit of strain is 10−3. The measurement uncertainties, as described in Ref. Reference Zhang19, are about ±0.10 × 10⁻³ for each location.

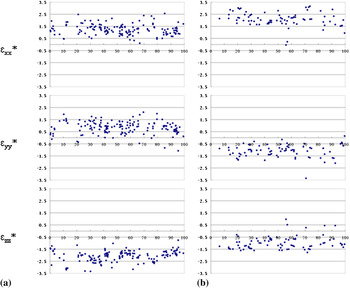
Maps of  strain for the Cu conductor line are shown in Fig. 4(c) for RT and in Fig. 4(d) for 300 °C. Strain distributions for the Cu conductor line are shown in Fig. 6 for the first RT measurements and for the 300 °C measurements.
Distributions of deviatoric strains along the length of the Cu conductor line (a) for RT and (b) for 300 °C. The unit of strain is 10−3. The measurement uncertainties, as described in Ref. Reference Zhang19, are about ±0.10 × 10⁻³ for each location.

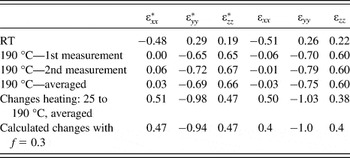
Averaged deviatoric strains for the Al and Cu lines at RT and at elevated temperatures are shown in Tables I and II. Strain values in Table I for the Al line for the sequential measurements at 190 °C are about the same, indicating that little strain relaxation occurred between these two measurements while the sample was held at 190 °C. The largest change on heating from RT to 190 °C for the Al line is in  , the strain along the length of the line, which is negative (compressive). The changes in the other two strain components,
 and
 , are smaller and about equal in magnitude, and both are positive (tensile). Using the average values of εzz from the monochromatic beam measurements, the measured average deviatoric strains for Al at RT and at 190 °C were converted to full elastic strains εxx, εyy, and εzz, which are also shown in Table I and are close in values to the corresponding deviatoric strains.
Average measured deviatoric strains  and full strains εij for Al lines from measurements at room temperature (RT) before heating and from two sets of subsequent measurements at 190 °C. The strain changes observed and calculated are also shown. The unit of strain is 10−3

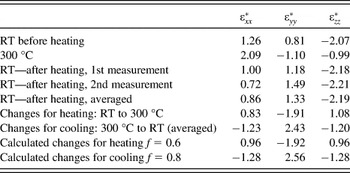
Average deviatoric strains for the Cu line from measurements at RT before heating, from measurements at 300 °C, and from two sets of measurements at RT after cooling from 300 °C. The strain changes observed and calculated are also shown. The unit of strain is 10−3.

Deviatoric strains for the Cu line show similar behaviors to those for the Al line. The largest change on heating from RT to 300 °C is in  , the strain along the length of the line, which is negative (compressive), and changes in the other two strain components,
 and
 , are smaller and about equal in magnitude, and both are positive (tensile). Changes in deviatoric strains observed for cooling from 300 °C to RT have opposite signs from those for heating, as expected, and the magnitudes are about 30% larger, indicating that less strain relaxation occurred during the cooling and measurements at RT than during the heating and measurements at 300 °C, also as expected. The changes in deviatoric strains between the first and second sets of sequential strain measurements made at RT after cooling from 300 °C are more difficult to understand, with
 becoming less positive and
 becoming more positive, whereas
 showed no significant change.
Thermal stresses and strains in conductor lines with lengths >> widths >> thicknesses are expected to approach those of blanket films, e.g., displaying equibiaxial stresses, with perpendicular strains related to in-plane strains by the film’s biaxial Poisson’s ratio.Reference Eshelby5–Reference Sauter and Nix7 Neither the Al nor the Cu lines in this study show this behavior, since from Tables I and II the two in-plane strain components  and
 are not equal, and except for the RT Cu data, they have opposite signs. Also, the changes in strains with changes of temperature,
 ,
 , and
 , do not have the signs expected for equibiaxial behavior.
V. COMPARISONS OF MEASUREMENT RESULTS WITH MODEL CALCULATIONS
One limiting case for the changes in strains with changes in temperature ΔT is that the conductor lines are stressed equibiaxially because of the difference in thermal expansion coefficients Δα between the conductor line metals, Al or Cu, and the substrate material, Si, because the passivation is relatively thin and provides negligible constraint. Another limiting case is that the conductor lines are stressed uniaxially, along their lengths because of the difference in thermal expansion coefficients, but not along their widths or thicknesses because the substrate and passivation are less confining along these directions. In both these limiting cases, constraining effects of the surrounding passivation materials are ignored.
For equibiaxial thermal stress, the resulting changes in full elastic strains are given by

and for uniaxial thermal stress,

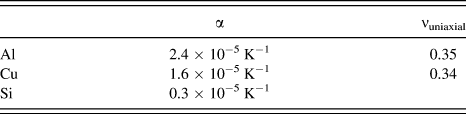
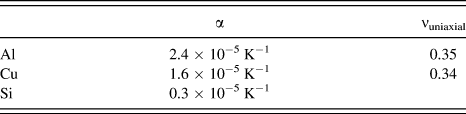
where ν uniaxial is the uniaxial Poisson ratio, ν biaxial is the biaxial Poisson ratio for Al or Cu, with 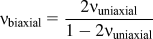 , ΔT = T final − T initial, and Δα = α Si − α Al or Cu. Values of α and ν uniaxial used in model calculations are given in Table III.
Thermal and elastic parameters used in the calculation of thermal strains.
The corresponding equations for changes in deviatoric strains are
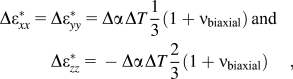
for equibiaxial stress, and
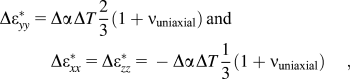
for uniaxial stress. It should be noted that this analysis assumes elastic isotropy, although individual grains of Al and Cu are elastically anisotropic with cubic symmetry. Al exhibits only mild elastic anisotropy, although the Al line is highly textured, the isotropic approximation is reasonable. Cu exhibits strong elastic anisotropy; however, the Cu line studied here was not highly textured. Although the anisotropy may lead to large grain-to-grain variability, the average overall behavior may be reasonably approximated as isotropic.
For heating, ΔT > 0 and Δα < 0, so ΔαΔT < 0. From Tables I and II, for both Al and Cu conductor lines,  < 0 and
 ≈
 > 0, which are better described qualitatively by the uniaxial thermal stress model than by the biaxial thermal stress model. In fact, Eq. (5) for deviatoric strains resulting from uniaxial thermal stress give deviatoric strain changes that are somewhat larger than observed experimentally using the thermal and elastic parameters from Table III. By incorporating a strain relaxation factor f in the uniaxial stress model, with f = 1 corresponding to no relaxation and f = 0 corresponding to complete relaxation, Eq. (5) becomes
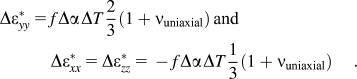
With f = 0.3, these equations closely reproduce the observed deviatoric strain changes for Al, as shown in Table I. Including the same strain relaxation factor in Eq. (3) closely reproduces the observed full strain changes in Table I. Similarly, with f = 0.6, the changes in deviatoric strain for Cu heating from RT to 300 °C are closely obtained, and with f = 0.8, the changes for cooling from 300 °C to RT are obtained, as shown in Table II.
Although the above model is able to characterize the change in strain associated with the change in temperature change, the substantial initial, deviatoric elastic strains in the lines, as seen in Figs. 5 and 6, are not captured by the model. Although both samples were prepared at elevated temperatures, the initial, observed strain fields are very different, with the Al line being tensile in  and
 and compressive in
 and the Cu line being tensile in
 and
 and compressive in
 , whereas the uniaxial model would predict being tensile in
 and compressive in
 and
 . Thus, the initial, elastic strain fields are not caused by the difference in thermal expansion alone. These initial, elastic, deviatoric strains are associated with “intrinsic” stresses that arise during the growth process.
VI. DISCUSSION AND CONCLUSIONS
It was surprising that thermal strains in these Al and Cu conductor lines with large width-to-thickness ratios of 3.5 and 4.4 are not close to those expected for equibiaxial thermal stress.Reference Eshelby5–Reference Sauter and Nix7 The changes in thermal strains observed on heating for Al, and on heating and cooling for Cu, are well reproduced by a model of uniaxial thermal stress acting along the length of the conductor lines, with partial stress relaxation. This agreement between experimental observations and model calculations suggests that stress transfer from the substrate and passivation to the conductor lines along the line widths and line thicknesses is negligible compared with stress transfer along the line lengths, which might result from weak bonding between the conductor lines and adjacent substrate and passivation materials. Vias at the ends of the conductor lines would couple differential thermal expansion stresses between the substrate and the conductor lines along the line lengths. These strains in the conductor lines resulting from differential thermal expansion between the lines and the substrates and passivation are referred to as “extrinsic” strains.
Nevertheless, the experimental results demonstrate that there are significant strains in the conductor lines along the line width and line thickness directions, which are apparently not the result of differential thermal expansion between the conductor lines and the substrate or passivation. These are the strains that are referred to as “intrinsic” and that may result from reactions between Al and Ti layers and between Cu and TiN layers and are little affected by temperature changes.
These results of strain measurements and model calculations indicate that strain in conductor line systems can be much more complex than cases usually treated in analyticalReference Eshelby5, Reference Korhonen, Black and Li6 and finite element calculations,Reference Sauter and Nix7, Reference Shen8 and that spatially resolved strain measurements by x-ray microdiffraction can be useful in investigating stress and strain interactions in such systems.
ACKNOWLEDGMENTS
We thank Dr. C.-K. Hu at the IBM T.J. Watson Research Center for useful guidance and for providing the Cu conductor line samples and Y. Ge from Rensselaer Polytechnic Institute for helpful discussions regarding the analysis. The Al samples were provided by the Intel Corporation. The XRD experiments were carried out on beamline 34-ID of the APS, Argonne National Laboratory, where Dr. W. Liu provided valuable assistance with the synchrotron x-ray microdiffraction measurements and data analysis. Use of the APS was supported by the United States Department of Energy, Office of Science, Office of Basic Energy Sciences, under Contract No. DE-AC02-06CH11357. The present research was supported at Lehigh and Rensselaer Polytechnic Institute by National Science Foundation, Grant DMR-0312189.