Statement of Research Significance
Research Question (s) or Topic(s): We report the development of a new behavioral inventory measure of executive functions for Thai adolescents, its psychometric properties, norms by sex and age, and differences by sex and age. Main Findings: This 42-item questionnaire assesses inhibitory control, working memory, cognitive flexibility, and their eight subcomponents. It has good psychometric properties. Female scored higher on inhibitory control and all its subcomponents than males. The largest age differences in executive functions were between 13 – 16 years and the least between 15 – 18 years. Self-control and verbal working memory showed the sharpest early improvement. The cognitive flexibility subcomponent, being able to change perspectives, showed the most change in later years of all EF variables. Study Contributions: This first inventory based on Diamond’s framework specifically designed to be culturally-appropriate for Thailand and cross-culturally. Our results closely align with findings from the West, suggesting cross-cultural universality in adolescents’ EF development.
Introduction
Executive functions (EFs) are neurocognitive skills that govern the goal-directed control of thought, emotion, and action, modulating attention and controlling behavior to enable more adaptive, planned, and focused action (Diamond, Reference Diamond2013; Zelazo, Reference Zelazo2015; Hendry et al., Reference Hendry, Jones and Charman2016; Cristofori et al., Reference Cristofori, Cohen-Zimerman and Grafman2019). EFs are essential skills for doing well at school and in the workforce, promoting psychosocial well-being, and for overall quality of life (Alloway & Alloway, Reference Alloway and Alloway2010; Cristofori et al., Reference Cristofori, Cohen-Zimerman and Grafman2019; Haenjohn, Reference Haenjohn2017, Reference Haenjohn2019; Haenjohn & Namyen, Reference Haenjohn and Namyen2023; Moffitt et al., Reference Moffitt, Arseneault, Belsky, Dickson, Hancox, Harrington, Houts, Poulton, Roberts, Ross, Sears, Thomson and Caspi2011; Toh et al., Reference Toh, Yang, Hartanto and Neupert2020). EF dysfunction can lead to learning difficulties and behavioral problems (Hammud et al., Reference Hammud, Avital-Magen, Schusheim, Barzuza and Engel-Yeger2023; McNeilly et al., Reference McNeilly, Peverill, Jung and McLaughlin2021; Riggs et al., Reference Riggs, Jahromi, Razza, Dillworth-Bart and Mueller2006; Yang et al., Reference Yang, Shields, Zhang, Wu, Chen and Romer2022). Researchers in developmental psychology, cognitive psychology, education, and neuroscience have increasingly focused on assessing EFs in children (Diamond, Reference Diamond, Griffin, McCardle and Freund2016; Miyake et al., Reference Miyake, Friedman, Emerson, Witzki, Howerter and Wager2000; Zelazo et al., Reference Zelazo, Blair and Willoughby2016) and adolescence (Blakemore & Mills, Reference Blakemore and Mills2014; Ferguson et al., Reference Ferguson, Brunsdon and Bradford2021) that are the periods of marked development improvement in higher cognitive abilities (Larsen & Luna, Reference Larsen and Luna2018).
The concept of EFs composed of three core components (inhibitory control [IC], working memory [WM], and cognitive flexibility [CF]) as proposed by Diamond (Diamond, Reference Diamond2013; Reference Diamond2020; Diamond & Ling, Reference Diamond, Ling, Novick, Bunting, Dougherty and Engle2019) has long been widely recognized and influential. Diamond defines IC as comprised of self-control (or response inhibition) plus interference control (which includes selective/focused attention and cognitive inhibition). Self-control is the capacity to resist strong pulls to respond a certain way or impulsively and instead give the more appropriate or considered response. Selective attention is the ability to ignore external distractions, whereas cognitive inhibition involves ignoring internal distractions (as one might see in mind-wandering or excessive rumination). WM involves mentally maintaining and manipulating information, such as mentally exploring ideas, linking one concept to another, reordering or updating information, reflecting on the past or future, performing mental calculations, or holding onto a question you want to ask while following an ongoing conversation. CF involves being able to view things from different perspectives, think innovatively, navigate unexpected obstacles, adapt to changes, and seamlessly shift between tasks (Diamond, Reference Diamond2013, Reference Diamond2020).
Diamond’s conceptualization has often been operationalized and measured through task-based assessments typically conducted in laboratory settings. Performance-based EF tasks typically use specially designed tool kits or are computerized. Examples of such tests include the Wisconsin Card Sorting Test, often used to assess CF and other aspects of EFs (Miles et al., Reference Miles, Howlett, Berryman, Nedeljkovic, Moseley and Phillipou2021; Barcelo et al., Reference Barcelo, Sanz, Molina and Rubia1997; Monchi et al., Reference Monchi, Petrides, Petre, Worsley and Dagher2001) and the Hearts and Flowers task, often used to assess IC and CF (Davidson et al, Reference Davidson, Amso, Anderson and Diamond2006; Wright & Diamond, Reference Wright and Diamond2014). Such methods provide direct measures of actual behavioral performance. However, these tasks assess performance on arbitrary tasks far removed from daily life. EF performance on such tests is confounded with speed of processing (since these are usually timed) and with anxiety associated with being tested. Further, the use of these tests is limited by the cost of the supplies and equipment needed and that they have normally been administered one-on-one limiting their scalability (although methods for administering them to groups are evolving, see, e.g., Meuwissen et al., Reference Meuwissen, Anderson and Zelazo2017; Obradović et al., Reference Obradović, Sulik, Finch and Tirado-Strayer2018; Rosas et al., Reference Rosas, Espinoza, Martínez and Santa-Cruz2022).
On the other hand, self-report measures, while limited by all the problems of subjective reporting, are often used as a part of neuropsychological assessments because of a number of factors: (a) they have more ecological validity than laboratory tests because they ask about behavior in everyday life (Barkley & Fischer, Reference Barkley and Fischer2011; Corneille & Gawronski, Reference Corneille and Gawronski2024), (b) they are easy to administer, often not requiring professional training to administer, (c) they are time-efficient, often requiring just a few minutes, and (d) they are suitable for large-scale or community-based research that requires large-scale and/or geographically-dispersed data collection (Hornsveld et al., Reference Hornsveld, Kraaimaat, Nijman, Roza, Nunes and Palmer2020). When they are provided for free, they are cost-effective as they do not require expensive equipment. The development of free or low-cost EF self-report or observational scales represents an important option that can facilitate broader population-level screening. Such tools can serve as preliminary indicators of EF-related concerns and might identify individuals who could benefit from further evaluation through professional clinical assessment.
There is presently no EF questionnaire based on Diamond’s framework, so the development of a scalable and accessible EF assessment instrument based on her framework seemed of importance for both research and applied settings. There is also no measure designed by Thai researchers for assessing EFs in Thailand. Western measures do not translate perfectly to Thai culture. For example, an item in the highly-respected and widely-used Behavior Rating Inventory of Executive Function (BRIEF) is: “My eyes fill with tears quickly over little things” (Gioia et al., Reference Gioia, Espy and Isquith2003). Such an item may not be culturally appropriate for Thai adolescents, as traditional Thai cultural norms place a strong emphasis on emotional restraint. Displays of sadness, such as crying, are generally discouraged, particularly among males. The present study sought to fill those two gaps, creating a measure based on Diamond’s framework appropriate for the Thai context. The measure is intended to be appropriate cross-culturally so items reflecting culturally-specific norms, such as emotional suppression or unquestioning obedience, were excluded, such as “I can always control my thoughts and feelings to avoid conflict” or “I always follow instructions from teachers without question.” The Behavioral Inventory Measure of Executive Functions (BIMEFs) was created as a collaboration between Thai researchers and Diamond. Unlike measures like the BRIEF, that are intended primarily for clinical use, the BIMEFs is intended for use by researchers, educators, and even parents. It fills a need not met by the BRIEF or other EF questionnaires in having an inexpensive, readily accessible instrument for these purposes. We administered the BIMEFs to 1,865 students (ages 12 – 18 years) all across Thailand, establishing nationwide norms for this measure at each of those ages and for boys and girls.
Conceptual framework
The schematic representation of EFs is shown in Figure 1. EFs have three separate core components: IC, WM, and CF. These core components are further divided into sub-components. IC includes both interference control (which includes cognitive inhibition and selective attention) and response inhibition (which includes self-control and discipline). WM includes both verbal and visual–spatial working memory. CF includes being able to see things from different perspectives, being able to seamlessly switch between tasks, and being able to think outside the box. These EF core components help to facilitate higher EFs, such as reasoning, problem solving, and planning (Diamond, Reference Diamond2013).
Conceptual framework of EFs.

Methods
The research was carried out in two phases. Phase I involved constructing a behavioral index of EFs appropriate for Thai adolescents. Phase II focused on collecting data using the newly constructed EF measure. The study was approved by the Ethical Committee of Burapha University and participants in both phases were treated according to standard ethical guidelines.
Phase I
Stage 1 of Phase 1: Constructing the preliminary BIMEFs for Thai adolescents and examining its internal consistency
Participants in Stage 1 of Phase 1: Participants here were an independent panel of five experts with expertise in neuroscience, psychology, child and adolescent psychiatry, statistics and measurement.
Procedure for Stage 1 of Phase 1: To develop the BIMEFs, operational definitions, behavioral indicators and items were iteratively refined to align with Diamond’s framework (Diamond, Reference Diamond2013). The interdisciplinary research team comprised of experts from various fields, including psychology, neuroscience, behavior science, and the science of education, collaboratively synthesized relevant concepts and engaged in extensive discussions to determine the operational definitions and indicators. After developing the operational definitions and indicators, the materials were submitted to Diamond, the originator of the conceptual framework, for an initial content validity review. Based on Diamond’s feedback, the research team held follow-up meetings to revise the items accordingly. The revised version was then resubmitted for her further review. This iterative process continued until no further modifications were recommended. Subsequently, the 75-item instrument was translated into Thai by an expert with strong proficiency in both the relevant subject matter and the Thai language. The resulting BIMEFs is an online self-assessment questionnaire administered via Google Forms. Supplementary Table 1 in the Appendix provides the operational definitions, behavioral indicators, and the 75 items included in the BIMEFs.
Then the independent panel of five experts evaluated the BIMEFs for content validity.
Results for Stage 1 of Phase 1: The independent panel indicated that all items demonstrated a satisfactory index of item-objective congruence (IOC) values (≥ 0.50). This suggests that each item demonstrated appropriate alignment with its corresponding construct, ensuring that the scale adequately represented the theoretical dimensions and fulfilled the measurement objectives. Items with IOC values below 0.50 were either removed or revised prior to re-evaluation.
Stage 2 of phase 1: examining the internal consistency of BIMEFs
Participants in Stage 2 of Phase 1: Participants here were 45 students (64% Female), ages 12 – 18 years, who were studying in Chonburi province, Thailand. Inclusion criteria included normal vision or corrected-to-normal vision with eyeglasses, ability to communicate in Thai, as confirmed by teachers; and voluntary consent to participate.
Procedure for Stage 2 of Phase 1: The initial version of BIMEFs consisted of 75 items. The number of items per subcomponents of IC was: Cognitive Inhibition (CI: 8 items), Selective Attention (SA: 8 items), Self-Control (SC: 8 items), and Discipline (DP: 8 items), for WM: Verbal WM (VWM:11 items) and Visual–Spatial WM (VSM:10 items), and for CF: Being Able to Change Perspectives (BCP: 6 items), Switching Between Different Mindsets or Tasks (SDM: 8 items), and Thinking Outside the Box (TOB: 8 items).
Respondents selected the item that best reflected their behavior using a four-point Likert scale: 1 = never, 2 = sometimes, 3 = frequently, and 4 = always. There were both positive and negative items to try to minimize response biases. By including a mix of positive and negative items, we hoped that respondents would consider the questions and not mindlessly always endorse the high or low rating. Scores for negative items were reversed in the data analyses. Thus, higher scores indicated better EFs.
Internal consistency reliability was assessed using Cronbach’s alpha coefficients. A threshold of ≥ 0.70 was established as acceptable. For any component with Cronbach’s alpha <0.70, the appropriateness of the item was re-examined, and item removal or revision was considered to enhance reliability of the measure. Item discrimination analysis using the total-item correlation (TIC) method was used to assess discrimination power. The criterion for acceptable discrimination was set at a correlation coefficient of ≥ 0.20.
Results for Stage 2 of Phase 1: The internal consistency reliability for Cronbach’s alpha for CI was 0.80, for SA: 0.86, for SC: 0.90, for DP: 0.84, for VWM: 0.95, for VSM: 0.90, for BCP: 0.94, for SDM: 0.83, and for TOB: 0.82. TIC revealed all items demonstrated satisfactory discrimination power. Corrected TIC coefficients were >0.20 for all items, indicating that each item was positively, and moderately to strongly, correlated with the total score of its respective EF subcomponent. Discrimination power was also examined using TIC with Pearson’s correlation coefficient to evaluate the extent to which each item effectively distinguished between individuals with higher and lower levels of each construct. Based on the results obtained, the number of items was reduced to 45 due to low and negative corrected item-total correlation (CITC) values, indicating a lack of internal consistency. The unidimensionality analysis revealed that each dimension exhibited multidimensional characteristics, clearly separating into positive and negative item dimensions. However, both dimensions were positively correlated (i.e., responses to negative and positive items were in the same direction). This suggests that the negatively-phrased items were less appropriate, at least for this adolescent population. Rather than re-phrasing items worded in the negative into positive terms, preserving the unique information the negatively-worded items asked about, all negatively-worded items were omitted; only positively-worded items were retained. In retrospect, we would have done this differently. The subsequent CFA results indicated that the 45-item model demonstrated a good fit within each component of the BIMEFs, as evidenced by acceptable fit indices: chi-square (4295, 933) = 4.60, adjusted goodness of fit index = 0.897, RMSEA = 0.044, CFI = 0.983, and SRMR = 0.043. These findings provide robust empirical support for the BIMEFs as a contextually appropriate instrument for assessing EFs among Thai adolescents. The research team then created a user manual for the BIMEFs.
Phase II: collecting data using the newly constructed EF measure
Participants in phase II
Participants here were 1,865 students (65% female), ages 12 – 18 years (% female: 62, 61, 66, 56, 70, 72, 63 respectively), who were studying in schools under the Office of the Basic Education Commission in Thailand. To reflect a national perspective, a nationwide sampling strategy was employed. A multi-stage random sampling technique was employed to ensure national representativeness. In the first stage, schools were selected from different regions of Thailand using simple random sampling. In the second stage, schools were further stratified by size (small, medium, and large) and selected using stratified random sampling. In the third stage, students from each selected school were randomly selected using simple random sampling. Inclusion criteria included normal vision or corrected-to-normal vision with eyeglasses, ability to communicate in Thai, as confirmed by teachers; and voluntary consent to participate. We did not exclude any participant based on any neurodevelopmental, psychiatric, or neurological disorders.
Procedure for phase II
In addition to administering the BIMEFs, general demographic information was collected from respondents also via Google Forms, including sex, grade level, and other relevant personal data such as whether they had ever been diagnosed with any mental health condition, such as attention-deficit/hyperactivity disorder or autism spectrum disorder, and whether they were currently taking any medications that might affect cognition.
The 45 items in the BIMEFs were distributed across nine subcomponents thusly: IC subcomponents (Cognitive Inhibition (CI: 3 items), Selective Attention (SA: 5 items), Self-Control (SC: 5 items), and Discipline (DP: 3 items)), WM subcomponents (Verbal WM (VWM:7 items) and Visual–Spatial WM (VSM:7 items)), and CF subcomponents (Being Able to Change Perspectives (BCP: 6 items), Switching Between Different Mindsets or Tasks (SDM: 6 items), and Thinking Outside the Box (TOB: 3 items)), as shown in Table 1.
Results of the item analysis, including discriminative power, measurement of consistency of each component, loading of components, loading squared of components, and residual of items, were obtained for BIMEFs in Thai adolescents. These results were obtained through EFA and CFA

Data analyses
CFA was conducted on the final set of 45 items for each subcomponent, EF component, and overall EFs to ensure the measurement model appropriately represented the theoretical structure underlying the EF framework. In evaluating model fit for CFA, several goodness-of-fit indices were used. Chi-square statistic (χ2) assesses overall model fit; however, it is sensitive to sample size and may indicate poor fit even with minor discrepancies. Therefore, additional indices were used: the comparative fit index (CFI, with values >0.90 indicating acceptable fit and values >0.95 representing excellent fit), root mean square error of approximation (RMSEA, which evaluates the degree of approximation in the population, with values <0.08 suggesting acceptable fit and values <0.05 indicating good fit), and standardized root mean square residual (SRMR, which reflects the average discrepancy between observed and predicted correlations, with values <0.08 indicating a good fit). Together, these indices provided a comprehensive assessment of the adequacy of the hypothesized model.
The interpretation of norm-referenced scores was based on normalized T-scores. T-scores are z scores times 10 with 50 added to the product of that, thus ensuring that no score is negative. The BIMEFs was scored as follows: First, the total score for each EF subcomponent was divided by the number of items for that subcomponent, then normalized T-scores were calculated for each EF subcomponent. Second, to arrive at the T-score for each EF component (IC, WM, and CF), the T-scores for each of its subcomponents was summed and then divided by the number of subcomponents. Third, the T-score for EFs overall was arrived at by summing the T-scores for IC, WM, and CF. (Since the number of BIMEFs items per subcomponent differed, summing across all individual items would have given disproportionate weight to subcomponents with more BIMEFs items.)
Since no sex by age interactions were significant, sex is not included in the analyses of age differences and age is not included in the analyses of sex differences reported here, thus results for univariate analyses only are presented here. To analyze sex differences, analysis of variance was used. To analyze differences by age and grade level, linear regression was used, conducted by DA. Pairwise comparisons were conducted between each age and each school grade. Given the number of analyses conducted, we only considered p-values of < .001 to be statistically significant.
Results for phase II
The results for the CFA from 1,865 high school students are presented in the Figure 2, the three-factor model demonstrated acceptable fit indices, supporting the adequacy of the proposed model. It shows good psychometric properties and sensitivity to age and sex differences.
However, omitting all the negatively-worded items had left only 3 items assessing the TOB subcomponent and their internal consistency was weak; including TOB weakened the results for CF. Thus, items assessing the TOB subcomponent were dropped, leaving a total of 42 items in the BIMEFs, which is what the analyses of national norms and results by sex, age, and grade level are based on.
The finding of confirmatory factor analysis of the BIMEFs in Thai adolescents.

The results for national norms are presented in Table 2, providing a standardized reference for interpreting individual scores.
The interpretation criteria of the BIMEFs according to the country norm-referenced criteria (standardized T-scores) for Thai adolescents

Analyses of BIMEFs responses from Thai adolescents by sex and age .
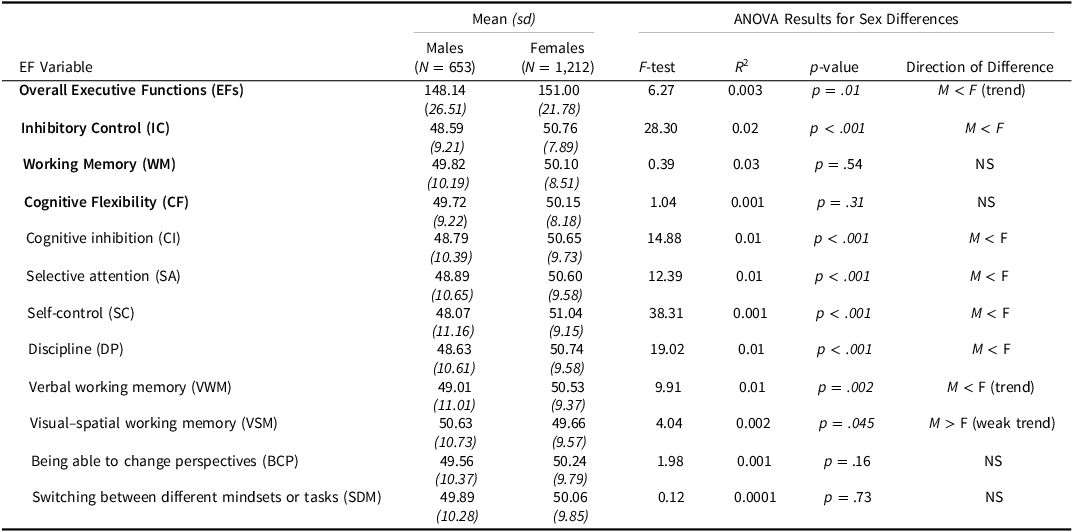
Female adolescents tended to report that they have better EFs overall than did male adolescents, but that did not quite reach statistical significance (see Table 3). For IC, however, the sex difference is clear and consistent. Females scored higher on IC (CI, SA, SC, and DP), and on all 4 subcomponents of IC, than did males. There was no sex difference for WM overall because the sex differences go in opposite directions for its two subcomponents. Females tended to report better VWM than males, while males tended to report better VSM than females (though the latter was only significant at p < .045). There was no sex difference for CF or any of its subcomponents.
Results of the analysis of variance comparing the EF performance of male and female Thai adolescents

Legend: sd = standard deviation, NS = not significant. Degrees of freedom for all rows are 1 for the numerator and 1,862 for the denominator.
We recruited the students from 7th to 12th grades of middle and high schools, ranging in age from 12 to 18 years old. Each grade includes a few children of a younger age (e.g., 20% of the students in Grade 7 in our study were 12 years old, the rest were 13 years old; similarly, 22% of the students in Grade 8 in our study were 13 years old, the rest were 14 years old, etc.) thus there were only a small number of students aged 12 years in our study. Therefore, the analyses by age were conducted starting from age 13, where the results were more reliable. For analyses of male–female differences (see Table 3) and of differences by grade level in school (see supplementary online table) all participants, including the 12-year-olds are included, and the means on each EF variable for children of 12 years are provided in Table 4, though readers are cautioned that given the small N for that age, the results for 12-year-olds should not be taken as robust indicators of the population mean.
Results of the linear regressions comparing the EF performance of Thai adolescents by age

Legend: sd = standard deviation. Degrees of freedom for all rows are 1 in the numerator and 1,805 in the denominator. All F-values are significant at p < .001. Only pairwise comparisons that were significant that p < .001 or indicated a trend (significant at p < .03 or less) are listed in the last column; unless otherwise noted the comparison was significant at p < .001. Note the very small number of 12-year-olds; for that reason they were not included in the regression analyses or graphs; the mean values provided for them here should not be taken as strong indicators of the population mean.
Results revealed a significant main effect of age on overall EFs (see Table 4). Indeed, all EF variables showed a significant main effect for age using BIMEFs (indicating that older children reported having better EFs than younger children). The final column in Table 4 presents results of pairwise comparisons between the different ages for EFs overall and each EF component and sub-component that were significant at p < .001 or showed a trend (i.e., were significant at p < .03). These pairwise comparisons show that students aged 13 years scored lower than students of any other age (from 14 through 18 years) on overall EFs, the EF components of IC and WM, and all of their subcomponents. For CF and its subcomponents (BCP and SDM), 13-year-olds reported significantly worse performance than students of 15, 16, 17, or 18 years, but only showed a trend to be worse than 14-year-olds (see Table 4).
For EFs overall, 14-year-olds scored lower than 18-year-olds and tended to score lower than 17-year-olds; from age 15 on there were no significant pairwise differences between ages. This indicates that, while self-reported EFs at age 13 were lower than for all other ages (even age 14), after that there was little self-reported difference in EFs overall in this sample.
For IC and its four subcomponents, there were no significant pairwise differences between students of 14 – 18 years, except for SC, where 18-year-olds scored significantly better than 14-year-olds. As the graphs in Table 4 illustrate, IC and its subcomponents tended to plateau after 14 years of age, especially the IC subcomponents that reflect attentional interference control (CI and SA). The age differences in SA were smaller than for the other IC subcomponents (CI, SC, and DP).
WM and its subcomponents showed rather continuous improvement from 13 – 18 years. Students of 14 years tended to report poorer WM than students of 16 or 18 years. The self-reported VWM of students of 14 years was worse than 16- and 18-year-olds, and tended to be worse than 17-year-olds. VSM tended to be worse among 14-year-olds than among 18-year-olds and seemed to plateau at 15 years. Younger students tended to report being poorer on VWM than VSM, so the slope for VWM as steeper than for VSM for ages 13 – 16.
Unlike EFs overall and IC, for CF there was only a tendency for 14-year-olds to score better than 13-year-olds, and improvements after 14 years were still evident at 16 and 17 years and especially at 18 years, suggesting that while self-reported IC improved sharply between 13 and 14 years and little thereafter, CF showed a more protracted development (see the graphs in Table 4). The CF subcomponent of BCP had the steepest slope from 14-18 years of all EF variables, and together with VWM showed the most pairwise differences between 14-year-olds and older children. Students age 14 were significantly worse at BCP than 16- or 18-year-olds and showed a trend to be worse than 17-year-olds. This is the only EF variable where 15-year-olds showed evidence of performing worse than older children; they scored worse than 18-year-olds and tended to score worse than 17-year-olds. SDM seemed to plateau at 15 years. There was so much individual variation in scores on the BIMEFs, however, that neither age nor sex accounted for more than 3% of the variance for any EF component or subcomponent.
We thought that Thai educators might want to see our results by grade level, so those results are presented in Supplementary Table 2. Those results, which include all students even the 12-year-olds, closely mirror the results by age. Like the regressions by age, the regressions by grade level were significant for EFs overall, all EF components, and all EF subcomponents. Scores for students in Grade 7 were lower for EFs overall, IC, WM, all four IC subcomponents, and both WM subcomponents than students in any other grade from 8 – 12 (just as 13-year-olds scored significantly worse than all older ages [14-18] on those same variables).
Unlike the results for IC differences by age, where no differences were found between ages 14-18 except on SC where 18-year-olds scored higher than 14-year-olds, IC tended to be better (according to self-reports) in Grade 10 than Grade 8 and in Grade 12 compared with Grade 9. And, not only was SC better in Grade 10 than Grade 8, DP tended to better in Grade 10 than Grade 8 and in Grade 11 compared with Grade 9.
WM also showed more improvements continuing past the youngest grade than it showed past the youngest age (perhaps because the youngest age in the age analyses [age 13] spanned Grades 7 and 8). WM tended to be better in Grade 10 than Grade 8 and in Grades 11 and 12 compared with Grade 9. VWM was better in Grade 10 than Grade 8 and tended to be better in Grades 11 and 12 compared with Grade 9. VSM showed a tendency to better in Grade 11 than Grade 9. These WM, VWM, and VSM results map well onto the differences by age observed.
On CF, 7th graders only tended to score worse than 8th graders, just as 13-year-olds only a tended to perform worse than 14-year-olds. Scores in Grade 8 tended to be lower than in Grade 10, and scores in Grade 9 tended to be lower than in Grades 11 and 12, consistent with the protracted development of CF seen over age. Unlike all other EF variables, SDM showed no difference in Grade 7 versus Grade 8 and although Grade 7 scores were significantly lower than in Grades 9, 10, and 12, they only tended to lower than in Grade 10. Just as BCP showed the clearest and strongest differences by age, the same was true for differences by grade level (see Supplementary Table 2).
Overall discussion
EFs are critical for school and career success. This study (a) developed a self-report measure, the BIMEFs, based on Diamond’s model of EFs, to assess EFs among Thai adolescents, (b) established norms for interpreting performance of Thai adolescents on this measure, and (c) investigated EF differences by sex and grade level among Thai adolescents as revealed by the measure.
General comments about the BIMEFs
The final version of the BIMEFs has 42 items across eight subcomponents (four for IC, two for WM, and two for CF). It contains only positive items because in pretesting the BIMEFs positive and negative items were positively correlated, suggesting that Thai adolescents did not seem to be accurately understand the negative items. Our CFA results, which found three main components to EFs (inhibition, updating/WM, and shifting/CF), are in line with previous research (e.g., Miyake et al., Reference Miyake, Friedman, Emerson, Witzki, Howerter and Wager2000).
Correlation analyses showed stronger relationships between a few subcomponents of different EF components than between subcomponents of the same EF component (e.g., DP [a subcomponent of IC] correlated more highly with VWM [a subcomponent of WM] and with BCP [a subcomponent of CF]) than with other IC subcomponents). This pattern raised the possibility of a latent “general factor” underlying EFs. Results from higher-order CFA and bifactor modeling, however, indicated that, although a general EF factor accounted for a substantial proportion of the shared variance, domain-specific components (WM, IC, and CF) retain significant unique variance. This is consistent with the results of several other factor analyses of EFs (Demetriou et al., Reference Demetriou, Kazali, Spanoudis, Makris and Kazi2024; Lehto et al., Reference Lehto, Juujärvi, Kooistra and Pulkkinen2003). These findings support the conclusion that the BIMEFs captures both a global EF construct and separable subdomains. Those subdomains may potentially be of clinical or developmental relevance. The authors readily acknowledge that the factor structure of EFs warrants further study.
Although both the BRIEF and BIMEFs assess IC, CF and WM, the BRIEF does not have some items found in the BIMEFs. For example, the following items in the BIMEFs have no corresponding items in the BRIEF: for SA: “I focus on the workload that I am working on without letting noise in the room bother me,” for VWM: “ I am able to mentally put information I hear in the correct and sequential order,” and for VSM:“I can mentally calculate the distance to know which route is longer or shorter.” The BRIEF and other EF questionnaires also contain far less coverage of CF than does the BIMEFs.
The BRIEF and other EF questionnaires also contain components that most people would not consider to be EFs. Indeed, at least one of the authors of the BRIEF, Isquith, freely admits that the components, Organization of Materials, Initiate, and Emotional Regulation of the BRIEF are not part of EFs. Rather, these constructs reflect more behavioral outcomes of EFs. Further, to quote Isquith: “Of interest, most of the other EF scales have copied the Initiate scale and Organization of Materials scale without considering whether or not they are actual executive functions. They just followed our lead…. EF affects emotion regulation and emotions affect EF” (personal communication, March 10, 2018). Similarly, while the Comprehensive Executive Function Inventory (CEFI, Naglieri & Goldstein, Reference Naglieri and Goldstein2013) includes scales for WM, IC, and CF, it also includes scales for organization, initiation, emotion regulation, self-monitoring, and for the higher-order EFs of planning and problem-solving. Our results are in line with other international assessment of EFs using questionnaire measures, such as the BRIEF-P (Gioia et al., Reference Gioia, Espy and Isquith2003), BRIEF-SR (Guy et al., Reference Guy, Isquith and Gioia2004), BRIEF-A (Roth et al., Reference Roth, Isquith and Gioia2005) and BRIEF2 (Gioia et al., Reference Gioia, Isquith, Guy and Kenworthy2015) that EFs consist of both a global EF construct and separable subdomains.
Discussion of Results for Age and Sex Differences using the BIMEFs
Females tended to report better EFs than males. The largest sex differences in EFs were for IC. Female adolescents scored significantly higher on IC and on all four of its subcomponents than male adolescents. Females tended to show better VWM than males and males showed a weak tendency to show better VSM than females. There were no sex differences in CF or any of its subcomponents. There are no significant sex X age interactions.
These findings on sex differences in IC and WM are consistent with the literature. For example, Tetering et al. (Reference Tetering, Laan, Kogel, Groot, Jolles and Slobodskaya2020) found that females aged 13 – 16 self-reported better SA and SC than did their male peers. Haenjohn (Reference Haenjohn2017) also found that females of 11 – 13 years reported better EFs generally than their male peers, and better IC and its subcomponents than their male peers at 14 – 18 years age. In their meta-analysis and systematic review, Gaillard et al. (Reference Gaillard, Fehring and Rossell2021) found females (across ages) show better SC and DP than males, and that males show better VSM than females. In their meta-analysis, Voyer et al., Reference Voyer, Voyer and Saint-Aubin2017 found evidence of a small male advantage in VSM (consistent with our finding of a small male advantage there). They found that this sex difference first appears in the age group 13 – 17 years. In a separate meta-analysis and systematic review, Voyer et al. (Reference Voyer, Saint Aubin, Altman and Gallant2021) found evidence for a small female advantage in VWM, again consistent with our finding of a small female advantage there and with the first author’s finding (Haenjohn, Reference Haenjohn2017) of better self-reported VWM among female adolescents versus males. We were not able to find any reports of a sex difference in CF or its subcomponents, consistent with our finding of no sex differences there.
For EFs overall, all three EF components, and all eight subcomponents scores were higher for older adolescents than younger ones, except that for many of these variables there was a small dip at 17 years (most marked for SC, and not evident for CI, BCP, or SDM). We have no explanation for the dip at 17 years and had not expected it. It deserves further study to see if it is just an accidental finding or reflects something more serious. By far the biggest and most consistent differences were between the self-reported performance of 13-year-olds and children of 14 – 18 years; 13-year-olds performed worse than all other ages on EFs overall, the EF components of IC and WM, and all of their subcomponents. IC seemed to plateau earliest (after age 14). Differences in self-reported EFs between those of ages 14 – 18 were minimal, with VWM and BCP being notable exceptions, suggesting that these two EF subcomponents continued to show significant developmental improvements at older ages than other EF subcomponents. Students of 13 and 14 years tended to report more similar performance on CF and its subcomponents than they did for IC or WM or their subcomponents, indicating perhaps less improvement in CF and its subcomponents between our two youngest ages than for other EF variables, with developmental improvements in CF and its subcomponents coming a bit later. BCP, together with VWM, showed the most pairwise differences between students of 14 – 18 years of any EF variable and BCP showed the steepest slope from 14 – 18 years. It was the only EF variable where significant improvement after age 15 was found as evidenced by pairwise comparisons between 15-year-olds and 17- and 18-year-olds. SC and VM showed the steepest slopes from 13 – 15 years of all EF variables.
These findings are consistent with the large literature using laboratory tasks where behavioral performance was directly assessed showing that older children and adolescents have better EFs than younger children and adolescents (e.g., Best & Miller, Reference Best and Miller2010; Folker et al., Reference Folker, Bertrand, Hong, Steinberg, Duell, Chang, Giunta, Dodge, Gurdal, Junla, Lansford, Oburu, Pastorelli, Skinner, Sorbring, Bornstein, Tirado, Yotanyamaneewong, Alampay and Deater‐Deckard2025; Larsen & Luna, Reference Larsen and Luna2018; Luna, Reference Luna2009; Luna et al, Reference Luna, Garver, Urban, Lazar and Sweeney2004). Although many EF skills begin to develop during childhood, they still undergo refinement and further improvement during adolescence (Best & Miller, Reference Best and Miller2010; Diamond, Reference Diamond2013; Luna, Reference Luna2009). Notably, Best, Miller, and Naglieri (Reference Best, Miller and Naglieri2011) found that in a large representative national sample in the US that performance on three complex EF tasks improved until age 15 but not after, just as we found that in our large national Thai sample that EFs overall improved from age 13 to 15 but no pairwise differences between ages were after age 15. Similarly, studies have found that IC and its subcomponents improve over the age range in our study (e.g., Aïte et al., Reference Aïte, Cassotti, Linzarini, Osmont, Houdé and Borst2018; Constantinidis & Luna, Reference Constantinidis and Luna2019; Huizinga et al., Reference Huizinga, Dolan and van der Molen2006; Lamm et al., Reference Lamm, Zelazo and Lewis2006), but that performance on many IC measures plateaus by the early teens (e.g., Igazság et al., Reference Igazság, Demetrovics and Cserjési2019), just as we found it plateaued early in the present study. WM has also been found to improve over the age range studied here, although the evidence is clearer for this from neuroscience studies than from purely behavioral studies where performance tends to show marked improvements between 14 – 15 years and then plateau (Anderson et al., Reference Anderson, Anderson, Northam, Jacobs and Catroppa2001; Conklin et al., Reference Conklin, Luciana, Hooper and Yarger2007; Igazság et al., Reference Igazság, Demetrovics and Cserjési2019; Kwon et al., Reference Kwon, Reiss and Menon2002; Prencipe et al., Reference Prencipe, Kesek, Cohen, Lamm, Lewis and Zelazo2011; Scherf et al., Reference Scherf, Sweeney and Luna2006). Consistent with our finding that self-reported VSM was better than self-reported VWM at 13 years, Conklin et al. (Reference Conklin, Luciana, Hooper and Yarger2007) found that performance in early adolescence was better on VSM tasks than on VWM ones. Much as we found here, performance on behavioral tasks indicates that cognitive flexibility tends to take the longest time to improve, often not plateauing until 18 – 19 years (Igazság et al., Reference Igazság, Demetrovics and Cserjési2019; Klenberg et al., Reference Klenberg, Korkman and Lahti-Nuuttila2001; Piper et al., Reference Piper, Li, Eiwaz, Kobel, Benice, Chu, Olsen, Rice, Gray, Mueller and Raber2012). A further similarity between our findings and those of others using behavioral measures is the finding of significant individual differences in EFs of young people of the same age (e.g., Folker et al., Reference Folker, Bertrand, Hong, Steinberg, Duell, Chang, Giunta, Dodge, Gurdal, Junla, Lansford, Oburu, Pastorelli, Skinner, Sorbring, Bornstein, Tirado, Yotanyamaneewong, Alampay and Deater‐Deckard2025).
Limitations and future research
The present study lacked information about the children’s home environment such as socioeconomic status (e.g., parents’ levels of education, parents’ occupations) or their levels of stress. As these factors have been shown to affect EFs, future research using the BIMEFs should consider collecting that information.
Our study included almost twice as many females as males although in Thai grade schools as well as high schools there are roughly equal numbers of male and female students. Since participation in our study was completely voluntary, the higher representation of females may reflect their greater willingness to fill out our rather long questionnaire. This raises a potential concern that the subset of males who participated might potentially differ in some systematic way from the males who did not.
The final version of the BIMEFs was refined from the initial 75 items down to 42 items through careful item selection and validation processes, but we did not conduct further item reduction analyses and did not construct, and then test out, positively worded versions of all 30 negatively-worded items that were omitted. We acknowledge these shortcomings and that inclusion of positive versions of the five negatively-worded items for TOB might have resulted in better internal consistency for TOB and that subcomponent then being retained in our analyses. We consider refinement of BIMEFs an important direction for future research to further optimize the scale’s efficiency and accuracy while maintaining its psychometric robustness.
We did not investigate whether the factor structure differed by age or sex, nor has the BIMEFs been tested with clinical populations to determine whether it effectively differentiates between patients and typically-developing children. Such work will be important to do in the future.
A comprehensive, realistic assessment of EFs in daily life should not be limited only to self-report measures, like the BIMEFs, as these measures are inherently subjective. Self-report measures correlate poorly with performance on behavioral tests, which probably reflects shortcomings in both approaches. Given that, it is worthwhile to administer both to get a fuller picture of any individual or population. We note, however, that in broad outline our results map on quite well to those from studies of EFs using behavioral tests with the same age group. We also note that while offering free tools is commendable in many respects, it raises an ethical concern about the potential misuse of such tools in a hasty or irresponsible manner without adequate clinical or psychometric training.
Conclusions
The BIMEFs represents a first in being 1) an EF questionnaire based on Diamond’s framework, 2) an EF measure designed for adolescents in Thailand, and 3) an EF measure developed by Thai researchers. Western measures do not translate perfectly to Thai culture. For example, “My eyes fill with tears quickly over little things” is not culturally appropriate for Thai adolescents, as traditional Thai culture places a strong emphasis on emotional restraint. Created to hopefully be appropriate across many cultures, explicitly omitted in the BIMEFs are items reflecting culturally-specific norms, such as emotional suppression or unquestioning obedience.
The BIMEFs has been shown to be sensitive to age and sex differences. It showed that among adolescents in Thailand between the ages of 13 to 18 years, the biggest improvements in self-perceived EFs are between 13 – 16 years and the least are between 15 – 18 years of age. SC, VM, and BCP showed the largest improvements over age and BCP showed the most protracted, being the only variable to show significant differences between 15-year-olds and older adolescents. Since the results obtained here map on quite well to results obtained both with objective behavioral measures and with questionnaire measures in the US, Europe, and Australia, it suggests cross-cultural universality in the development of EFs. Efforts were made in the design of BIMEFs for it to be appropriate for use in other cultures besides Thailand. It can be used for research purposes to evaluate EFs among adolescents, to plan programs in schools or elsewhere to address EF challenges adolescents in that community report, or as a preliminary screening tool (or general screening tool) for the risk of EF impairment among adolescents, indicating those most likely to need to further undergo full standard clinical evaluations and diagnosis.
Supplementary material
The supplementary material for this article can be found at https://doi.org/10.1017/S1355617725101550.
Acknowledgements
We greatly appreciate the effort and time devoted by school staff, parents, and secondary school students to assist in this research. We would also like to thank our team members and assistants for their help with recruiting participants and collecting data.
Authors contribution
JH conceptualized the study and acquired the funding; JH, WS, and JN designed the study; JH, WS, and JN curated the data and materials; JH, WS, and SC collected the data; ST, SC, and JH participated in data analyses and interpretation; JH, JN, and SC participated in writing the manuscript. Canadian team: DA analyzed the Phase 2 data; AD played a major role in writing the Introduction, Methods Section, Results of Phase 2, and the Discussion, and in choosing the initial 75 BIMEFs items, but no role in Phase 1 factor analyses or culling of BIMEFs items. All authors have read and approved the manuscript.
Funding statement
This research study was supported by the Brain, Mind, and Learning Research and Development Unit, Faculty of Education, Burapha University, Thailand. During this project, Adele Diamond was partially supported by a Canada Research Chair Tier 1 (CRC #950-27472) from the Canada Excellence Research Chairs Program.
Competing interests
The authors declare that they have no conflicts of interest with respect to the authorship or publication of this article.
Ethics approval
The study was approved by the Ethical Committee of Burapha University (IRB2-104/2565). The participants were treated according to the standard ethical guidelines of the Declaration of Helsinki.
Consent to participate
Informed consent was obtained from all individual participants included in the study.
Consent for publication
Not applicable.
Availability of data and materials
All data generated or analyzed during this study are included in this published article.
Code availability
Not applicable.