The periparturient period is one of the most critical periods in the productive life of a dairy cow characterised by an increased susceptibility to diseases (Trevisi et al. Reference Trevisi, Zecconi, Bertoni and Piccinini2010). This has been attributed to negative energy balance (NEB) and the associated immune suppression at the puerperal period (Waldron & Revelo, Reference Waldron and Revelo2008; Hiss et al. Reference Hiss, Weinkauf, Hachenberg and Sauerwein2009). During this periparturient period, immune suppression increased serum levels of metabolic and endocrine markers such as prostaglandins (Yuan et al. Reference Yuan, Farney, Mamedova, Sordillo and Bradford2013), cortisol, ketone bodies (for example α-butyric acid) and non-esterified fatty acids (NEFA) occur. Hypoglycaemia and hypocalcaemia have also been defined as markers of metabolic stress during this period in dairy cows (Waldron & Revelo, Reference Waldron and Revelo2008; Esposito et al. Reference Esposito, Irons, Webb and Chapwanya2014). Further studies have also shown inflammatory markers such as the acute phase proteins, haptoglobin (Hp) and serum amyloid A (SAA) to be increased in maternal serum during the periparturient period (Trevisi et al. Reference Trevisi, Amadori, Cogrossi, Razzuoli and Bertoni2012) while these acute phase proteins are known to be elevated in serum and milk during mastitis (Eckersall et al. Reference Eckersall, Young, Nolan, Knight, McComb, Waterston, Hogarth, Scott and Fitzpatrick2006).
Earlier, Morimatsu et al. (Reference Morimatsu, Watanabe, Yoshimatsu, Fujinaga, Okubo and Naiki1991) demonstrated an increase in bovine serum C-reactive protein (CRP) associated with onset of lactation in Holstein cows. Furthermore Schrödl et al. (Reference Schrödl, Krüger, Hien, Füldner and Kunze1995) identified CRP in bovine colostrum and milk, and suggested this could be passively transferred to the serum of colostrum fed calves (Schroedl et al. Reference Schroedl, Jaekel and Krueger2003). In humans CRP is a major APP and has been shown to be increased in serum at the post-partum period which has been attributed to the trauma associated with childbirth, with concentration dropping back to baseline values by the 5th day post-partum (Fetherston et al. Reference Fetherston, Wells and Hartmann2006).
It is well established that colostrum and milk in the immediate post-partum period contains a large repertoire of immunological proteins such as immunoglobulin G (IgG). In addition, the APP, M-SAA3 (McDonald et al. Reference McDonald, Larson, Mack and Weber2001) and alpha-1 glycoprotein (AGP) (Ceciliani et al. Reference Ceciliani, Pocacqua, Provasi, Comunian, Bertolini, Bronzo, Moroni and Sartorelli2005), have been observed to be elevated in colostrum and this has been suggested to be due to physiological roles of these proteins in providing immunity to infectious diseases for the new-born. Hiss et al. (Reference Hiss, Weinkauf, Hachenberg and Sauerwein2009) also showed that Hp is high in milk of metabolically stressed transition dairy cows when the concentration of Hp in weekly milk samples was determined in the periparturient milk for up to 12 weeks post-partum.
Mastitis is one of the prevalent conditions in dairy cows, which arises most frequently during the periparturient period, compared to at any other period of the life of a dairy cow (Waldron & Revelo, Reference Waldron and Revelo2008). The use of APP in milk is gaining prominence as markers for mastitis diagnosis in dairy cows; therefore it would be of value to evaluate their concentrations in the periparturient period so that any change due to an intramammary infection (IMI) can be identified. Due to the fact that the immediate post-parturient milk (colostrum) contains high concentrations of immune related proteins, there is a challenge in readily diagnosing new infections in the mammary gland with regards to differentiating the physiological from the pathological increases of marker proteins but it is not clear if the APP are present in this milieu. Understanding the physiological change, if any, in the milk APP concentrations during the periparturient period so that pathophysiological conditions can be identified would allow prompt identification of new mastitis cases developing in postpartum udders/quarters in order to readily initiate treatment. Accordingly, the hypothesis was tested that APP such as Hp, M-SAA3 and CRP are present in colostrum and milk following parturition, potentially affecting the diagnosis of mastitis in dairy cows during this period. The hypothesis was tested by determining the concentrations of the APP in milk samples collected from cows calving on a commercial dairy farm. Changes in the high abundance protein of milk during this period were observed for comparison by electrophoresis.
Materials and methods
Sample collection
Daily quarter milk samples were collected from Holstein-Friesian cows, starting from the first milking immediately following parturition and then daily during morning milking for up to 10 days post-partum. Cows were from a commercial dairy farm in the west of Scotland (Cochno Research Farm, University of Glasgow) and comprised all cows calving within a period of 6 months (January to June, 2013). The cows were fed a total mixed ration (TMR) and had lactation number (parity) from 1 to 4. Approximately 15 ml milk was collected from each udder quarter after discarding the first strips of milk following teat disinfection. The sample collection procedure has been described in Thomas et al. (Reference Thomas, Waterston, Hastie, Parkin, Haining and Eckersall2015). Samples were stored at −20 °C until analysed with a maximum of 4 weeks storage before Hp assay but with up to 6 months for M-SAA3 and CRP assays due to assay kit availability.
Twenty four (24) cows calved within the 6 months study period on the farm; however, 2 cows were excluded from analyses due to systemic condition requiring veterinary treatments. Haptoglobin was analysed in milk samples collected from individual quarters (n = 84, four cows lacked one functional quarter each) of each of the 22 calving cows, daily for the 10 day duration of sampling. Out of 22 cows whose milk samples were analysed, 1 cow had missing samples for day 10, while another for days 2 and 7–10. Daily composite milk samples were derived by mixing equal volumes from the daily quarter samples collected for each cow and were assayed for Hp, M-SAA3 and CRP. Samples were stored at −20 °C and for assay were thawed at room temperature, thoroughly mixed by vortexing and diluted in the respective assay/wash buffer for Hp, M-SAA3 and CRP (n = 22/d for 10 d). Haptoglobin was assayed in all individual quarter milk samples (n = 575) due to the availability of a relatively affordable in-house ELISA, compared to commercial kits that had to be purchased for assay of M-SAA3 and CRP which were therefore only assayed in composite samples. The study was approved by the ethics committee of the University of Glasgow, School of Veterinary Medicine.
Acute phase protein assays
Haptoglobin; Purified rabbit anti-bovine haptoglobin IgG (Life Diagnostic Inc., West Chester, USA) was conjugated to alkaline phosphatase (ALP) (Innova biosciences) according to the manufacturer's instructions. Sandwich ELISA procedure was carried out as described by Thomas et al. (Reference Thomas, Waterston, Hastie, Parkin, Haining and Eckersall2015).
Mammary associated serum amyloid A3: Tridelta Development Ltd supplied the Phase™ Range SAA ELISA kit (sandwich ELISA kit for measuring multispecies SAA, Phase™ Range by Tridelta Development Ltd (Kildare, Ireland) and performed as described in Thomas et al. (Reference Thomas, Waterston, Hastie, Parkin, Haining and Eckersall2015).
C-reactive protein: Cow C-reactive protein (CRP) ELISA kits for assay of milk CRP were supplied by the Life Diagnostics Inc. (West Chester, USA). The assay was based on a solid phase sandwich ELISA format, and comprised of primary anti-bovine CRP antibodies immobilised to the wells of a 96-well microtitre plate and secondary antibodies against the anti-bovine CRP conjugated to horse radish peroxidase (HRP) and performed as described in Thomas et al. (Reference Thomas, Waterston, Hastie, Parkin, Haining and Eckersall2015).
1 & 2 dimensional gel electrophoresis
Daily composite milk samples (day 1–10) of calving cows were run on 1DE SDS PAGE as described by Braceland et al. (Reference Braceland, McLoughlin, Tinsley, Wallace, Cockerill, McLaughlin and Eckersall2014) to identify changes in the high abundance proteins of milk. Day 1 sample (colostrum) and day 10 milk were each resolved on 2DE SDS PAGE as described by Braceland et al. (Reference Braceland, Bickerdike, Tinsley, Cockerill, Mcloughlin, Graham, Burchmore, Weir, Wallace and Eckersall2013) to further depict the transition from colostrum to milk.
Western blot
Quarter samples from a cow that showed irregular fluctuation in APP content in the days post calving, were examined by Hp western blotting following 1DE.
Briefly, 1DE was carried out as described above after which the proteins on the gels were blotted onto a nitrocellulose membrane (NCM) as described in Braceland et al. (Reference Braceland, McLoughlin, Tinsley, Wallace, Cockerill, McLaughlin and Eckersall2014) using IgG fraction of rabbit anti-bovine Hp conjugated to alkaline phosphate (Thomas et al. Reference Thomas, Waterston, Hastie, Parkin, Haining and Eckersall2015) for incubation and Pierce™ NBT/BCIP (Thermo Scientific, UK) to develop the colour of Hp bands (Braceland et al. Reference Braceland, McLoughlin, Tinsley, Wallace, Cockerill, McLaughlin and Eckersall2014).
Statistical analyses
Tests for normality were carried out on all APP data using the Kolmogorov–Smirnov and Shapiro–Wilk tests along with normal probability plots and quantile–quantile (Q–Q) plots and Spearman's rho test was used to assess the correlation between the 3 APP using the statistical package for social sciences (SPSS) software version 21 (IBM SPSS, Portsmouth, UK). The daily milk sample APP concentrations were found to be not normally distributed and A non-parametric test (Mann Whitney) was employed to determine the days after parturition that the composite milk APP became significantly different from values in milk collected on day 10 using Minitab 17, Minitab Ltd., Coventry UK. A P value of <0·05 was considered significant.
Results and discussion
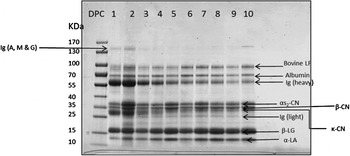
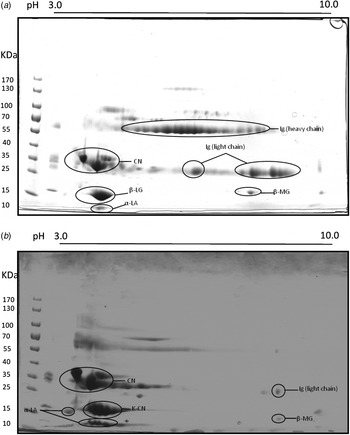
The investigation of the APP in colostrum as it changed to milk has found APP are present in colostrum but within a few days their concentration is reduced to minimal levels. To put this in context of the concurrent changes in high abundance milk proteins, Fig. 1 shows the SDS–PAGE gel of daily milk samples with the proteins identified by comparison to published gel images and Mw reports (Jovanovic et al. Reference Jovanovic, Barac, Macej, Vucic and Lacnjevac2007; Edwards & Jameson, Reference Edwards, Jameson, Singh, Boland and Thompson2014; O'Mahony, Reference O'Mahony, Singh, Boland and Thompson2014). The progressive reduction of IgG and albumin in composite samples from and during the first 10 days post parturition and the increase in α-lactalbumin, β lactoglobulin and lactoferrin was apparent. This was also demonstrated by the comparison of composite milk samples from day 1 and day 10 post parturition on 2 DE (Fig. 2a, b) which also are in agreement with the known proteomes of colostrum and milk (Hogarth et al. Reference Hogarth, Fitzpatrick, Nolan, Young, Pitt and Eckersall2004; Hernandez-Castellano et al. Reference Hernandez-Castellano, Almeida, Castro and Arguello2014). These electrophoretic separations demonstrate the change in high abundance protein of colostrum as it converts to milk (Hernandez-Castellano et al. Reference Hernandez-Castellano, Almeida, Castro and Arguello2014) and also show the inability of this approach to identify low abundance proteins including the APP so that measuring changes in their concentration in colostrum or milk needs more sensitive methodology such as the immunoassays used in this investigation.
1DE reducing gel electrophoretogram of immediate post-partum milk samples (day 1–10) pooled from healthy udder of cow A. Ig (immunoglobulin), Bovine Lf (bovine lactoferrin), αS2-CN (alpha S2 casein), β-CN (beta casein), κ-CN (kappa casein), β-LG (beta lactoglobulin), α-LA (alpha lactalbumin), DPC (days post-calving), kDa (kilo Dalton).

(a) 2DE reducing gel of pooled (quarters) colostrum (day 1 post-calving) sample. Isoelectric range pH 3–10, from one representative calving cow of Cochno Dairy farm. Abundant spots of Ig (heavy and light chain) are seen which is characteristic of colostrum. Ig (immunoglobulin), CN (caseins), β-LG (beta lactoglobulin), α-LA (alpha lactalbumin), β-MG (beta-2 microglobulin). (b) 2DE reducing gel of pooled (quarters) day 10 post-calving milk samples. On a pH 3–10 range strip. Less Ig spots are seen here compared to the colostrum samples 2DE. Ig (immunoglobulin), CN (caseins), κ-CN (kappa caseins), β-LG (beta lactoglobulin), α-LA (alpha lactalbumin), β-MG (beta-2 microglobulin).

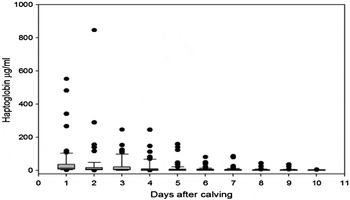
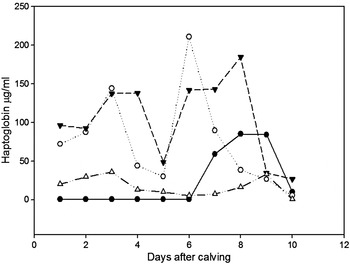
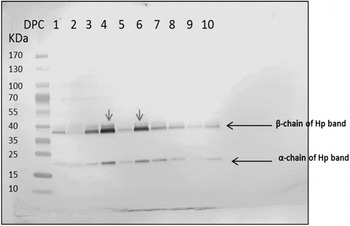
Therefore it was by using an ELISA that the concentration of Hp in individual quarter milk samples could be quantified revealing a pattern of progressively decreasing median values of Hp concentration in milk with days post-calving (Fig. 3). The median concentration of Hp in individual colostrum/milk after calving fell from 13·5 µg/ml on day 1 to 4·9 µg/ml on day 4 and thereafter remained at 3–4 µg/ml until day 10. When examining the individual quarter milk samples this pattern was followed in 63 out of the 84 quarters (75%) examined. In 8 of the quarter milk samples the Hp was >200 µg/ml on day 1–4 which would be equivalent to levels found in milk from quarters with IMI caused by Escherichia coli or Arcanobacterium pyogenes where median levels of 244 and 440 µg/ml respectively have been found (Pyorala et al. Reference Pyorala, Hovinen, Simojoki, Fitzpatrick, Eckersall and Orro2011). Among the quarter milk samples that did not show this general pattern, 4 quarters had undetectable Hp in all samples (day 1–10 post calving) while two other patterns of variations were observed in the remaining 17 quarters. There were 4 quarter milk samples in which Hp increased above the levels found on days 1–3 post-calving instead of dropping in concentration. These quarters are possibly developing IMI or undergoing other forms of inflammatory stimulus that can influence the occurrence of an acute phase response (APR) but in this retrospective study it was not possible to confirm the presence of IMI. However, monthly SCC assessments indicated that all of the cows sampled were mastitis free. There were also quarters (n = 13) with irregular fluctuations in Hp concentration but with a general downward trend with 4 of these shown in Fig. 4. The Hp western blot (Fig. 5) of an individual quarter's samples show the lower Mw α subunit and the higher Mw β subunit of Hp decreasing, though with some fluctuation during the day 1–10 post calving period, confirming the immunoassay results.
Hp concentrations in individual quarter milk samples from day 1 to day 10 post parturition (median, 25th & 75th percentile as boxes, 10th & 90th percentile as whiskers and outliers).

Hp concentration in quarter milk in 4 dairy cows showing fluctuations within the day 1 to day 10 post calving period.

Western blot on milk from day 1–10 post-calving stained with an IgG fraction of rabbit anti-bovine Hp conjugated to alkaline phosphate.

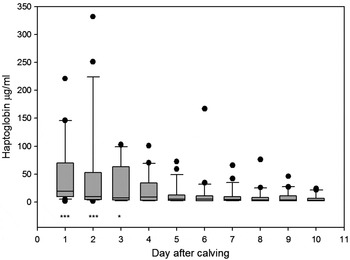
In the composite milk samples, Hp was moderately high (median 19·6 µg/ml, n = 22) in the first days post-calving milk (colostrum), and gradually dropped within 3–5 d after parturition to a median of 5·2 µg/ml on day 5, (n = 22) (Fig. 6). By day 4 the median concentration of Hp had dropped and was not significantly different from that of day 10 samples. These were equivalent to the range of Hp in composite milk samples found on a commercial dairy farm (Thomas et al. Reference Thomas, Waterston, Hastie, Parkin, Haining and Eckersall2015) which had a median of 3·46 µg/ml and a range of 0·4–55·46 µg/ml. Composite milk Hp has been found to be raised to 101 µg/ml in cows with chronic sub-clinical mastitis (Gronlund et al. Reference Gronlund, Hallen Sandgren and Persson Waller2005) so that up to day 3 after calving the concentration of Hp is equivalent of cows with such a level of infection. Experience of monitoring Hp in milk of cows in an experimental S. aureus mastitis model has shown that concentrations in the region of >150 µg/ml are found (Eckersall et al. Reference Eckersall, Young, Nolan, Knight, McComb, Waterston, Hogarth, Scott and Fitzpatrick2006). Thus in the first days post-calving the expression and secretion of Hp can in some cows be in the same order as during mastitis.
Concentrations of daily Hp (median and range) from day 1–10 post-calving composite milk samples (n = 22). Asterisks indicate significant differences from day 10 post calving by the Mann-Whitney test at *P < 0·05; **P < 0·01; ***P < 0·001.

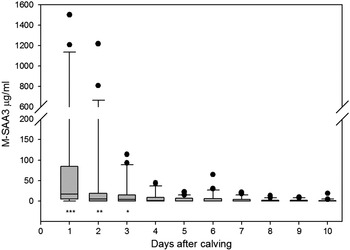
Individual milk samples were not assayed for M-SAA3 but similar to Hp in composite milk, an elevated median M-SAA3 concentration in composite milk was observed for day 1 and 2 (medians of 17 and 5 µg/ml respectively) which was significantly higher than values for day 10 milk and fell as the days progressed reaching by day 4, levels which was not significantly different from day 10 milk M-SAA3 (Fig. 7). The medians for day 1 and 2 are in the same order as composite milk from cows with sub clinical mastitis where concentrations up to 25 µg/ml were described (Gronlund et al. Reference Gronlund, Hallen Sandgren and Persson Waller2005). By day 10 the MSAA3 concentrations were equivalent to composite milk samples found on a commercial dairy farm (Thomas et al. Reference Thomas, Waterston, Hastie, Parkin, Haining and Eckersall2015) which had a median of 1·17 µg/ml and a range of 0·6–50·13 µg/ml. The moderately raised levels of M-SAA3 observed in composite milk on day 1–3, are also consistent with the reports by McDonald et al. (Reference McDonald, Larson, Mack and Weber2001) where elevated levels of M-SAA3 in bovine colostrum significantly dropped by day 4 post-calving. Similar to the observations for Hp, the concentration of M-SAA3 in colostrum is above the basal level in healthy milk and is comparable, allowing for the dilution effect of composite milk to quarters with mastitis, in which the concentration of M-SAA3 can be >100 µg/ml (Eckersall et al. Reference Eckersall, Young, Nolan, Knight, McComb, Waterston, Hogarth, Scott and Fitzpatrick2006). The concentration of M-SAA3 is known to reduce on storage at −20 °C by around 20% within 7 d (Tothova et al. Reference Tothova, Nagy, Seidel and Kovac2012) but thereafter to stabilise so that the concentrations here, measured after around 6 months of storage may be affected. However all samples were stored similarly and the relative change in M-SAA3 post parturition can be accepted.
Concentrations of daily M-SAA3 (median and range) from day 1–10 post-calving composite milk samples (n = 22). Asterisks indicate significant differences from day 10 post calving by the Mann-Whitney test at *P < 0·05; **P < 0·01; ***P < 0·001.

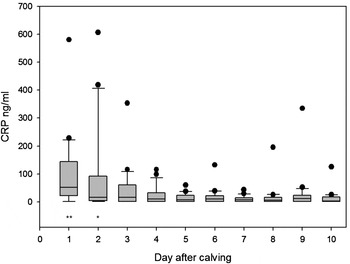
Milk CRP was found to have similar aspects to Hp and M-SAA3 in post-calving composite milk, by being raised on the first 1–3 d and then gradually falling to the concentration found in healthy cows (Fig. 8) (Thomas et al. Reference Thomas, Waterston, Hastie, Parkin, Haining and Eckersall2015). By day 3, the milk CRP concentration was not significantly different from day 10 with concentrations falling within the range for healthy milk samples as observed in Thomas et al. (Reference Thomas, Waterston, Hastie, Parkin, Haining and Eckersall2015) which had a median of 24·56 ng/ml. and a range of 1·8–172 ng/ml. The findings on milk CRP confirms the reports of Schroedl et al. (Reference Schroedl, Jaekel and Krueger2003) of the presence of CRP in bovine colostrum. According to Lee et al. (Reference Lee, Hsiao, Wu, Lin, Lee, Fung, Chen, Chen and Chu2003) bovine serum CRP levels correlated with lactation status, being highest during peak lactation period (2–4 months of pregnancy) while in the study of Zimmermann et al. (Reference Zimmermann, Neumann, Kruger, Furll and Elze1998) plasma CRP in cows were increased post-partum. However, there have been no previous reports of the daily variation of CRP in bovine milk from the day of parturition to 10 days after.
Concentrations of daily CRP (median and range) from day 1–10 post-calving composite milk samples (n = 22). Asterisks indicate significant differences from day 10 post calving by the Mann-Whitney test at *P < 0·05; **P < 0·01; ***P < 0·001.

Previous studies have reported increases in APP in serum during the first week(s) post calving (Uchida et al. Reference Uchida, Katoh and Takahashi1993; Alsemgeest et al. Reference Alsemgeest, Jonker, Taverne, Kalsbeek, Wensing and Gruys1995; Humblet et al. Reference Humblet, Guyot, Boudry, Mbayahi, Hanzen, Rollin and Godeau2006), but few studies have investigated the effect of parturition on different milk APP (McDonald et al. Reference McDonald, Larson, Mack and Weber2001; Ceciliani et al. Reference Ceciliani, Pocacqua, Provasi, Comunian, Bertolini, Bronzo, Moroni and Sartorelli2005). The concentration of serum Hp in this period has been used to show the presence of stress the cow is undergoing as part of the parturition process. Variations in milk Hp, M-SAA3 and CRP at this early post-partum period could help to assess for presence of new post-calving IMI. The elevated level of the APP in milk in the first few days post calving suggests a role for them in colostrum by conferring maternal protection to the new born. On the other hand, it may be due to the stress induced by parturition and its effects extending to the mammary gland. It was found that the major pattern observed for these APP during the post-partum period, followed a similar trend to that observed for milk somatic cell counts (SCC) in the studies of Barkema (Reference Barkema1999) and Sargeant et al. (Reference Sargeant, Shirley, Pulkrabek, Lim and Leslie2001) in the early lactation period. This observed pattern of SCC could explain the Hp pattern, as studies have shown that somatic cells such as neutrophils are a major source of the Hp found in milk (Lai et al. Reference Lai, Tsao, Lu, Lee, Zhao, Chien and Mao2009).
The source of the APP seen in the post parturient milk was not identified in this study, but there have been reports of local synthesis of Hp (Hiss et al. Reference Hiss, Mielenz, Bruckmaier and Sauerwein2004) and M-SAA3 (McDonald et al. Reference McDonald, Larson, Mack and Weber2001) in the mammary gland tissue. There are no reports on the source of CRP in bovine milk, and it is possible that the CRP in colostrum and milk arise either from passive transfer from the circulation, or from local production in the mammary gland.
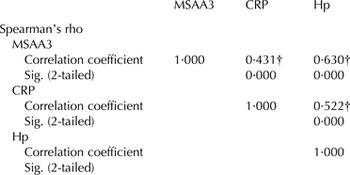
The milk concentration of Hp, M-SAA3 and CRP when compared in composite milk samples from the 22 cows showed significant correlations between samples (Table 1). Although there was a general similarity in the distribution of the 3 APP, small differences were also observed, for example, CRP fell back to basal levels more rapidly (day 4) than M-SAA3 (day 5) and Hp (day 6). Median concentration in CRP showed a late (day 9) increase in 2 samples which affected the median/range results. On a practical issue for application of the APP as biomarkers of post-parturition stress in the mammary gland, the Hp ELISA being in-house-developed assay was more economical for analysis of all individual quarter samples, whereas the M-SAA3 and CRP assays were limited to the composite samples. Extending the investigation of individual quarter samples to all of the APP would be valuable especially to assess their sensitivity and specificity for IMI and if multiplex immunoassay could be developed to allow detection of all APP in one sample. The use of composite milk dilutes the concentration of APP as seen here with the maximum Hp being over 800 µg/ml in quarter milk and 350 µg/ml in composite milk. It is likely that the concentrations of M-SAA3 and CRP in individual quarter samples would have been higher than the levels found in composite milk.
Correlation between Hp, MSAA3 and CRP in composite milk from cows (n = 22) over 10 time points (day 1–10)

† Correlation is significant at the 0·01 level (2-tailed).
Other milk APP have been identified as being high in colostrum and decrease in milk post calving such as alpha-1 acid glycoprotein (Ceciliani et al. Reference Ceciliani, Pocacqua, Provasi, Comunian, Bertolini, Bronzo, Moroni and Sartorelli2005), lactoferrin and transferrin (Sanchez et al. Reference Sanchez, Aranda, Perez and Calvo1988). However to the best of our knowledge this is the first report of daily variation in the levels of Hp, M-SAA 3 and CRP in colostrum and milk over the first 10 d immediately after parturition. A recent report has demonstrated the variation in many low abundance proteins of post-parturient milk using a proteomic approach (Zhang et al. Reference Zhang, Boeren, Hageman, van Hooijdonk, Vervoort and Hettinga2015) and demonstrated changes in haptoglobin and SAA1 and SAA3 (equivalent to M-SAA3 reported here) but CRP was not detected.
The finding that Hp, M-SAA3 and CRP are raised in colostrum and milk during the first few days post calving, would mean that caution should be used in the interpretation of results in using them for detecting IMI during this period in a dairy cow's cycle. However, APP assay will be valuable for detecting new IMI in the periparturient period, after the first few days (4th day) after calving when a drop in APP would be expected in the absence of IMI. It would be interesting to compare the APP profile in cows/udders developing new IMI during the immediate parturition period with the profile observed in 80% of cows from this study which were mastitis free. This would probably better highlight differences that could enhance the value of use of APP in recognising new IMI post-partum, and should be a subject for future research. There was individual variation in the concentration of the APP in the individual and composite samples with, for a number of samples, the concentration of APP in colostrum being as high as in mastitis. Whether there is any advantage in having a high level of APP in the colostrum to the calf or to the cow would be worthy of further investigation. Adoption of the APP assays to a rapid measurement format will be required before they can be generally used. Indeed a rapid test for any of the APP may be a better cow-side test for IMI than CMT in detecting the host response to major-pathogen mastitis in the immediate postpartum period (Dingwell et al. Reference Dingwell, Leslie, Schukken, Sargeant and Timms2003).
In conclusion, moderately elevated concentrations of Hp, M-SAA3 and CRP have been found in colostrum and milk in the post parturient period. The concentrations of the APP fall to basal levels by the 4th day post calving. High or increasing levels of these biomarkers beyond the 4th day post calving could be suggestive of an on-going or a new IMI and could enhance current diagnostic procedures for this condition.
The help of Mr Ian Cordner and the Cochno Dairy management during the sample collection is acknowledged. PhD studentship funding from Federal University of Agriculture Abeokuta/Tetfund is also acknowledged.