INTRODUCTION
In semi-arid areas of the world with a Mediterranean-type climate, high temperature and drought stress are among the two most important environmental factors influencing yield processes when wheat enters the grain-filling period. In south-east Europe, which is subject to Mediterranean weather patterns, there is a tendency of rising air temperature in the critical winter wheat growing period (April–June) to be combined with decreases in precipitation (Morgounov et al., Reference Morgounov, Huan, Lang, Martynov and Sonder2013). Other authors have also indicated that the prevalence and intensity of drought and heat stress during reproductive processes (e.g. pollination and fertilization) and grain filling are expected to increase and will be limiting factors in crop production under future climate scenarios in dry agricultural areas of southern and central Europe (Döll and Flörke, Reference Döll and Flörke2005; Dubrovsky et al., Reference Dubrovsky, Svoboda, Trnka, Hayes, Wilhite, Zalud and Hlavinka2008; Trnka et al., Reference Trnka2011). Drought conditions during anthesis and grain filling commonly occur in combination with heat stress, which affects grain set and the duration of grain filling. Of the yield components of wheat, grain numbers were more sensitive than grain weights to heat stress and less sensitive to drought when exposed to these stresses from heading to maturity (Prasad et al., Reference Prasad, Pisipati, Momcilovic and Ristic2011).
Positive turgor in the plant is essential to maintain growth. As water availability in the soil profile decreases, so eventually does turgor, and therefore growth. Less growth means less biomass at the time of seed development to support grain filling, so less yield either because of smaller seeds, or (if the stress occurs earlier in plant development) then fewer seeds. The key, therefore, to maintain yield under water or increasing osmotic stress conditions is to maintain growth until grain filling starts and then, if the stresses continue during grain filling (a typical scenario in Mediterranean environments), to ensure that as much dry matter as possible already in the plant is remobilized to support grain filling. Remobilization of assimilates is an active process that involves translocation of stored carbohydrate reserves from the vegetative organs (stems, sheaths and spikes) to the growing grains (Abbad et al., Reference Abbad, Jaafari, Bort and Araus2004; Gupta et al., Reference Gupta, Kaur and Kaur2011; Zhang et al., Reference Zhang, Sui, Li, Su, Li and Zhou1998). In wheat, much of the pre-anthesis carbohydrates (largely fructans) stored in stem and sheaths can be reallocated (70–92%) to the grain under post-anthesis drought stress (Yang et al., Reference Yang, Zhang, Wang, Zhu and Liu2001a).
Improving the ability to store and remobilize stem carbohydrates to grain is an important breeding criterion in wheat programmes targeted to regions with frequent post-anthesis drought (Blum, Reference Blum1998; Dreccer et al., Reference Dreccer, Van Herwaarden and Chapman2009). Several authors reported genetic variability in wheat for both the capacity to accumulate reserves in vegetative organs (Ruuska et al., Reference Ruuska, Rebetzke, Van Herwaarden, Richards, Fettell, Tabe and Jenkins2006; van Herwaarden and Richards, Reference Van Herwaarden and Richards2002) and the remobilization efficiency of previously stored assimilates (Ehdaie et al., Reference Ehdaie, Alloush, Madore and Waines2006a; Lopez Castaneda and Richards, Reference Lopez Castaneda and Richards1994). The mobilization of stem reserves to the grains can be estimated on individual plants by monitoring the changes in stem dry weight (Cruz-Aguado et al., Reference Cruz-Aguado, Rodés, Pérez and Dorado2000; Ehdaie et al., Reference Ehdaie, Alloush, Madore and Waines2006a) or directly by measuring the changes in water-soluble carbohydrate content during the grain filling period (Blum et al., Reference Blum, Sinmena, Mayer, Golan and Shpiler1994; Ehdaie et al., Reference Ehdaie, Alloush, Madore and Waines2006b). The availability of stem reserves in wheat during grain filling under drought can be screened by bleaching the leaves shortly after anthesis so that photosynthesis is stopped (Blum, Reference Blum1983; Regan et al., Reference Regan, Whan and Turner1993). Under these conditions, grain filling has to rely upon mobilization of stem reserves.
In present study, we used physical leaf blade removal (defoliation) as an alternative to chemical desiccation to evaluate grain weight susceptibility to reduced source current photosynthesis amongst a range of wheat genotypes. Our objectives were to: (i) assess the contribution and mobilization efficiency of stem dry matter reserves to the variation of grain weight under stress during grain filling; (ii) describe the association between grain weight and various agro-physiological traits and their influence on resistance to post-anthesis stress; and (iii) compare F4:5 families (FAM), which had been crossed to combine typical breeding traits, with standards and parents for terminal stress resistance.
MATERIALS AND METHODS
Genotypes
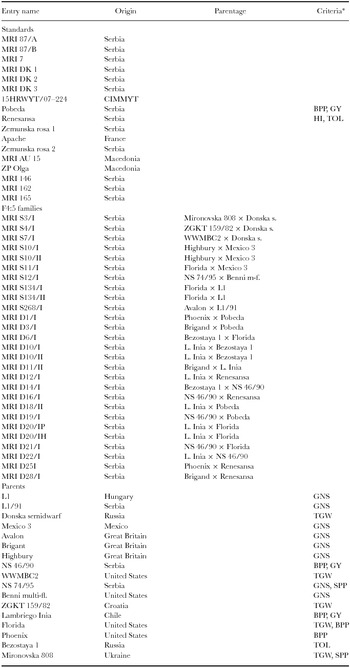
Sixty-one winter and facultative wheat (T. aestivum L.) cultivars and breeding lines were used in this study. The experimental material comprised three groups: standard genotypes (STA) (consisting of 17 entries), FAM (consisting of 27 entries) and parent genotypes (consisting of 17 entries). STA represented cultivars or advanced breeding lines which are used by wheat breeders at Maize Research Institute in Zemun Polje (MRIZP) as standards for grain yield and other agronomic traits such as plant height, flowering time and disease resistance. Two of these genotypes, Pobeda and Renesansa, are also used by the Serbian Variety Commission as standards in official trials. FAM representing selected crosses that were made between selected genotypes on the basis of data on trait-increasing SSR alleles for markers associated with the three key yield components (spikes/plant, grains/spike and thousand grain weight (TGW)) and traditional phenotypic breeding criteria (grain yield, plant biomass, harvest index (HI) and drought tolerance). Progenies of crosses were taken through to F4 (2010–11) and F5 (2011–12) seeds, keeping only those lines that were phenotypically adapted on the basis of medium height, early/medium flowering date, large grains and good disease resistance. Parents (PAR) were the genotypes used for crosses and were included only in the second year of the trials. Data for two genotypes Pobeda and Renesansa were included to calculate means both for STA and PAR groups as they are both wheat standards and parents for some crosses. Genotype names, origin, parentage and criteria for crosses are given in Table 1.
The identity (name and origin) of the 61 genotypes analysed along with parentage for F4:5 families and criteria for crosses.

*Crosses were made between selected genotypes on the basis of initial marker locus-trait associations (SPP = spikes/plant, GNS = grains/spike, TGW = thousand grain weight) or traditional phenotypic breeding criteria (BPP = biomass per plant, HI = harvest index, GY = grain yield, TOL = tolerance do drought).
Field trials
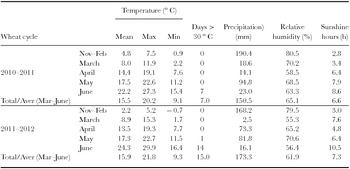
The trials were conducted at MRIZP experimental station, north Serbia (44°52′N and 20°19′E, 82 m ASL) during two growing seasons (2010–11 and 2011–12). The site is of moderate continental climate, with cold winters and hot and dry summers. Summarized meteorological data for the winter wheat crop cycle in spring (March–June) is provided in Table 2. Daily maximum, minimum and mean temperatures, number of days with maximum temperature over 30 °C, precipitations, relative air humidity and sunshine hours were recorded from the nearest weather station of Republic Hydrometeorological Service of Serbia (approx. 5 km from the experimental site). The soil was a slightly calcareous Chernozem, with 3.0% organic matter and a pH of 7.0.
Meteorological data for two wheat cycles, Zemun Polje, Serbia.

Genotypes were planted in late October and harvested starting late June the following year. This corresponded with the typical winter wheat season in the region. Each plot consisted of ten 1-m-long rows, spaced at 20 cm, with a seeding rate of 450 seeds m−2. To prevent reduction of reserve accumulation and storage capacity in stems, plants were additionally irrigated during March, April and early May (the end of stem elongation). Plots were irrigated manually when water in the top 0.75 m of soil had declined to less than 50% of field capacity. Defoliated plants (DP) had all leaf blades cut off 10 d after anthesis (10 DAA), around the start of the rapid grain filling phase. The treatment simulates a drought stress by inhibiting current assimilation (Blum et al., Reference Blum, Mayer and Golan1983). Control plants (CP) were left intact. Standard agronomic practices were used to provide adequate nutrition and keep plots free of pests, diseases and weeds.
Measurements
The genotypes were scored for 21 developmental, productivity and physiological traits including anthesis date (DTA), maturity date (DTM), flag leaf chlorophyll content (CHL), flag leaf area (FLA), stem height (SH), peduncle length (PDL), peduncle extrusion (PDE), peduncle share (PDS) in stem length, penultimate length (PNL), penultimate share (PNS) in stem length, stem specific weight (SSW), biomass/main stem (BMS), spikelets/spike (SPS), grains/spike (GNS), grains/spikelet (GNSL), thousand grain weight (TGW) harvest index (HI), stem reserve contribution (SRC), stem reserve mobilization efficiency (SRME), grain filling rate (GFR) and grain weight/spike (GWS). Fifteen uniform plants flowering on the same day from interior rows within each plot were tagged for sampling. Five tagged plants were sampled at 10 d after anthesis (10 DAA) and the remaining 10 plants at physiological maturity (five per treatment). All observations and measurements were based on the main stem. Data for traits measured before or immediately after leaf blade removal, are pooled from both plants labelled to be control and defoliated (i.e. considered to have only CP treatment).
Days to anthesis and maturity were estimated from 1st January to 50% anther extrusion and when the flag leaf and spike turned yellow, respectively. Flag leaf chlorophyll content and FLA (leaf width × leaf length × 0.75) were measured at anthesis, using a self-calibrating chlorophyll meter (SPAD 502, Konica-Minolta, Japan) and a ruler, respectively. Stem length, PDE (flag leaf node to base of the ear), PDE (flag leaf ligule to base of the ear), and penultimate (the internode below the peduncle) length were measured immediately after sampling at 10 DAA. Peduncle and penultimate share was calculated as the ratio of their length to stem length. Dry mass of main stem and its spike (above ground biomass) were measured at 10 DAA and at full maturity, after plant material had been oven dried at 70 °C for 48 h. Leaf blades were removed from non-defoliated plants before measuring biomass to be comparable with DP. Stem specific weight (linear density) was calculated as the ratio of its dry weight to its length at anthesis. The number of spikelets per spike, GNS, GNSL, HI (grain weight/total stem weight), TGW and GWS were measured after harvesting plants at maturity. Yield per plant was not considered as defoliation, did not significantly affect fertile ear number per plant (mean treatment difference 0.02 ears).
The amount of mobilized dry matter from stem to grain was estimated as the difference between stem weight at 10 DAA and maturity. Based on this, SRC to grain yield was estimated as the proportional contribution (%) of mobilized stem reserves to grain weight. SRME was estimated as the proportional contribution (%) of mobilized stem reserves to stem weight at 10 DAA. Average filling rate per kernel was estimated as kernel weight at maturity divided by duration (expressed as growing degree days), assuming that grain weight is zero at anthesis. Cumulative growing degree days, from anthesis to physiological maturity, were calculated as: a sum of average daily temperatures ((max+min)/2) − base temperature. A base temperature of 0 °C was assumed for the grain filling period (Santiveri et al., Reference Santiveri, Royo and Romagosa2002).
To characterize the genotype response due to defoliation stress, two stress indices were calculated. A stress susceptibility index (SSI) for GWS was calculated using the procedure of Fischer and Maurer (Reference Fischer and Maurer1978). This was expressed by the following relationship: SSI = (1 − (Ts1)/(Tns1))/SI, where Ts and Tns are the grain weights of a genotype under stressed (defoliated) and non-stressed conditions, respectively. SI is the stress intensity index which was estimated from: (1 − (Xs2)/(Xns2)), where Xs2 and Xns2 represent the mean grain weight across all genotypes evaluated under stressed (defoliated) and non-stressed conditions, respectively. Smaller SSI indicates greater tolerance to stress. A stress tolerance index (STI) was calculated using the following relationship: STI = (Tns × Ts)/(Xns)2 (Fernandez, Reference Fernandez1992). For this, a higher STI indicates greater tolerance to stress.
Data analysis
Univariate statistical parameters such as mean, minimum and maximum values and coefficient of variation were used to describe the variability of the agro-physiological traits in each treatment. The two-way analysis of variance (ANOVA) was performed for each of the studied traits in order to determine the effects of environment (treatment-year combination) and genotype and their interaction. All sources of variation were considered as fixed. In order to ensure the validity of the model assumptions, residual and homogeneity variance analyses were performed for each of the traits as described in Zar (Reference Zar2010). Means between the genotype groups and treatments were separated by Tukey's HSD and t-test, and letter groupings were generated by using a 5% level of significance. The broad sense heritability (h 2) was estimated from ANOVA table by calculating the variance components in accordance with Hallauer et al. (Reference Hallauer, Carena and Filho2010). The presence of the significant rank-change genotype by year interactions for GWS was evaluated by Azzalini–Cox test (Azzalini and Cox, Reference Azzalini and Cox1984).
Due of the problem of the high degree of the multicollinearity among the predictors (as indicated by high variance inflation factor values) in the multiple linear regression model for stress tolerance indexes (SSI and STI) versus agro-physiological traits, we choose to fit an alternative variable selection method known as Least Absolute Shrinkage and Selection Operator – LASSO (Tibshirani, Reference Tibshirani1996) to regularize the least square fit and shrinks the effects of some of the traits to zero for a given value of the λ tuning parameter (Hastie et al., Reference Hastie, Tibshirani and Friedman2009). The LASSO solution was computed using the path wise cyclical coordinate descent algorithm (Friedman et al., Reference Friedman, Hastie and Tibshirani2010). For each of the prediction models, the optimal value of the tuning parameter was estimated by five-fold cross-validation.
The correlation structure of the genotype by trait and genotype by climatic variable data tables were visualized and interpreted by multivariate biplot techniques as described by Yan and Kang (Reference Yan and Kang2003). The interpretation of the biplot is based on the ‘inner-product’ principle (Kroonenberg, Reference Kroonenberg1995). A positive correlation between two traits (or climatic variables) is represented by an acute angle between them and an obtuse angle represents a negative correlation, according to the following simple rules, e.g.: cosine 0° = 1 is a maximum positive correlation; cosine 180° = −1 is a maximum negative correlation and; cosine 90° = 0 is an absence of correlation. A separate biplots were constructed for CP and DP treatment.
Linear discriminant analysis (LDA) as a multivariate classification tool was used to classify the genotypes using the a priori information about their use in breeding programmes at MRIZP. This information was used to develop the discrimination function that resulted in an optimal discrimination of the groups of genotypes. The overall success of the discrimination function was measured by the percentage of the correct classifications of the genotypes. Prior to conducting the LDA, all variables were normalized by Box–Cox transformation which brings the data as close as possible to normality. The results of first two discriminant functions were visualized by means of two-dimensional graph.
All computations and data visualizations were accomplished within the R computing environment (R Development Core Team 2014).
RESULTS
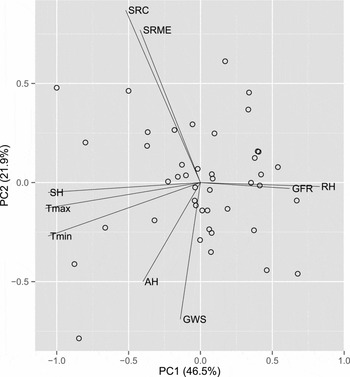
The rainfall pattern in early spring (March–April) was rather different between the two years (Table 2) but the additional irrigations during that period ensured sufficient water supply for biomass accumulation. Growth conditions during anthesis and grain filling (May–June) were more favourable in 2011 than in 2012. Rainfall was lower while temperatures were higher in 2012, particularly in June during grain filling. Number of days with maximum temperatures over 30 °C for June in 2012 was two-fold higher than in 2011 (14 vs. 7). Generally, higher temperatures and lower rainfalls during May and June are probably the major cause of a significantly lower GWS in 2012 compared with 2011 in both CP and DP plants (41 and 48%, respectively). Since there was a considerable genotypic variation in phenology across the 44 genotypes (12 and 14 days difference between first and last genotype to flower in 2011 and 2012, respectively), climatic variables were calculated for the period from anthesis to maturity for each genotype. Such data, analysed by genotype × climatic variable data biplots, showed rainfalls to be important for GFR in both CP and DP plants, while GWS was influenced by air humidity (Figure 1). SH and average temperatures (minimum and maximum) had strong negative effects on GFR in both CP and DP plants, but not on GWS (for either CP or DP plants). None of the climatic variables studied here had any significant effect on SRC or SRME.
Vector view of an environment × factor × biplot summarizing the interrelationship among meteorological data and plant traits. Meteorological data were calculated for period from anthesis to maturity for each of 44 genotypes presented in both experimental years. Wheat genotypes are dotted. PC1 and PC2 are the first and the second principal components, respectively. Meteorological codes: Tmin = average minimum temperatures, Tmax = average maximum temperatures, RF = rainfalls, SH = sunshine hours, AH = air humidity. Trait codes: SRC = stem reserve contribution, SRME = stem reserve mobilization efficiency, GRF = grain filling rate, GWS = grain weight per spike.

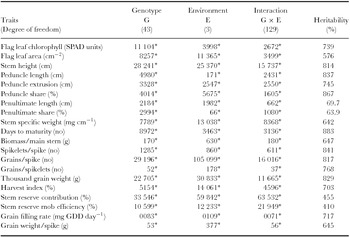
The combined ANOVA based on STA and FAM groups (Table 3) indicated that the main effects of genotype, environment and their interaction were significant for all traits (p < 0.01). Environment was the most influential factor for the majority of the traits including FLA, PDS, SSW, GNS (grains per spike), GNSL (grains per spikelet), TGW, HI, BMS (biomass per main stem), GFR and GWS. Genotype was the most important factor affecting CHL (chlorophyll content), SH, PDL, PDE, PNL, PNS and SPS, while genotype × environment was dominant (nearly 50%) in the total sum of squares of SRC and SRME. Genotype × environment interaction for GWS (about 12%) could be explained not only by differences in the magnitude of the individual response of each genotype in each particular environment but also by significant rank-change (crossover) interactions. Azzalini–Cox test showed that on the basis of a t test, with an interaction-wise error rate of 5%, the numbers of significant crossover interactions among four environments were 1870 out of a possible 5676 interactions (32.9%). The ranking of genotypes for GWS was more stable between treatments than between years. The overall heritability was high (>75%) for SH, PDL, PDS, DTM (days to maturity), SPS, GNS, GNSL and TGW. The lowest heritability was for SRC (45.5%) and SRME (41.0%). Grain weight per main spike had moderate heritability (64.5%) (Table 3).
Total sum of squares from analysis of variance and heritability for the developmental, productive and physiological traits for the 44 wheat genotypes (STA and FAM groups) obtained from defoliated/non-defoliated plants grown in two years (environments constitute year–treatment combinations).

*Significant at the 0.01 level of probability.
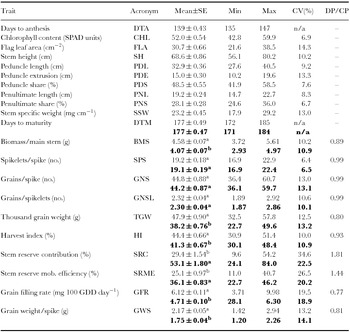
The effect of defoliation was significant for BMS, TGW, HI, SRC, SRME, GFR and GWS (Table 4). Productive traits such as SPS, GNS and GNSL, measured after defoliation, were not affected as they were probably determined before leaf blades were removed (10 DAA). The other traits were measured before defoliation, so defoliation could not influence them. The highest percentage reduction associated with defoliation was found for GFR (23%), followed by TGW (20%), GWS (19%), BMS (11%) and HI (7%). Defoliation increased stem reserve mobilization parameters SRC and SRME by 92 and 48%, respectively. The majority of traits showed relatively moderate diversity across genotypes (CV > 10%) under both treatments. SRC and SRME showed considerable variation (> 20%), particularly in the non-defoliated treatment. Other traits had similar CVs in CP and DP plants.
Descriptive statistics for the developmental, productive and physiological traits for 44 wheat genotypes (STA and FAM groups) in control (normal font) and defoliated plants (bold font) (averaged over two years).

Means of the same trait followed by different letters are significantly different at 0.05% levels of probability. Data for traits measured before leaf blades removal is pooled from both plants labelled to be control and defoliated (i.e. considered to have only control treatment).
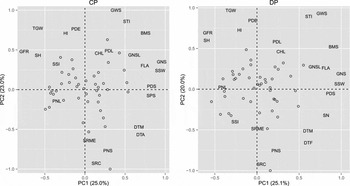
To visualize patterns of the interrelationships among traits in control and defoliated plants across STA and FAM groups, genotype × trait biplots were prepared (Figure 2). In general, both defoliated and non-defoliated plants gave similar patterns of trait correlations. Traits such as CHL, PDL, BMS, PDE, GNSL, FLA, SSW, GNS, PSS and SN were positively associated with GWS (indicated by acute angles between vectors for those traits and yield), while SH, TGW and PNL were negatively associated with GWS (and at the same time positively associated with GFR), as shown by obtuse angles between their vectors. Both stem reserve mobilization parameters, SRC and SRME, were correlated positively with only PNS, but negatively with other stem parameters such as PDE and PDL. The correlations of SRC and SRME were negative with GWS and neutral with GFR. Interestingly, for the selected genotypes, differences in GWS, SRC and SRME were not significantly associated with earliness or stem height. The most obvious difference between the biplots for defoliated and non-defoliated plants was in the position of SSI. Under non-stress conditions (CP), SSI was rather strongly (positively) correlated with GFR, but neither positively nor negatively with GWS, SRC and SRME. Under stress conditions (DP), SSI had positive correlations with not only GFR but also with stem reserve mobilization parameters, while the relationship with GWS was negative. To define a subset of traits that contribute to better tolerance based on SSI and STI as dependent variables, the LASSO regression was applied. This analysis indicated BMS and SRME to be most important for STI, while GFR was most important for SSI.
Genotype by trait biplot showing the interrelationship among traits in controlled (CP) and defoliated (DP) plants based on mean values for 44 genotypes presented in both experimental years. Genotypes are hidden. Trait codes: DTA = days to flowering, DTM = days to maturity, CHL = chlorophyll content, FLA = flag leaf area, SH = stem height, PDL = peduncle length, PDE = peduncle extrusion, PDS = peduncle share, PNL = penultimate length, PNS = penultimate share, SSW = stem specific weight, BMS = biomass per main stem, SPS = spikelets per spike, GNS = grains per spike, GNSL = grains per spikelet, HI = harvest index, TGW = thousand grain weight, SRC = stem reserve contribution, SRME = stem reserve mobilization efficiency, GRF = grain filling rate, GWS = grain weight per spike, SSI = stress susceptibility index, STI = stress tolerance index.

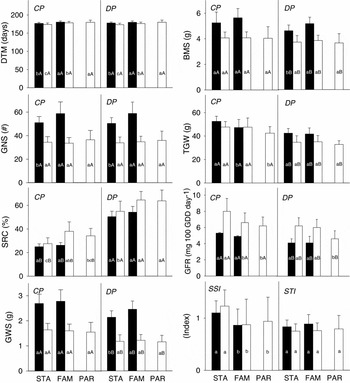
For traits measured before or immediately after defoliation, FAM had significantly (p < 0.05) higher mean CHL, FLA and SSW than STA averaged across two years (Supplementary Table S1, available online at http://dx.doi.org/10.1017/S0014479715000034). In 2011, for the traits measured at physiological maturity, FAM genotypes had significantly more DTM (both CP and DP), BMS (only DP), GNS (only DP), SRC (only DP) and GWS (only DP) than STA genotypes (Figure 3). In contrast, STA genotypes had significantly greater TGW (only CP) and GFR (only CP) than FAM genotypes (Figure 3). In 2012, when the PAR group was added to the trial, significant differences among them (p < 0.05) for ‘pre-defoliated’ traits were obtained for DTA (days to flowering) (with PAR genotypes being later than STA and FAM genotypes), PDS (with PAR genotypes having greater PDS than STA and FAM genotypes) and SSW (with PAR and FAM genotypes having greater SSW than STA genotypes) (Supplementary Table S1). Under CP treatment, TGW differed significantly among groups, with PAR having lower TGW than STA and FAM genotypes. SRC differed significantly between FAM and STA genotypes and GFR of STA genotypes were significantly higher than in FAM and PAR genotypes (Figure 3). Under DP treatment, groups differed for SRC (with STA having lower SRC than FAM and PAR genotypes) and GFR (with PAR had lower GFR than STA and FAM genotypes). STA was the earliest and PAR the latest group in both CP and DP treatments (Figure 3). According to SSI, the most tolerant group was FAM, followed by PAR and STA, while the STI index was similar for all groups (Figure 3).
Performance of standard genotypes (STA), F4:5 families (FAM) and parental genotypes (PAR) across control (CP) and defoliated (DP) plants in 2011 (black boxes) and 2012 (white boxes). Values are means ± standard deviations. Trait codes are the same as in Figure 2. Means of genotype group followed by the same letter (lower case) within same year and same treatment are not significantly different (p < 0.05). Means of genotype group in control and defoliated plants followed by the same letter (upper case) within same year are not significantly different (p < 0.05). Letters correspond to ranking of groups after t-test (for treatments in the same year and for genotype groups in 2011) and Tukey HSD test (for genotype groups in 2012).

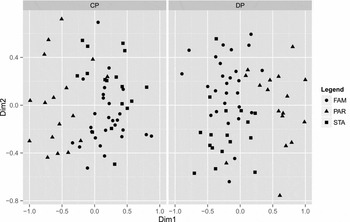
To explain which traits contributed most to the differences between the genotype groups, LDA were performed based on the dataset of 21 traits and two stress indexes measured in CP and DP in 2012. Using the role of each genotype (standard/parent/family line) in the breeding programme at MRIZP as the grouping variable, the analyses revealed that all groups had relatively high percentages of correct classification under both control and stress conditions (Supplementary Table S2). Figure 4 shows the scatterplot of the wheat genotypes on the space defined by the first two discrimination functions. The score of the genotypes in the plot showed a more clear differentiation between the groups in DP than in CP. The first dimension differentiated PAR from STA and FAM. The second dimension differentiated STA from FAM. The PAR group seemed to be the most separate and diverse group with respect to all other groups, while the STA group showed the lowest diversity. The traits mostly responsible for discrimination between the genotype groups in DP were FLA, PDS, BMS and SSI. The traits contributing most to differences between the genotype groups in CP were FLA, PDS, DTM and GWS (Supplementary Table S3).
Linear discriminant analysis (LDA) plot for wheat genotype groups (STA = standard genotypes, FAM = F4:5 families, PAR = parental genotypes) for studied traits (see Table 4) and two stress indexes (SSI and STI) reordered in 2012. CP = control plants, DP = drought plants.

DISCUSSION
Obviously, traits that were observed or measured before leaf blades were removed (DTA, CHL, FLA and SSW) were not affected by defoliation. Also stem and stem-related traits were similar in CP and DP plants at 10 DAA as the lower stem internodes and peduncle, on average, attained their maximum length at and shortly after anthesis, respectively (Ehdaie et al., Reference Ehdaie, Alloush, Madore and Waines2006a; Scofield et al., Reference Scofield, Ruuska, Aoki, Lewis, Tabe and Jenkins2009). The same was true for grain number per spike/spikelets. Namely, when water stress was applied during the lag phase of grain filling (around 4–7 DAA, Hunt et al., Reference Hunt, Van Der Poorten and Pararajasingham1991), the grain set could be reduced due to increased abortion of young kernels (Weldearegay et al., Reference Weldearegay, Yan, Jiang and Liu2012). However, when water stress was applied later, as in our case during the linear phase of grain filling (i.e. milk stage), grain number was unaffected (Karim et al., Reference Karim, Hamid and Rahman2000; Li et al., Reference Li, Cain, Jiang, Liu, Dai and Cao2013).
Although, the experimental conditions for growing control and defoliated plants were designed to be the same in both years, it is clear from the ANOVA and mean data for each year (Table 3 and Supplementary Table S1) that most of the traits differed considerably between the two seasons. In general, the spring growing period of 2012 was more dry and warm than in 2011, particularly starting from heading-anthesis until full maturity (May–June). This caused a decrease of grain set (grains number per spike and spikelet) and reduction of grain filling (lower TGW) resulting in yields lower by 41 and 48% in CP and DP, respectively. Thus, this season was unfavourable. The effect of the unfavourable season on GWS was higher than that of defoliation (19%). In the case of defoliation, as noted by Álvaro et al. (Reference Álvaro, Royo, Garcia del Moral and Villegas2007), reduction in translocation from leaf blades was compensated by increase in translocation from the chaff. In addition, the difference in the value between crop yields of two consecutive years is usually larger than that of the difference among test locations in the conditions of south-eastern Europe (Dodig et al., Reference Dodig, Zoric, Knezevic, King and Surlan-Momirovic2008). Furthermore, there is an increasing trend of the interannual wheat yield variability in continental European climate (Thaler et al., Reference Thaler, Eitzinger, Trnka and Dubrovsky2012).
Temperature has been identified to be the most important climatic variable influencing grain filling parameters and grain weight (Calderini et al., Reference Calderini, Savin, Abeledo, Reynolds and Slafer2001). This was confirmed in our work in the case of GFR (temperature variables had strong negative effects), while GWS was not affected by temperatures. At the same time, although precipitations had a strong positive effect on GFR, GWS was again not affected. Relative air humidity (which can be regarded as a consequence of the balance between rainfalls and temperatures) was shown to be the most important environmental factor for high GWS. This result was probably through the effect of relative humidity on reproductive processes (e.g. pollination and fertilization) involved in determining grain set. Grains number per spike and grains number per spikelet were highly correlated with GWS in both CP and DP plants. Temperature parameters, day length, air humidity and precipitations had no or only slight effect on SRC and SRME. The absence of any relationship with climatic variables and a relatively low proportion of the total variation explained by the biplots (68.4%) indicates the complexity of the interrelationship among climatic variables and traits related to stem reserve mobilization.
We have estimated that the stem and sheath assimilate reserves contributed from 10–54% (CP) and from 24–84% (DP) to GWS, which is in accordance with previous findings for wheat (Ehdaie et al., Reference Ehdaie, Alloush and Waines2008 and references therein). As stress tolerance in cereals is dependent not only on the capacity of the stem to accumulate reserves but also on the subsequent mobilization of these reserves to the grains (Kumar et al., Reference Kumar, Sahrawi, Ramos, Amaranth, Ismail and Wade2006), we have also estimated mobilization efficiency. SRME varied from 11 to 41% and from 23 to 46% in CP and DP, respectively. Defoliation improved the effective partitioning between stem and grain on average by 44% which is almost 2/3 higher of previously reported by Ehdaie et al. (Reference Ehdaie, Alloush, Madore and Waines2006a) for 11 diverse wheat genotypes. However, reallocation of as much as 75–92% of pre-anthesis 14C stored in the stem and sheath to grains due to water stress has been reported for cereals (Yang et al., Reference Yang, Zhang, Wang, Zhu and Wang2001b). Estimates of remobilization efficiency of assimilate and the relative contributions of stem reserves to grain yield would inevitably vary considerably, according to the experimental conditions, methods of estimation and genotypes used. Nevertheless, what is important is the existence of genetic variability in wheat for both the capacity to accumulate reserves in the stem and the remobilization efficiency (Ehdaie et al., Reference Ehdaie, Alloush and Waines2008), which allows these traits to be improved in new cultivars. Our data showed that among 21 traits, SRC and SRME had the highest variability (over 20%), with both traits varying more in CP than in DP, which is in accordance with the findings of Ehdaie et al. (Reference Ehdaie, Alloush, Madore and Waines2006a). In our trials, genotype interaction with environment was relatively high for these traits. However, trials with a diverse wheat set grown across multiple environments in Australia showed a relatively small interaction with environment (Ruuska et al., Reference Ruuska, Rebetzke, Van Herwaarden, Richards, Fettell, Tabe and Jenkins2006), supporting the view that breeding for high SRC and SRME may be possible.
Although, SRC and SRME were increased by defoliation, GWS and GFR were significantly decreased. Ehdaie et al. (Reference Ehdaie, Alloush and Waines2008) demonstrated that reduction in grain weight under stress was attributed to a shorter duration of the linear phase of grain growth, despite an increased contribution of stem assimilates to grain weight. In other words, the rate at which stem reserves were mobilized to the grains under stress could not effectively compensate for the reduction in grain filling period. The biplot for DP showed that higher SRC and SRME were associated with lower susceptibility to stress (SSI), which may seem controversial. However, despite reports on the benefits for drought tolerance of selecting for increased capacity to remobilize stored assimilates to the grains, several authors have argued that such a strategy may be counterproductive for yield potential. Greater partitioning to the stem as the basis of high reserve storage could reduce spike weight at anthesis, thereby reducing yield potential (Blum, Reference Blum1998; Slafer and Araus, Reference Slafer and Araus1998). Although, a high GFR was reported to be desirable because of its strong positive influence on final grain weight or yield (Calderini and Reynolds, Reference Calderini and Reynolds2000; Motzo et al., Reference Motzo, Giunta and Deidda1996; Sanjari Pireivatlou et al., Reference Sanjari Pireivatlou, Aliyev and Sorkhi Lalehloo2011), we found no strong correlation between GFR and GWS. Indeed, findings on the relationship between GFR and grain weight are inconsistent (Álvaro et al., Reference Álvaro, Isidro, Villegas, García del Moral and Royo2008). Also, it is considered that a positive effect of GFR on GWS is not necessary if lighter grains can be compensated by more grains; hence the balance between yield components and grain filling parameters is more important than their high values (Brdar et al., Reference Brdar, Kobiljski and Kraljevic Balalic2006).
GFR was strongly affected by phenology (DTA and DTM) and stem height in both CP and DP plants. Conversely, earliness and stem height were not correlated with GWS, SRC and SRME, even when selected genotypes differed in their time to anthesis by up to 14 day and their stem height by up to 35 cm. Ehdaie et al. (Reference Ehdaie, Alloush, Madore and Waines2006a, Reference Ehdaie, Alloush, Madore and Wainesb) also reported a lack of association between stem reserve traits and phenology, despite differences in time to anthesis amongst cultivars of up to 18 day. These findings suggest that selection for GWS, SRC and SRME could be conducted without significantly affecting height and maturity classes in wheat breeding programmes. However, stem segments (PDL, PDE and PNL) or their derived traits (PDS and PNS) all had strong effects either on GWS or GFR or stem reserve and mobilization traits. For example, genotypes where the penultimate internode was a high proportion of the total stem length had higher SRC and better SRME. It has already been reported that the penultimate internode accumulates more water-soluble carbohydrates than the peduncle (Ehdaie et al., Reference Ehdaie, Alloush, Madore and Waines2006b; Joudi et al., Reference Joudi, Ahmadi, Mohamadi, Abbasi, Vergauwen, Mohamadi and Van den Ende2012; Willenbrink et al., Reference Willenbrink, Bonnett, Willenbrink and Wardlaw1998). Conversely, the peduncle traits peduncle extraction and PDL were negatively associated with SRC and SRME, though positively with GWS. In a previous study with 96 wheat genotypes (Dodig et al., Reference Dodig, Barnes, Kobiljski and Quarrie2011), yield maintenance in DP, was highly significantly correlated with PDL, and especially with extruded PDL. This upper part of the peduncle (from flag leaf ligule to base of the ear) is exposed to a high irradiance (only shaded by the ear) and may contribute to the significant photosynthesis of the stem (including leaf sheaths) (Gebbing, Reference Gebbing2003). It seems again, as in the case of yield components and mobilization and grain filling parameters, that balanced partitioning of stem length into peduncle (and its further partitioning into enclosed and uncovered parts) and lower internodes (primarily penultimate internode), not their lengths per se, should improve the contribution of stem reserves to wheat yield.
The only variable that differed between CP and DP in its importance for determining GWS was SSI. While SSI was not correlated with GWS in CP, under defoliated conditions tolerant genotypes, according to this index, had better grain weight. The other stress index STI had positive association with GWS in both CP and DP. The LASSO regression method for variable selection indicated biomass of the main stem and SRME to be most important for STI, while GFR was most important for SSI. While STI is reported to be a useful indicator in wheat breeding under moderate (post-anthesis) stress, SSI is suggested for use under severe (pre-anthesis) stress (Sio-Se Mardeh et al., Reference Sio-Se Mardeh, Ahmadi, Poustini and Mohammadi2006), hence different traits contributing them is not unexpected. STI identifies genotypes that produce high yield under both stress and non-stress conditions (Fernandez, Reference Fernandez1992), and this corresponds well with findings from the LASSO. The importance of total biomass for yield increase in wheat (Reynolds et al., Reference Reynolds, Dreccer and Trethowan2007), especially under drought stress conditions (Quarrie et al., Reference Quarrie, Stojanović and Pekić1999), has long been recognized. Assimilate mobilization efficiencies were found to be higher in the internodes of tolerant than sensitive cultivars (Gupta et al., Reference Gupta, Kaur and Kaur2011), both under control and stress conditions, which resulted in enhanced translocation of stem reserves to the grains. On the other hand, water stress usually shortens grain filling duration and in such cases increasing GFR seems logical for supporting grain yield. However, as discussed earlier, it is not as simple as it looks as there is a trade-off for maximizing the grain yield under stress between increasing GFR and phenology. Namely genotypes that attained maturity earlier (and thus avoid severe stress) had lower GFR compared with the late ones (Blum, Reference Blum1998).
Genotype groups significantly differed at least in one season for DTF, DTM, CHL, FLA, PDS, SSW, BMS, GNS, TGW, SRC, GFR, GWS and SSI. However, the LDA revealed that groups could be differentiated mostly by FLA, PDS, DTM and TGW in CP, and by FLA, PDS, BMS and SSI in DP. As FLA and PDS were measured before defoliation, it is not surprising that they are overlapping. Under non-stress conditions there were no significant differences for GWS between groups. However, in DP, the FAM group had higher GWS than STA in 2011 and both STA and PAR in 2012, but the differences were significant only in 2011. The same was true for biomass of the main stem which had a strong effect on GWS. It seems that our targeted crosses were successful in improving biomass (and thereby grain yield) at least under moderate (less severe) stress during grain filling. Namely, several of our parent genotypes were of high biomass (e.g. Pobeda, NS 46/90, Lambriego Inia, Florida and Phoenix) and were crossed to combine more favourable biomass alleles. A few of these showed both very high biomass/stem and yield/spike (Quarrie et al., Reference Quarrie, Dodig, Kobiljski, Kandić, Savić, Rančić and Pekić Quarrie2011). Of the 27 FAM genotypes, 17 had above-average biomass per stem and 10 below-average biomass per stem, whereas the additional 16 genotypes from the wheat breeding programme and two Commission standards (i.e. STA group in this study) showed only 6 with above-average and 12 with below-average biomass per stem.
Under more severe stress conditions, FAM had significantly shorter vegetation, smaller FLA, lower peduncle share, lower TGW (only in CP) and better GFR (only in DP) than PAR. However, the drought tolerance of FAM genotypes seems not to be improved compared to PAR. On the other hand, FAM had longer maturation period, better SSW and SRC than STA, and their drought tolerance (by SSI) was significantly better. Gupta et al., (Reference Gupta, Kaur and Kaur2011) reported that under stress conditions tolerant genotypes had longer duration of grain maturation which allowed greater utilization (thus restricting heavy decrease in grain yield) of stem reserves compared with sensitive genotypes. SSW is important in genotypic accumulation and mobilization of stem reserves in wheat (Ehdaie et al., Reference Ehdaie, Alloush, Madore and Waines2006a) and when drought was applied, reserves were mobilized more effectively in tolerant than in sensitive cultivars (Gupta et al., Reference Gupta, Kaur and Kaur2011). Although GFR was better in STA than in FAM in CP, there was no difference in DP which also may indicate better adaptation of FAM to higher stress compared with STA.
Generally, SSI allows us to compare genetic capacity to sustain yield under stress in the post-anthesis phase. Differences in genotypic response to tolerate post-anthesis stress were very high among studied genotypes (Supplementary Table S4). For example, SSI value in 2012 (when all three genotype groups were tested) ranged from 0.12 (for the most tolerant genotype) to 2.40 (for the most susceptible genotype), hence there is a twenty-fold difference. Lower but still considerable difference (nearly seven-fold) was between the lowest and the highest value in 2012 for STI, which is used to select high yielding genotypes in both stress and non-stress conditions. Data suggest existence of a high genetic capacity to overcome post-anthesis abiotic (water) stress even within a relatively small number of genotypes such as used in this study. However, selection based on stress indexes, particularly SSI, under stress conditions may result in reduced yields in well-watered conditions (Dodig et al., Reference Dodig, Zoric, Knezevic, King and Surlan-Momirovic2008; Sio-Se Mardeh et al., Reference Sio-Se Mardeh, Ahmadi, Poustini and Mohammadi2006). In these two studies, grain yield reductions due to drought before anthesis were more severe (between 35 and 56%) compared with grain weight reduction (19%) in this study. Thus, our data from interrelationship analysis suggest that selection based on both SSI and STI would improve grain weight under (moderate) post-anthesis stress without penalizing grain weight under non-stress conditions. Nevertheless, this should be tested in more natural (not by defoliation-induced) and more severe stress conditions during grain filling.
In conclusion, selection based on high biomass and efficient translocation of assimilates into grain would probably produce genotypes with high yield and moderate stress tolerance potential. On the other hand, selection based on high GFR would be more useful under severe conditions. However, there is a trade-off in maximizing the grain yield under stress between increasing yield components and stem reserve and grain filling parameters. Their balanced relations rather than high values are more important to develop cultivars that can tolerate environmental stresses during grain filling. Crosses that we made based on phenotypic and genotypic scores for typical breeding traits in wheat were successful in improving grain weight, at least under moderate stress during grain filling. These traditional traits also benefit yield productivity and grain filling under non-stress environments. However, a number of traits that are expected to be of specific benefit under severe stress conditions probably need to be targeted. Various aspects of stem anatomy and post-anthesis variation in water-soluble carbohydrates have also been studied in these trials and results will be reported elsewhere.
Acknowledgements
This work was supported by the Serbian Ministry of Education, Science and Technological Development under Grant TR 31005.
SUPPLEMENTARY MATERIALS
To view supplementary material for this article, please visit http://dx.doi.org/10.1017/S0014479715000034.