“With Bush that weak, working in the White House wasn't just a fantasy anymore.”
George Stephanopoulos, night of New Hampshire Primary, 1992
With another Bush looking weak, many Democrats are feeling good about their prospects in November, even without the dream of a job in the White House for themselves. Yet this time, a Bush won't be on the presidential ballot in November, nor will someone closely affiliated with his administration, such as the vice president. Whatever the Bush legacy may be, the 2008 presidential election shapes up as an open-seat contest. A key predictor of the model used here to forecast the outcome of that contest is the showing of the presidential nominees in primaries (hence the sobriquet Primary Model). Since American elections in November are typically preceded by primary elections earlier in the year, it is natural to inquire whether the voting in presidential primaries is a leading indicator of the vote in the general election? Remarkably so, as it turns out. How the presidential candidates do in primary elections foretells their prospects in the November election with great accuracy.
The Primary Model treats the primary performance of the incumbent-party candidate and that of the opposition-party candidate as two separate predictors. For elections since 1952, the primary-support measure relies solely on the New Hampshire primary, while using all primaries prior to that date. The model is estimated with data from presidential elections going back as far as 1912, the first year of presidential primaries, with an adjustment applied to the Republican advantage in pre-New Deal elections. In addition to primaries, the forecast model takes advantage of a cycle in presidential elections, where partisan turnover occurs with some regularity after two to three terms of office. The out-of-sample forecasts of the Primary Model pick the popular-vote winner in all but one of 24 elections.
The moment the New Hampshire primary was decided, the model was able to make a forecast for any matchup in November between Democratic and Republican candidates (first posted January 15, 2008, at http://www.pollster.com/blogs/new_hampshires_crystal_ball_in.php). In the race between the nominees, Barack Obama would edge John McCain by the slimmest of margins, 50.1 to 49.9% of the major-party vote. Needless to say, this forecast is within one unit of the forecast standard error. And it is a final forecast; that is, without any possibility of revision.
The Forecast Model
The Primary Model, which I am using to forecast the 2008 presidential election, served this purpose, with some modifications, in the three previous elections (Norpoth Reference Norpoth, Campbell and Garand2000; Reference Norpoth2001; and Reference Norpoth2004; also see http://www.primarymodel.com). It relies on the showings of candidates in primaries—hence the name of the model—along with a cyclical dynamic of presidential elections, and a partisan adjustment. As for the vote in the general election, the share of the incumbent-party candidate is based on the major-party vote only; votes for third-party candidates are excluded.Footnote 1
The Primary Predictor
The moment presidential primaries were introduced, a remarkable precedent was set. In 1912, the Republican Party decided to give its presidential nomination to a loser in its presidential primaries (Taft), whereas the Democrats nominated their primary winner (Wilson), and Wilson went on to victory in the general election. Message to party: nominate your primary winner and you will win the general election—if the other party does not nominate its primary winner.
This simple rule packs quite a predictive wallop, but it requires some fine-tuning. In quite a few election years both parties nominate primary winners. Also, the bar for winning needs to be set higher for sitting presidents, who count on being renominated without challenge, and lower for would-be presidents in the opposition party, where the contest is expected to be wide open. To handle these concerns, the first step is to take a nominee's primary vote and express it as a percentage, specifically as a percentage relative to the vote received by that candidate's chief rival (the one with the next most votes, or the leading vote-getter if the nominee did not win the primary battle). This rule will be applied to all other candidates in primary contests as well so we can make forecasts for all possible matchups until the nominations are decided.Footnote 2
The second step concerns an adjustment of the winning margin depending on whether the candidate is a sitting president, another member of the incumbent party, or a member of the opposition party. The adjustments rely on the historic averages of primary votes (1912–2004) for:

In other words, a presidential candidate who is a sitting president needs to surpass 60% of primary support to have a shot of winning in November; for any other candidate of that party, the primary bar would be 55.6%; and for candidates of the opposition party, a share of 47.1% would suffice. The more a candidate surpasses the respective bar, the better the chances of winning the general election. Also note that, beginning with 1952, only the vote in the New Hampshire primary will be used, whereas for elections from 1912 to 1948 the vote of all primaries is used.
The Presidential Cycle
In addition to primaries, the PRIMARY MODEL enlists a dynamic of the presidential vote that is useful for forecasting all by itself (Jones Reference Jones2002; Norpoth Reference Norpoth1995). In presidential elections as far back as popular votes are widely available (1828), the White House party has controlled the office for an average of two to three terms. A compelling explanation for that cycle is the existence of a term limit in presidential elections (Norpoth Reference Norpoth, Dorussen and Taylor2002). The rule guarantees that incumbent presidents are missing from those contests in some periodic fashion, as will be the case in 2008. This “cycle” in presidential elections, which occurs in an irregular fashion, is handled by means of a second-order autoregressive process with a positive parameter for the first lag and a negative one for the second.
Partisanship
Finally, the forecast model makes an adjustment for a pronounced Republican advantage in presidential elections prior to the New Deal realignment (Norpoth and Rusk Reference Norpoth and Rusk2007). As shown below, the partisan baseline in presidential elections since the 1930s has stayed very close to the point of equal division.
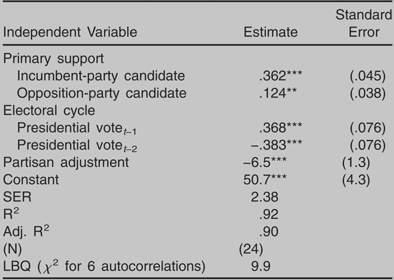
The parameter estimates of the forecast model, along with diagnostics, are shown in Table 1. Note that the dependent variable is the Democratic percentage of the major-party vote, regardless of whether that party was in the White House or not. As a result, the primary-support variables had to be inverted for elections with Republicans in control.Footnote 3 Given the stronger effect of primary support of the incumbent-party candidate, whatever happened in the Republican primary contest this year carries more weight for the vote in November than what happened in the Democratic contest. The estimates for the two autoregressive vote parameters translate into an expected length of 2.6 terms of party control of the White House. Put simply, going for a second term is very much a sure bet, but going for a third term, as Republicans are trying to do in 2008, is more an even bet. Finally, the adjustment for pre-New Deal partisanship produces a constant estimate that suggests a close balance in presidential elections since then, notwithstanding the lead that Democrats enjoyed in party identification for much of that period.
Estimates of the Primary Model

Source: CQ Guide to U.S. Elections, 3rd ed., 1994, 489–560; CQ Weekly Report, Aug. 3, 1996, 63, and Aug. 17, 1996, 79; Pomper 2001, 32 and 35; www.primary.monitor. com, Jan. 29, 2004.
Note: The dependent variable is the Democratic percentage of the two-party vote in presidential elections; for the 1912 election, however, the two-party vote division was approximated by the House vote. The primary support variables are capped in the 30–70 range and mean-inverted for years of Republican control of the presidency. The partisan adjustment is a binary variable (coded 1 for elections up to 1932, and 0 for elections since) that takes into account the substantially lower level of Democratic support prior to the New Deal realignment.
* p < .05;
** p < .01;
*** p < .001
The 2008 Forecast
All of the information required to make a forecast for the presidential election this November is known by now—the vote in the last two elections, the outcome of the New Hampshire primary, and the partisan adjustment. Hence we can offer an unconditional forecast for the matchup between nominees, along with forecasts for any other matchup should those nominees somehow come up short of the nomination. These are final forecasts, that is, without any possibility of revision.
The prediction equation for the presidential vote in 2008 (expressed as the Democratic share of the major-party vote) is:

where RPRIM and DPRIM represent the primary support of the Republican (incumbent party) and Democratic (opposition party) nominees for president, capped within a 30–70% range. It can be quickly seen that at mean levels of primary support for both candidates (55.6 for the incumbent-party Republican and 47.1 for the opposition-party Democrat), the model predicts a narrow defeat for the Democratic ticket with 49.4% of the vote, albeit within one forecast standard error (2.5). Put another way, this would be the forecast derived solely from the cyclical dynamic with candidate strength held constant.
In the 2008 primary contest, both nominees performed very close to historical standards, in McCain's case for incumbent-party candidates who are not sitting presidents, and in Obama's case for opposition-party candidates. McCain got 54.0% of the two-candidate primary vote (based on the McCain-Romney total in New Hampshire), and Obama got 48.3% (of the Obama-Clinton total in New Hampshire).Footnote 4 So for the contest in November, the PRIMARY MODEL predicts 50.1% for Obama to 49.9% for McCain out of the major-party vote. Needless to say, this forecast is well within one unit of the forecast standard error (2.5). Given her victory over Obama in New Hampshire, Hillary Clinton would do somewhat better against McCain in the November general election (50.5 to 49.5% of the two-party vote). Republicans, however, could not have picked a stronger nominee than McCain from the field of candidates in 2008, given his victory in New Hampshire. The Primary Model gives none of the other Republican contenders a fighting chance against either Obama or Clinton (see http://www.primarymodel.com).
Forecast Diagnostics
How much confidence should one have in the model producing these forecasts? Earlier versions of this model predicted the popular-vote victories for Clinton in 1996, Gore in 2000, and Bush in 2004 (Norpoth Reference Norpoth, Campbell and Garand2000; Reference Norpoth2001; Reference Norpoth2004). While all these versions relied on the cyclical dynamic, primary support has been adapted in several ways. In addition to primaries in the incumbent party, the opposition party has been included as well. What is more, instead of using a simple win-lose dichotomy, the relative share of primary support of each party's nominee has been employed; the latest version of the forecast model constrains such support within a 30–70% range. And the model has also incorporated a partisan adjustment for the pre-New Deal level of long-term partisanship. Judging by the model standard error (2.38), the latest version tops all its predecessors in fitting the outcomes of presidential elections covered.
A key diagnostic test of a forecast model lies in its ability to come up with accurate out-of-sample predictions. This involves re-estimating the model for (n − 1) elections and then using the respective model estimates to predict the omitted case. Figure 1 presents such forecasts for all elections in the time frame covered here (1912–2004). There is only one election where the forecast misses the popular-vote winner, and even that miss (1960) is debatable.Footnote 5 To be sure, the out-of-sample forecast for 2000 does not pick George W. Bush as the winner of the election. The forecast model is strictly a popular-vote model, and that is what George W. Bush certainly did not win. Even though the model got it right for 2004, that forecast ranks as one of its lesser accomplishments. For all the support George W. Bush enjoyed among his partisans in the electorate—as captured by his performance in the Republican primary in New Hampshire and polls throughout the election year—he struggled with support from voters outside his party. In past elections sitting presidents with strong primary showings—such as Clinton in 1996, Reagan in 1984, Nixon in 1972, etc.—all succeeded in making deep inroads among the other partisans and Independents in November. It remains to be seen whether this is a sign of a deepening polarization in the American electorate requiring some model revision or simply a special case of the Bush presidency.
The Democratic Percentage of the Two-Party Vote and Point Forecasts of the Primary Model, 1912–2004

Conclusion
The Primary Model predicts a nail-biter of a presidential contest in November: 50.1% of the major-party vote for Obama against McCain. Why such a close contest at a time when a Republican president with low approval ratings and a sagging economy portend a sure Democratic victory? For one thing, this is an election without the sitting president on the ballot. His legacy counts for a lot less than it would with him on the ballot. Historically, in elections without a sitting president the outcome in November is very close. Remember 2000—or 1960! That is the message of the cyclical predictor of the model. The other point is that both nominees in 2008 fared very close to historical standards in primary support, True, McCain was a winner in New Hampshire, but his victory was a modest one by historical standards for a candidate of the White House party. Obama, in turn, lost in New Hampshire but his showing in that primary was respectable for a candidate of the opposition party. So the 2008 general election shapes up as a contest with two closely matched candidates.