
I. INTRODUCTION
For many decades, studies of the growth of ordered thin films have been a prolific endeavor in the scientific community of materials science, and this continued interest has been and is motivated by the ubiquitous application of thin films in almost all fields of modern advanced technologies. With the advent of the emerging nanotechnologies during the last decade, ultrathin films have become the focus of attention, with films approaching the two-dimensional (2-D) limit with only one or a few atom layers or, in the case of compounds, a few structural polyhedra thick. In conventional thin film terminology, (hetero)epitaxy denotes the formation of a crystalline overlayer on the surface of a single crystal of a different material. If the lattice constants of the two materials are similar, the atomic lattice of the substrate surface can act as a template and can promote the growth of an ordered crystalline film. In 1949, Charles Frank and van der Merwe have postulated that the pseudomorphic growth of the first monolayer is a necessary condition for the growth of an epitaxial film. Reference Frank and van der Merwe1 This implies that the interface between the substrate and the overlayer is coherent, in which the corresponding atom planes and lines are continuous and there is an atom-by-atom matching across the interface. In this article, we will examine the epitaxial growth of ultrathin oxide films on metal surfaces, in which a variety of different interface scenarios can give rise to epitaxially ordered overlayers.
Phenomenologically, thin film growth modes have been categorized by Ernst Bauer Reference Bauer2,Reference Bauer3 using a thermodynamic equilibrium approach based on surface energies. The categories were named after their original investigators as: (i) Frank–van der Merwe (F–M) or 2-D growth, i.e., the substrate is wetted by a pseudomorphic monolayer, one monolayer is completed after another; (ii) Volmer–Weber (V–W) or 3-D island growth, the adlayer does not wet the substrate; (iii) Stranski–Krastanov (S–K) or layer-by-layer followed by island growth, the adlayer wets the substrate for one or several monolayers, but the strain due to interfacial lattice mismatch leads to dewetting and then 3-D island growth. The epitaxial growth of a two-dimensional material may be regarded from the viewpoint of the F–M or S–K mode, depending on the strain situation, in which only the very first stage of F–M or S–K growth is realized. As discussed below, pseudomorphic lattice matching of the 2-D phase is however not a necessary condition and in fact a rare case in 2-D oxide epitaxy because 2-D lattices are flexible to accommodate interfacial strain, and novel structure concepts exist at low dimensionality, which introduce new matching properties. Reference Netzer, Surnev, Netzer and Fortunelli4 In this spirit, the term epitaxy is used here in a wider sense, defining ordered overlayer growth in ultrathin films or 2-D material phases.
In the aftermath of the discovery of graphene, the two-dimensional allotropic form of carbon, a multitude of other atom-thick 2-D materials have been introduced. Reference Butler, Hollen, Cao, Cui, Gupta, Gutierrez, Heinz, Hong, Huang, Ismach, Johnston-Halperin, Kuno, Plashnitsa, Robinson, Ruoff, Salahuddin, Shan, Shi, Spencer, Terrones, Windl and Goldberger5,Reference Service6 Most 2-D materials are derived from the so-called “van der Waals” solids, Reference Novoselov, Mishchenko, Cavalho and Castro Neto7,Reference Ajayan, Kim and Banerjee8 i.e., layered solids with strong, mostly covalent, intralayer but weak van der Waals interlayer bonding. If supported on a solid substrate, as it is often necessary for application purposes, these “van der Waals type” 2-D layers feature weak overlayer-substrate interactions. This is in contrast to the case of oxides, which if supported on a metal surface typically display strong oxide–metal interactions. This strong coupling leads to the creation of a new oxide–metal hybrid system, for which physical and chemical properties are largely determined by the oxide–metal interface. Reference Netzer, Allegretti and Surnev9 Strongly coupled oxide–metal hybrid systems are particularly widespread in the case of transition metal oxides. In this article, we will concentrate on the morphological and structural aspects of epitaxial 2-D oxide phases that can be stabilized at oxide–metal interfaces. Prototypical examples of the following oxide–metal interface systems, leading to 2-D epitaxial growth, will be discussed: (i) the pseudomorphic growth case; (ii) coherent interfaces supporting the growth of 2-D oxide phases with novel structures and stoichiometries; (iii) incoherent interfaces of incommensurate oxide overlayers; and (iv) epitaxy beyond the monolayer, the growth on top of 2-D phases.
II. EXPERIMENTAL CONSIDERATIONS
The experimental results discussed in this article have all been obtained within the so-called surface science approach: that is, ultrahigh vacuum (UHV) conditions of growth and in situ characterization, ensuring atomic control during the fabrication step of the oxide overlayers and atomic-scale precision in the subsequent structural and chemical analysis. The method of choice for the preparation of 2-D oxide layers on metal single crystal surfaces is physical vapor deposition (PVD) of the metal component of the oxide. PVD preparation recipes typically start with a clean metal substrate surface and include reactive evaporation of the cation component of the oxide in oxygen atmosphere or postoxidation, i.e., deposition of the metal in UHV followed by oxidation of the metallic deposits. Annealing steps in UHV and/or oxygen of the oxide deposits at elevated temperatures are typically necessary to improve the long range epitaxial ordering. The experimental analysis techniques used in the discussion here comprise spatially resolved and area averaging techniques, such as scanning tunneling microscopy (STM) with atomic resolution, low energy electron diffraction (LEED), and various electron spectroscopies [Auger electron spectroscopy (AES) and X-ray photoelectron spectroscopy (XPS)].
While in traditional PVD procedures of oxide ultrathin film preparation, the solid metal is evaporated in UHV or oxygen atmosphere onto the substrate surface using a thermal or electron beam evaporator, alternative approaches involve evaporation of oxide precursor compounds. Reference Schaefer, Zielasek, Schmidt, Sandell, Schowalter, Seifarth, Walle, Schulz, Wollschläger, Schroeder, Rosenauer, Falta and Bäumer36 An innovative method has been introduced recently by Dohnalek and collaborators Reference Kim, Bondarchuk, Kay, White and Dohnalek10,Reference Li, Zhang, Kim, Smith, Netzer, Kay, Rousseau and Dohnalek11 using a molecular beam of oxide molecular clusters. In this way, a W-oxide ultrathin film has been prepared by the deposition of cyclic (WO3)3 clusters from the gas phase onto a Pt surface, followed by on-surface condensation of the clusters at elevated temperatures into a compact and epitaxial WO3 overlayer. Reference Li, Zhang, Kim, Smith, Netzer, Kay, Rousseau and Dohnalek11 The (WO3)3 cluster beam is obtained by sublimation of WO3 powder in UHV in a thermal evaporator. This method provides a gentle way to grow W-oxide ultrathin films since PVD of the W metal is difficult due to the high melting point. The method can also be applied for growing MoO3 films on metal surfaces using the cyclic (MoO3)3 clusters Reference Rousseau, Dixon, Kay and Dohnalek12 and possibly also to other heavy maximum-valency oxides, which may be sublimed into small molecular cluster unities.
III. PROTOTYPICAL EPITAXIAL 2-D OXIDE SYSTEMS
A. Pseudomorphic oxide–metal interface structures
Strict pseudomorphism cannot be maintained across an interface between two widely dissimilar materials such as a metal and an oxide. Here we will use the term to designate the structure of an overlayer, which has the same unit cell parameters and orientation as the substrate surface. As an experimental consequence, the corresponding LEED diagram displays a (1 × 1) pattern. Pseudomorphic structures at oxide–metal interfaces are rarely observed because the match between metal and oxide lattices is typically poor. At this point, a comment concerning the lattice mismatch parameter m, as defined by m = (b − a)/a, with b the lattice of the overlayer and a that of the substrate, has to be added. Traditionally, the lattice constants of the bulk systems have been taken to estimate m. For 2-D overlayers, however, the bulk value is not a good approximation of b because the lattice constant of a 2-D sheet is contracted with respect to the bulk value. Strictly speaking, the lattice constant of a free-standing isolated 2-D oxide layer should be considered, which is experimentally not accessible but can be obtained from density functional theory (DFT) calculations. Thomas and Fortunelli Reference Thomas and Fortunelli13 have calculated, using the DFT + U method, the lattice parameter of a free-standing NiO monolayer and have compared it to that of NiO(100) on Ag(100). While the isolated monolayer was found to be contracted by ∼5% with respect to the bulk value, on Ag(100), the contraction is partly reversed by the influence of the substrate, and the calculations predict a compression of the NiO monolayer of only 2%. Thus, formal mismatch parameters of lattices for 2-D interfacial layers have to be regarded with due caution.
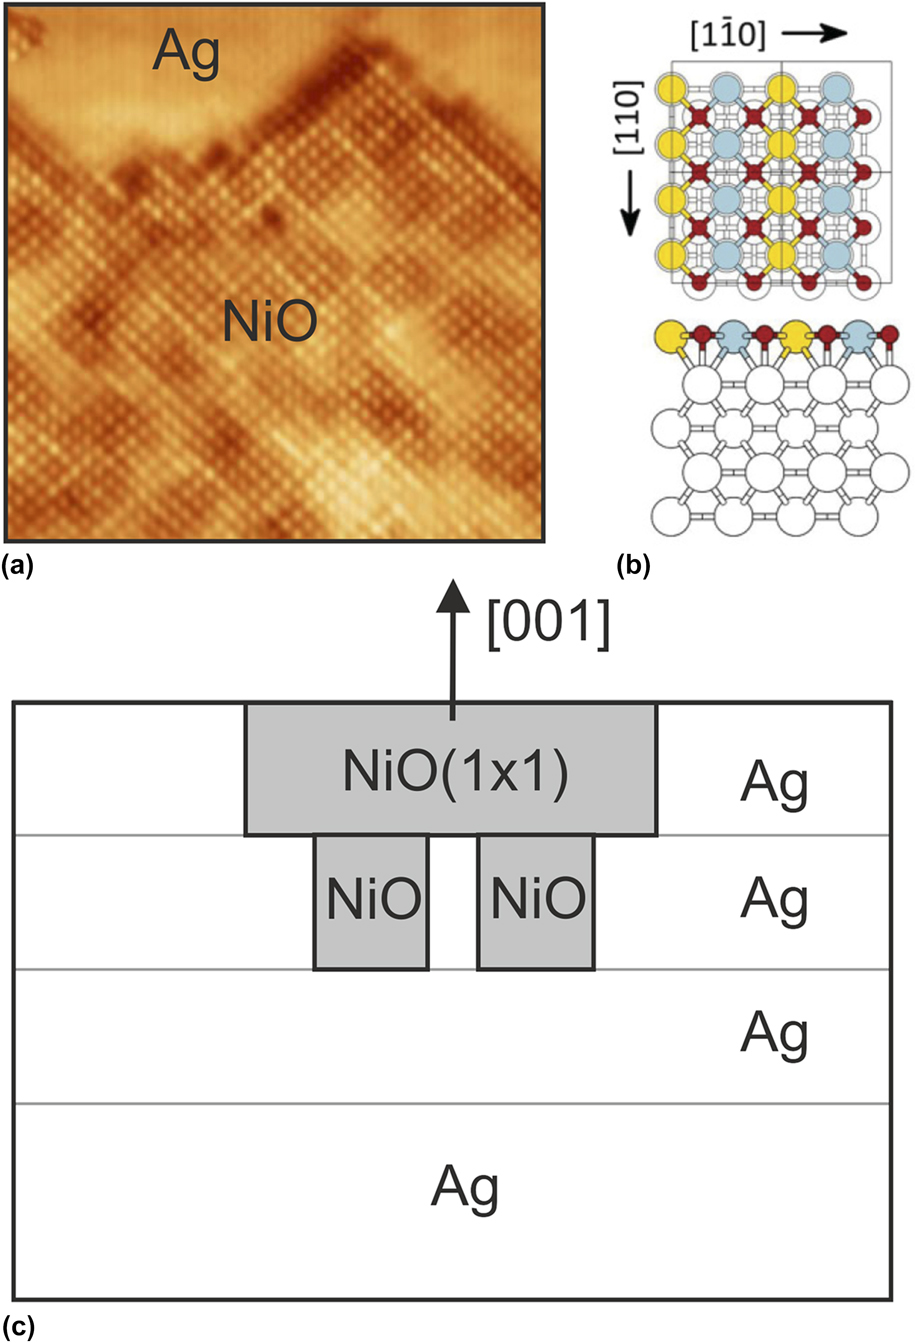
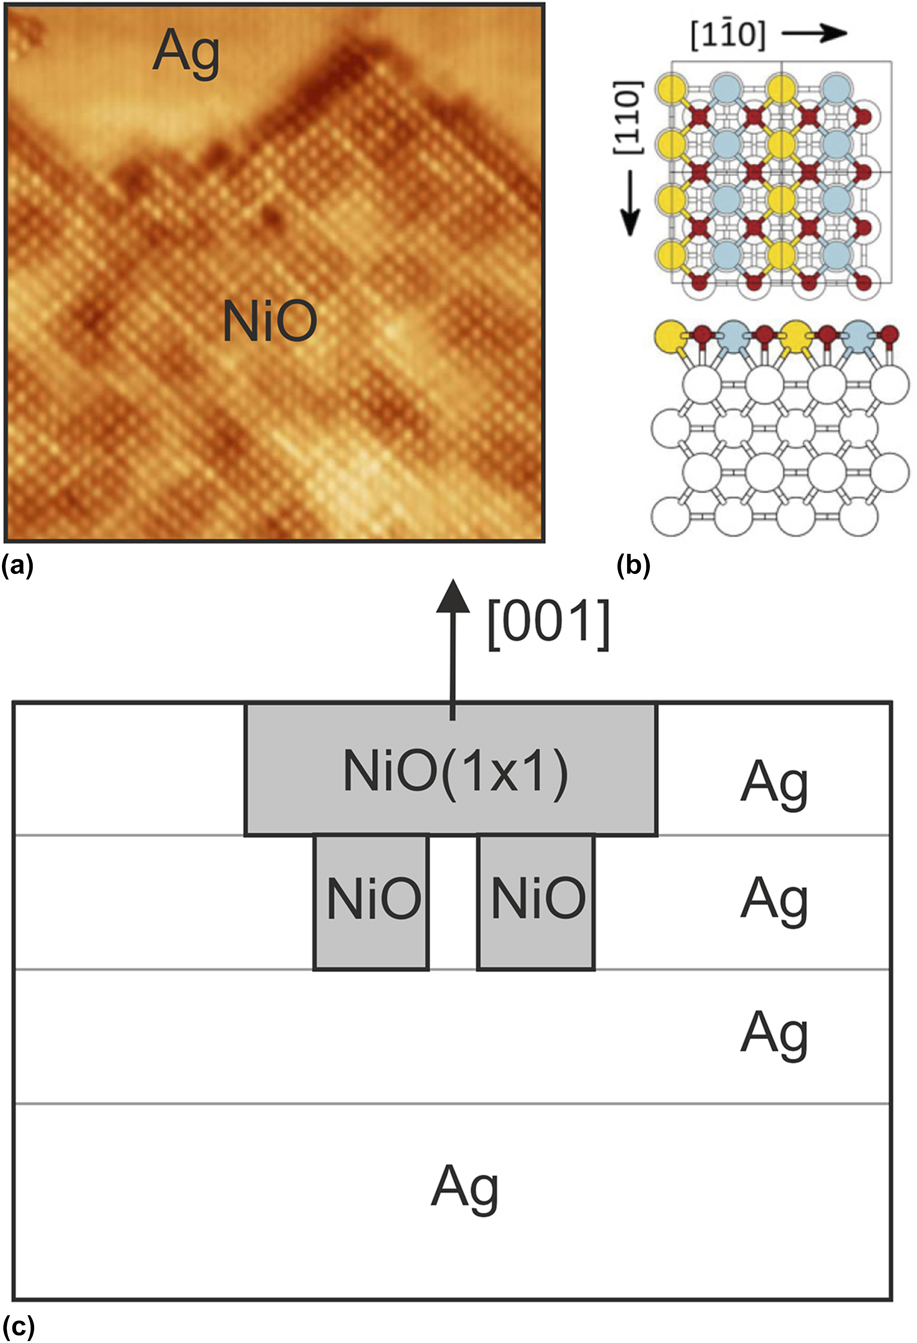
Pseudomorphic rock-salt (100)-type structures have been reported for the monoxides MgO, MnO, CoO, and NiO in surface layers on Ag(100) substrates. Reference Valeri, Altieri, Di Bona, Luches, Giovanardi and Moia14–Reference Steurer, Surnev, Fortunelli and Netzer18 A careful analysis of the situation at the interface, combining experiment and theory, has been given by Steurer et al. for the pseudomorphic NiO(100)1 × 1 phase on Ag(100). Reference Steurer, Allegretti, Surnev, Barcaro, Sementa, Negreiros, Fortunelli and Netzer17,Reference Steurer, Surnev, Fortunelli and Netzer18 Figure 1 gives a summary of the results. Figure 1(a) shows a high-resolution STM image of an island of the NiO(100)1 × 1 phase. The image has been recorded on a Ag(100) surface, which was covered by ∼0.7 monolayer (ML) of the oxide, thus part of the Ag surface is bare (upper part of the image), which is beneficial for high-resolution STM imaging. The oxide surface shows the square lattice of the NiO(100) plane, where the bright protrusions correspond to the Ni atoms. The STM contrast on the NiO surface is not uniform but shows a brightness modulation, indicating a modulation of structural or chemical parameters across the island. The DFT-calculated NiO(100)1 × 1 structure is the thermodynamic ground state of the NiO/Ag(100) system, and a model of the NiO(100)1 × 1–Ag(100) interface is presented in Fig. 1(b). The (1 × 1) oxide unit cell contains one NiO unit, the oxygen atoms are located on top of the Ag atoms, while the Ni atoms are accommodated in the 4-fold hollow sites of the Ag(100) surface. The overlayer is thus pseudomorphic in the sense as defined above. Interestingly, the NiO(1 × 1) islands at submonolayer coverages [as shown in Fig. 1(a)] are not located on-top of the Ag surface, but they are embedded into the surface plane. This has been concluded from the analysis of a large number of experimental STM images and is supported by the DFT simulations, which indicate extra stability for the NiO(1 × 1) phase embedded into the Ag surface. The NiO–Ag bonding at the boundaries of the embedded NiO island is at the root of this extra stability. However, there is an additional stabilization mechanism of the NiO(100)1 × 1 phase, which concerns an interesting strain relaxation mechanism as illustrated schematically in Fig. 1(c). As calculated by DFT and mentioned above, the NiO(1 × 1) monolayer on Ag(100) is subjected to a 2% compressive strain. To accomodate this strain, it is energetically favorable to insert patches of NiO into the second Ag layer [see Fig. 1(c)]. This leads to a partial geometrical relaxation in the NiO layer—note that an NiO(1 × 1) bilayer has a slightly expanded lattice as compared to the monolayer. Experimentally, these second layer patches show up in the STM images with a darker contrast as a result of the modified electronic structure, Reference Steurer, Surnev, Fortunelli and Netzer18 and this is the origin of the brightness modulation on the NiO surface [Fig. 1(a)]. Near the completion of the full monolayer, the NiO(1 × 1) islands percolate, but the overall oxide layer morphology in terms of domain sizes and boundaries depends strongly on the preparation conditions.
The pseudomorphic NiO(100)1 × 1 phase on Ag(100). (a) STM image of an NiO island embedded into the Ag(100) surface (10 × 10 nm2; sample bias V S = −0.85 V, tunneling current I T = 0.5 nA). (b) DFT derived model (O: red; Ni: blue and yellow). (c) Schematic drawing of embedded NiO(1 × 1) with second layer NiO patches. (a) and (b) adapted are from Ref. Reference Steurer, Allegretti, Surnev, Barcaro, Sementa, Negreiros, Fortunelli and Netzer17.
This study of the NiO(100)(1 × 1)/Ag(100) surface, which is formally categorized as a simple pseudomorphic overlayer system, gives us a glimpse of possible complexities at interfaces even for a relatively good lattice match. In the following subsections, more complicated situations will be discussed, where oxide bulk structures and/or stoichiometries are at stake and where the novel structure and phase concepts are encountered.
B. Coherent oxide–metal interfaces
Epitaxial 2-D oxide overlayers with unit cells bearing a simple commensurate relationship to the substrate lattice are examined in this subsection. Many such examples of well-ordered 2-D transition metal oxide systems have been reported in the literature, in particular on group VIII noble metal substrate surfaces [see e.g., Ref. Reference Surnev, Fortunelli and Netzer19 for a comprehensive review]. As a recent example, we cite the growth of a 2-D W-oxide layer on a Pd(100) surface, where a simple c(2 × 2) overlayer structure has been observed. Reference Doudin, Kuhness, Blatnik, Barcaro, Negreiros, Sementa, Fortunelli, Surnev and Netzer20 An interesting aspect of this WO x /Pd(100) system concerns the relief of interfacial strain, which is effectuated via the formation of an antiphase domain boundary lattice. Here, the published results on Pd(100) are briefly reviewed, Reference Doudin, Kuhness, Blatnik, Barcaro, Negreiros, Sementa, Fortunelli, Surnev and Netzer20 and the discussion is then extended to the more complex W-oxide/Pd(1 1 17) system; the latter surface is a high-order vicinal of the Pd(100) surface, where the interfacial coupling of the W-oxide overlayer destabilizes the substrate surface and induces a faceting transition.
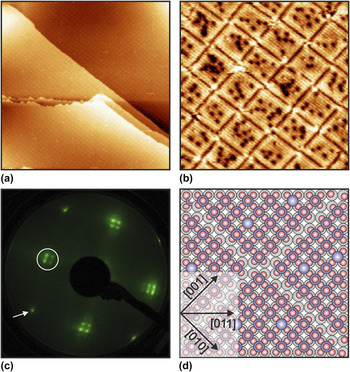
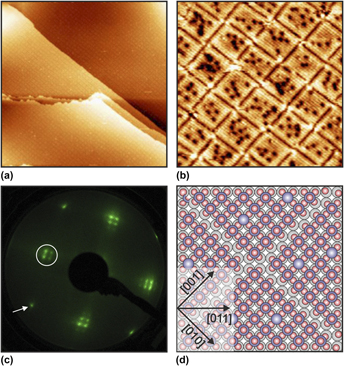
Figure 2(a) shows a large-scale STM image of 1 ML WO x on Pd(100), displaying large (100) terraces covered by a c(2 × 2) structure Reference Doudin21 ; note that the wetting layer is nearly perfect over large surface areas. This W-oxide overlayer has been prepared by deposition of (WO3)3 clusters on to the clean Pd(100) surface at room temperature followed by annealing in 10−7 mbar oxygen at ∼800 K. Careful inspection of the STM image reveals a faint grid, which is due to antiphase domain boundaries. This is more clearly recognized in the higher resolution image of Fig. 2(b), where the dark lines, delineating the square domains, represent the domain boundaries. The bright protrusions inside the domains form the c(2 × 2) oxide lattice [with respect to the Pd(100) surface], while the dark contrast depressions are due to point defects. The LEED pattern [Fig. 2(c)] of the WO x /Pd(100) surface shows the integral order reflection (white arrow) of the (100) substrate and the half-order reflections of the c(2 × 2) overlayer (encircled); the latter are characterized by spot splitting, which is indicative of the ordered antiphase domain lattice. Reference Doudin, Kuhness, Blatnik, Barcaro, Negreiros, Sementa, Fortunelli, Surnev and Netzer20
(a) Large-scale STM image (192 × 192 nm2; V S = +2.45 V; I T = 0.1 nA) of the c(2 × 2) WO3 phase on Pd(100). (b) High-resolution STM image (25 × 25 nm2; V S = +0.1 V; I T = 0.35 nA) showing dark antiphase domain boundaries. (c) LEED pattern of the c(2 × 2) WO3/Pd(100) surface (electron energy E = 49 eV). (d) DFT-derived model of the c(2 × 2) WO3 phase on Pd(100) (O: red; W: blue; Pd: gray). A few O vacancy defects (dark in STM) are shown in light blue (W atoms without terminal O atom). Note also the antiphase domain boundaries. (b) and (c) are adapted from Ref. Reference Doudin, Kuhness, Blatnik, Barcaro, Negreiros, Sementa, Fortunelli, Surnev and Netzer20.

The DFT-derived model of the c(2 × 2) structure is presented in Fig. 2(d). The structure is basically a 2-D sheet cut out of a cubic WO3 crystal parallel to the (100) plane, consisting of a bilayer of a WO2 plane at the interface (corner-shared square WO4 units) and an oxygen layer on top, attached via W=O tungstyl bonds. It is the W=O tungstyl units that are imaged as bright protrusions in the STM image [Fig. 2(b)]. The overall stoichiometry of the oxide is WO3, as confirmed by electron spectroscopic evidence. The oxide layer is under a tensile strain of −2.8% as calculated by DFT. This value corresponds exactly to the lattice mismatch as estimated by using the bulk lattice constants of Pd and WO3; however, this is accidental and the result of a compensation effect of reduced dimensionality and substrate coupling. The extensive DFT simulations of Fortunelli et al. Reference Doudin, Kuhness, Blatnik, Barcaro, Negreiros, Sementa, Fortunelli, Surnev and Netzer20 have shown that the introduction of a lattice of periodic antiphase domain boundaries into the c(2 × 2) WO3 overlayer is energetically favorable and an effective way to reduce the epitaxial strain.
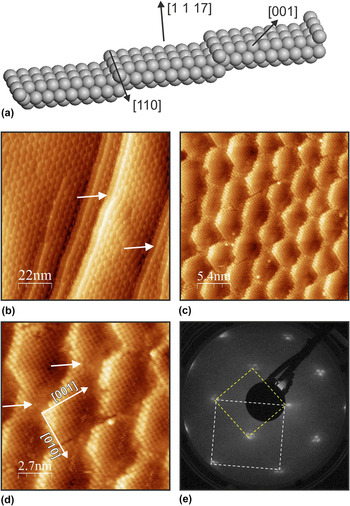
To address the influence of nanoscale disturbances of the substrate surface morphology on the epitaxial growth in the WO3-on-Pd system, the growth of 2-D WO3 on Pd(1 1 17) has been investigated. The Pd(1 1 17) surface is a vicinal to the (100) surface and displays a regular step-terrace arrangement, exposing (100) terraces [9 atom rows (= 23.4 Å) wide] separated by monoatomic straight step edges with (111)-type microfacets [Fig. 3(a)]. Deposition of 0.5 ML of (WO3)3 clusters at room temperature followed by annealing at 800 K in oxygen (5 × 10⁻⁸ mbar) leads to the formation of the epitaxial WO3 c(2 × 2) overlayer as on the flat Pd(100) surface, but the morphology of the stepped substrate has become significantly modified. Figure 3(b) presents an STM overview of the WO3-covered Pd(1 1 17) surface: the array of straight step edges has given way to a “fish scale”-type morphology, with step edges following a zig-zag pattern. The higher resolution STM images Figs. 3(c) and 3(d) reveal that the terraces are covered by the c(2 × 2) oxide but have been segmented into (truncated) square domains. Most terraces are still separated by monoatomic steps, but the average terrace width has expanded to ∼30 Å, which is compensated by occasional step bunching—see arrows in Fig. 3(b). Figure 3(e) shows the LEED pattern of this surface, with substrate (1 × 1) and c(2 × 2) overlayer unit cells indicated: note that both substrate and overlayer spots are split here as a result of the step-terrace morphology. The restructuring of a stepped metal surface under the influence of a 2-D manganese oxide overlayer has been reported previously Reference Franchini, Li, Surnev, Podloucky, Allegretti and Netzer22 and has been rationalized by the formation of oxide stripes with particular (“magic”) widths, which induce particularly stable step edge configurations. A similar mechanism may be invoked here. It is conceivable that the boundaries of the c(2 × 2) structure on the (1 1 17) terraces along the 〈110〉 directions (i.e., the original step edge directions) are less stable than in the 〈001〉 directions. Due to the strong oxide–substrate coupling, the whole metal-oxide step edges in 〈110〉 may become unstable, and the formation of step edges along 〈001〉 directions may become energetically favorable. These form the step-terrace structures of the “scales”, where the 〈001〉 step edges form an angle of 45° with the 〈110〉 step edges, as indicated in Fig. 3(d). No c(2 × 2) antiphase domain boundaries as on the flat (100) surface are observed on the stepped Pd surface because the “scale” domains provide sufficient strain relaxation at their edges. However, adjacent “scale” domains are separated by disorder in the narrow regions of the terraces [see e.g., arrows in Fig. 3(d)].
(a) Rigid sphere model of the Pd(1 1 17) surface. (b) STM image (110 × 110 nm2; V S = +1.0 V; I T = 0.1 nA) of the Pd(1 1 17) surface covered with the c(2 × 2) WO3 layer. (c, d) Higher resolution STM images of the surface of (b) (b: 28 × 28 nm2; V S = +0.19 V; I T = 0.1 nA; c: 14 × 14 nm2; V S = 0.19 V; I T = 0.1 nA). (e) LEED pattern (E = 80 eV) of the c(2 × 2) WO3/Pd(1 1 17) surface. Substrate (1 × 1) unit cell dashed white, c(2 × 2) oxide unit cell yellow.

The 2-D epitaxial growth of W-oxide on Pd(100) and (1 1 17) surfaces reveals that the c(2 × 2) structure derived from a WO3 bilayer sheet (WO2 + O) leads to a robust and stable overlayer configuration. Although interface strain is modest in this system, it is important in determining the morphology of the system. The antiphase domain boundaries on the flat substrate constitute a defect pattern that may introduce interesting aspects in the surface chemical behavior of the WO3–Pd system. On the stepped Pd surface, strain is naturally relaxed at the step edges, but the step edge stability becomes modified by the oxide overlayer, which leads to a structural instability and a faceting transition.
Ternary oxide materials have attained interest in recent photocatalytic applications for solar energy harvesting via hydrogen generation from photochemical water splitting and their ultrathin films find applications in the respective photoelectrochemical devices. Reference Janaky, Rajeshwar, de Tacconi, Chanmanee and Huda23–Reference Yourey, Kurtz and Bartlett26 Epitaxial 2-D layers of ternary tungstate materials have recently been fabricated by a novel on-surface synthesis method: an epitaxial 2-D binary oxide layer on a metal surface has been used as the template for the deposition of a second oxide layer, and a ternary oxide has been generated by a solid state chemical reaction between the two oxides, employing a thermal treatment procedure. This method has been successfully demonstrated by the formation of an epitaxial 2-D CuWO4 layer on a Cu(110) surface Reference Denk, Kuhness, Wagner, Surnev, Negreiros, Sementa, Barcaro, Vobornik, Furtunelli and Netzer27 : a monolayer of (WO3)3 clusters has been deposited on a Cu–O(2 × 1) surface oxide, and a well-ordered CuWO4 phase has been obtained after annealing at 600 K. This CuWO4 layer on Cu(110) constitutes a 2-D nanophase with novel structural and electronic properties. Reference Denk, Kuhness, Wagner, Surnev, Negreiros, Sementa, Barcaro, Vobornik, Furtunelli and Netzer27 It has been shown that this preparation method is more generally applicable and that other metal tungstate compounds can be grown epitaxially. Reference Kuhness28 Here we review our results on the growth of an epitaxial Fe-tungstate layer on Pt(111) to illustrate a coherent-type oxide–metal interface, which is imprinted by the substrate and leads to the formation of a novel structure and oxide stoichiometry.
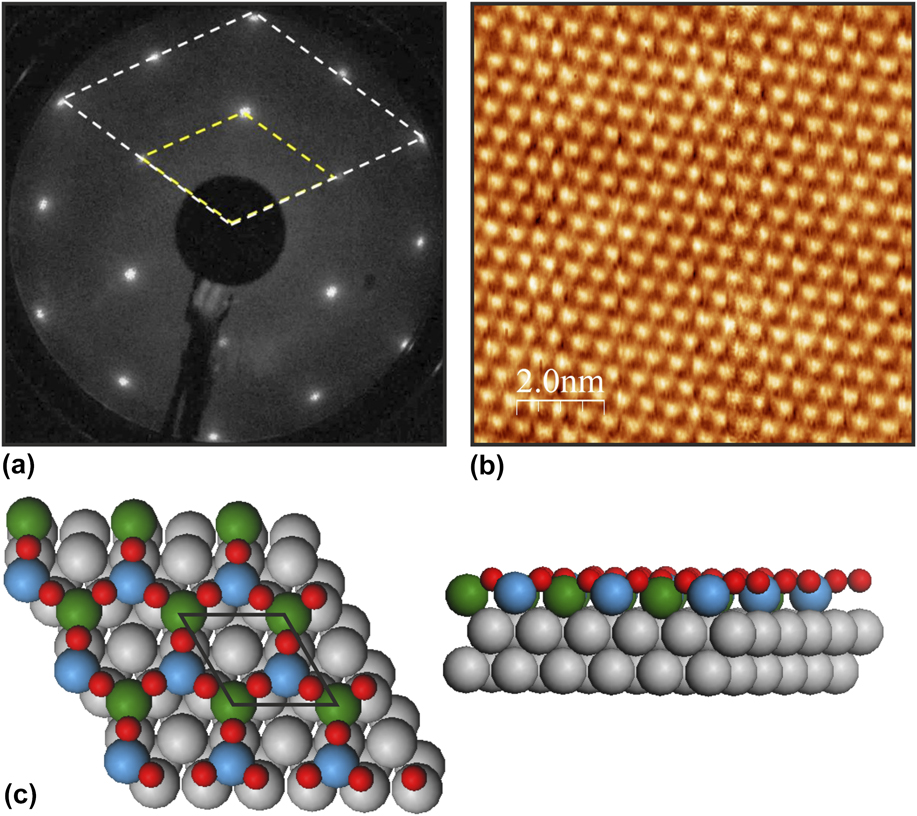
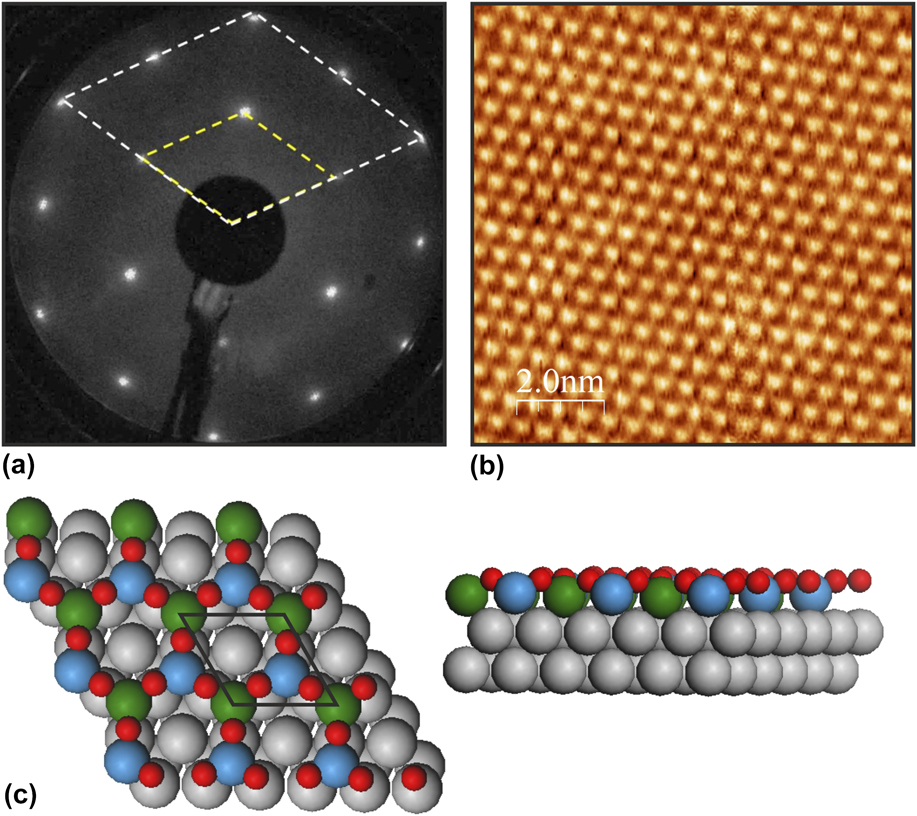
Deposition of 1 ML of (WO3)3 clusters onto a monolayer of FeO(111) on Pt(111) followed by high-temperature annealing leads to a well-ordered (2 × 2) structure [see the sharp LEED pattern, Fig. 4(a)]. Reference Pomp, Kuhness, Barcaro, Sementa, Mankad, Fortunelli, Sterrer, Netzer and Surnev29 Figure 4(b) shows an STM image of the corresponding surface, where the triangular maxima delineate the (2 × 2) unit cell. Comprehensive electron spectroscopic investigation in conjunction with state-of-the-art DFT modeling has led to the construction of a model in terms of a honeycomb lattice of triangular symmetry and a FeWO3 stoichiometry [Fig. 4(c)]. Reference Pomp, Kuhness, Barcaro, Sementa, Mankad, Fortunelli, Sterrer, Netzer and Surnev29 This lattice contains two cations per unit cell at the metal interface with formally mixed oxidation states, Fe2+ and W4+ species, and is terminated by oxygen atoms in Fe–W bridging positions; the metal cations are located in the face-centered cubic and hexagonal close-packed hollow sites of the Pt(111) surface. The DFT calculations revealed that the WO3 groups in the lattice are imaged as the triangular maxima in the STM image of Fig. 4(b) (which has been recorded under empty-state imaging conditions). The honeycomb lattice geometry of 2-D materials is of fundamental interest and has been associated with many of their fascinating properties, such as particular electronic or magnetic properties (e.g., linear band dispersion, topological insulating behavior, magnetic frustration). Indeed, theory predicts a ferromagnetic ground state for the FeWO3 (2 × 2) phase on Pt(111) Reference Pomp, Kuhness, Barcaro, Sementa, Mankad, Fortunelli, Sterrer, Netzer and Surnev29 as a result of magnetic frustration effects; this prediction still awaits experimental confirmation, but experiments to this aim are under way. It is important to emphasize at this point that the parent bulk compound FeWO4 is antiferromagnetic and has a wolframite structure, which bears no relation to the mixed honeycomb lattice of the 2-D FeWO3 phase. The FeWO3/Pt(111) system provides an attractive illustration of how interface interactions may stabilize exclusive 2-D epitaxial phases without the, respective, 3-D bulk counterparts.
(a) LEED pattern (E = 60 eV) of the (2 × 2) FeWO3 structure on Pt(111); (1 × 1) substrate and (2 × 2) overlayer unit cells are indicated. (b) STM image (10 × 10 nm2; V S = −0.2 V; I T = 0.2 nA) of the (2 × 2) FeWO3/Pt(111) surface. (c) DFT honeycomb model of the (2 × 2) FeWO3 phase (O: red; W: green; Fe: blue; Pt: gray).
C. Incoherent oxide–metal interfaces—incommensurate oxide overlayers
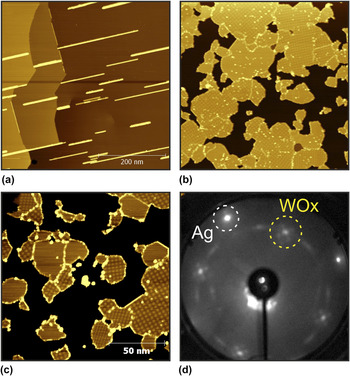
The growth of W-oxide on Ag follows a different pattern as that on group VIII metal surfaces, as discussed in the previous subsection. On Ag(100), a well-defined ordered 2-D W-oxide layer can also be grown via the (WO3)3 cluster route, but the epitaxial relationship is more complex. Deposition of a monolayer of (WO3)3 clusters on Ag(100) at elevated temperature (∼750–800 K) results in a wetting WO x monolayer, which is continuous and extends over several terraces and very large surface areas—see the large-scale STM image of Fig. 5(a), which covers 0.5 × 0.5 μm2. The bright straight lines on the image are due to the beginning of second layer growth, as discussed further below. Deposition of (WO3)3 clusters at room temperature followed by annealing at 750 K leads to a different growth kinetics and to the nucleation of flat oxide islands, which have partly coalesced for the 0.75 ML oxide coverage as shown in Fig. 5(b); the boundaries of the individual islands are still visible here with a slightly brighter contrast. The higher-resolution STM image in Fig. 5(c) reveals that the individual island surfaces feature a square contrast pattern, which varies from island to island. Closer inspection identifies these patterns due to Moiré structures, formed by the superposition of the Ag(100) substrate and a square oxide overlayer lattice. The different Moiré patterns on the various island surfaces indicate that the islands have different rotational orientation with respect to the Ag surface. This is confirmed by the LEED picture from this surface in Fig. 5(d). The first-order reflections from the Ag(100) substrate form the outermost spots, whereas the scattering intensity distributed along the circle inside the Ag spots, with weak maxima at 45° rotation with respect to the Ag spots, originates from the superposition of the first-order reflections of the various WO x islands, with different rotational orientations of their lattices. The WO x monolayer is thus aligned in a rotationally disordered fashion, with some preferential orientation at 0° and 45° [the former is not so apparent in the particular LEED picture of Fig. 5(d)]. The square lattice constant of the WO x overlayer can be derived from atomically resolved STM images Reference Obermüller30 (not shown), the LEED pattern, or from the analysis of the Moiré pattern, which gives the most accurate value due to the Moiré enhancement effect. The latter analysis yields a value of 3.72 Å, Reference Obermüller30 which is very close to the lattice constant of bulk WO3 (a bulk = 3.78 Å). The 2-D WO x phase on Ag(100) thus constitutes an epitaxially ordered, incommensurate, and rotationally disordered monolayer, and this is indicative of a weak overlayer-substrate interaction. Nevertheless, despite this weak interaction, the WO x –Ag interface seems to play an important role in determining the growth morphology of subsequent oxide layers, as discussed below.
(a) Large-scale STM image (500 × 500 nm2; V S = +0.5 V; I T = 0.1 nA) of the continuous WO x monolayer on Ag(100). The bright straight lines are due to the beginning second layer growth. (b) Island growth of WO x on Ag(100) at 0.75 ML oxide coverage (220 × 220 nm2; V S = +0.8 V; I T = 0.3 nA). (c) Higher-resolution STM image (150 × 150 nm2; V S = +0.9 V; I T = 0.2 nA) of WO x islands on Ag(100). (d) LEED pattern (E = 66 eV) of WO x on Ag(100).

At present, no DFT-supported structure model of the 2-D WO x phase on Ag(100) is available. AES and XPS data indicate that WO3 is the most likely stoichiometry. Reference Obermüller30 This together with the close similarity of the lattice constant to bulk WO3 suggests that a model in terms of a 2-D sheet of a WO2 + O bilayer may be a reasonable conjecture, as it has been proposed for the c(2 × 2) WO3 layer on Pd(100) [see Fig. 2(d)]. It is noted parenthetically here that the c(2 × 2) WO3/Pd(100) lattice constant is 3.89 Å. Due to the weaker interaction with the substrate, the 2-D WO3 layer on Ag may be more contracted, in accord with theoretical considerations. Reference Thomas and Fortunelli13,Reference Barcaro, Thomas and Fortunelli31 A remaining question concerns the physical origin of the formation and of the observed stability of this epitaxial 2-D WO3 phase on Ag(100): is it the particular stability of the 2-D WO3 (100) sheet, the absence of interfacial strain due to the weak coupling, or a combination of both? DFT simulations will be necessary to clarify the situation.
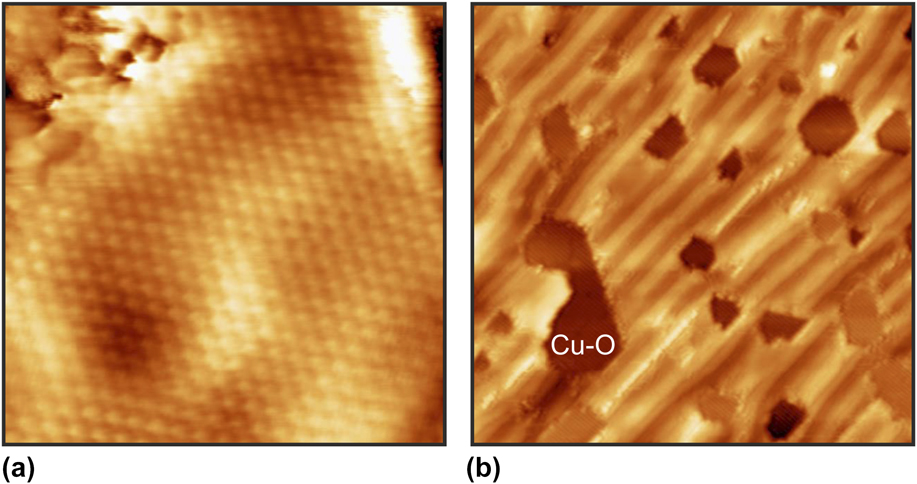
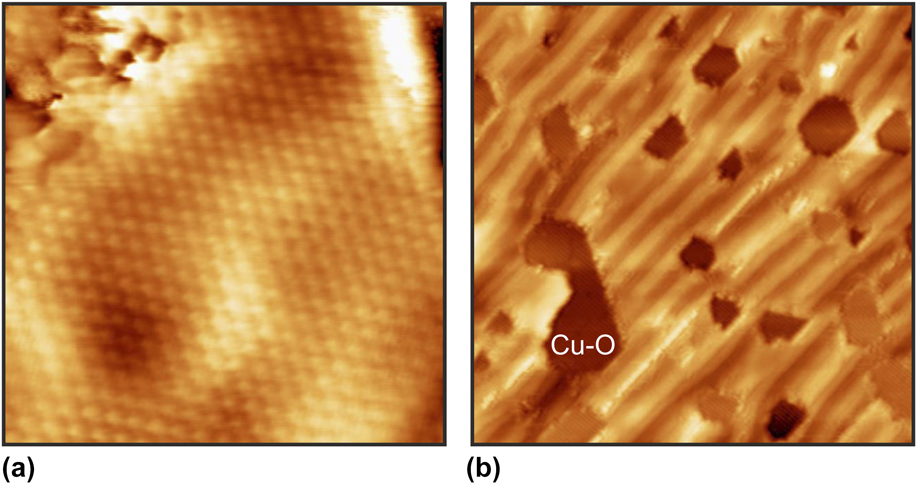
Ordered thin film structures with approximate high-order coincidence lattices in lattice mismatched systems are closely related to the incommensurate systems. The epitaxial growth of an ultrathin ceria phase on Cu(110) provides an illustrative example, Reference Ma, Doudin, Surnev, Barcaro, Sementa, Fortunelli and Netzer32 where the symmetry break at the interface results in the formation of a nanoscopic pattern. The 2-D ceria phase on the Cu(110) surface grows in a hexagonal overlayer with an approximate (3 × 11) coincidence lattice. The CeO2 layer consists of a bulk-like (111) O–Ce–O trilayer sheet with a hexagonal lattice [see Fig. 6(a) for an atom-resolved STM image], which is symmetry mismatched to the rectangular (110) surface. To couple the CeO2 trilayer to the Cu surface, a partially disordered Cu–O intercalated buffer layer has been introduced at the interface, as disclosed by DFT model simulations. Reference Ma, Doudin, Surnev, Barcaro, Sementa, Fortunelli and Netzer32 The epitaxial coupling of the mismatched CeO2 overlayer to the Cu–O surface creates a frustration of the chemical bonding at the interface—regions of strong chemical bonding at favorable epitaxial sites and of weak bonding at unfavorable interface sites change periodically—giving rise to a nanoscopic stripe pattern. Figure 6(b) shows the CeO2 stripe pattern, where the brighter contrast stripes refer to weakly bound regions (overlayer further away from substrate—higher, bright) and the darker contrast to strongly bound regions (overlayer closer to the substrate—lower, dark). The dark holes in the image 6(b) are defects in the CeO2 layer in form of vacancy islands, which reach down to the Cu–O substrate. The formation of a regular pattern morphology in symmetry-mismatched 2-D overlayer systems appears to be a more general phenomenon [see Ref. Reference Wagner, Negreiros, Sementa, Barcaro, Surnev, Fortunelli and Netzer33], which eventually may be put to good use for the bottom-up fabrication of hierarchical functional nanomaterials.
(a) STM image of the CeO2 monolayer on Cu(110) (7.2 × 7.2 nm2; V S = +1.35 V; I T = 0.1 nA). The hexagonal CeO2 lattice is atomically resolved. (b) STM image (57.8 × 57.8 nm2; V S = +1.45 V; I T = 0.1 nA) of the CeO2 stripe pattern on Cu(110). The dark hexagonal features are defects in form of oxide vacancy islands.
D. Beyond the 2-D monolayer: additional growth of WO3 on Ag(100)
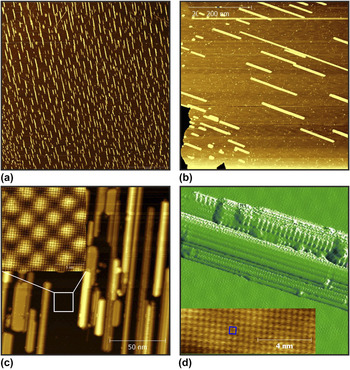
Returning to the WO3/Ag(100) system, we report an interesting observation in the further growth behavior on top of the 2-D oxide system. The WO3 oxide on Ag may be regarded as an essentially substrate-decoupled 2-D oxide layer, yet the interface appears to play an unexpected role in the further oxide growth process. Figure 7(a) displays a very large-scale STM image (2 × 2 μm2) of the Ag(100) surface after the deposition of ∼1.1 ML (WO3)3 clusters at 800 K: the image shows many thin bright needles on a dark smooth background. The needles have various lengths but are all oriented along the same surface direction. The dark background represents the wetting layer with the Moiré structure of the 2-D WO3 monolayer, whereas the bright needles are due to the nucleation of second(-plus) layer WO3, which apparently grows in a very anisotropic and unidirectional fashion. Figure 7(b) gives a zoom-in STM image from this surface, where the Moiré pattern can be weakly recognized and the bright needles reveal some crystalline structure (note that this image has been taken from a different surface position, the Moiré layer has a different orientation). At increased magnification [Fig. 7(c)], the relation between the direction of the needles and the WO3 monolayer lattice can be determined. The STM image Fig. 7(c) has been taken from a more crowded region of the surface, and the needles here are 2–3 layers high. The atomically resolved image of the Moiré structure displayed in the inset of Fig. 7(c) indicates that the needles grow anisotropically along the 〈110〉 directions of the atomic lattice of the WO3 monolayer; these are not necessarily the 〈110〉 directions of the substrate due to the rotational misalignment of the overlayer. Figure 7(d) shows a single WO3 needle in some detail: the needle displays a crystalline structure with different strands and facets. The high-resolution STM image of the inset of Fig. 7(d), taken from a top facet of a needle, discloses the square WO3 lattice. The growth of WO3 on Ag(100) beyond the monolayer is thus characterized by a Stranski–Krastanov type mode, but with a striking uniaxial anisotropy of the island structures, which is tied to the atomic lattice of the overlayer. The latter is not necessarily aligned with the (100) substrate lattice, in fact the needle growth is particularly well developed on WO3 sheets that are rotated by 45° with respect to the substrate. We recall at this point that both the WO3 overlayer structure and the Ag(100) surface have square symmetry. Thus, a break of the square symmetry of the 2-D WO3 surface is necessary to support the anisotropic diffusion and/or attachment processes on the 2nd-plus layer nuclei to yield the observed needle structures. It may be speculated that despite the weak coupling, some second-order interactions at the WO3–Ag interface must exist to give rise to a strain-induced breaking of the square symmetry, resulting in the preference of uniaxial atomic growth processes at the 2-D WO3 surface. Continued growth leads to the percolation of the needles and finally to a continuous film, but the needle-type texture of the film morphology along the initial preferential growth directions remains observable in the thicker film.
(a) Very large-scale STM image (2 × 2 μm2; V S = +1.0 V; I T = 0.1 nA) of WO x on Ag(100), oxide coverage slightly above one monolayer (∼1.1 ML). (b) Zoom-in STM image (500 × 500 nm2; V S = +0.5 V; I T = 0.1 nA) of the WO x /Ag(100) surface, different surface position. (c) High-resolution STM image of WO x needles and of the underlying WO x Moiré monolayer structure (inset). (d) STM image of a WO x needle (50 × 50 nm2; V S = +0.3 V; I T = 0.4 nA). The atom-resolved image (10 × 3.2 nm2; V S = +0.3 V; I T = 0.4 nA) of the inset has been taken from a top facet of a needle. A square WO x unit cell is indicated.

IV. CONCLUSIONS
The growth of 2-D oxide materials on metal single crystal surfaces has been examined with a special focus on epitaxial interface behavior. It is shown that epitaxial 2-D oxide layers can grow out of a variety of interface situations, ranging from pseudomorphic type structures to incommensurate interfaces. Prototypical examples of model systems have been selected to illustrate the different interface scenarios, comprising binary and ternary oxide 2-D overlayers. The interfacial strain and the structural consequences of its release have been discussed and analyzed; it is concluded that even small strain effects can lead to complex interface situations and morphologies. In 2-D oxide systems, the reduced dimensionality and the interfacial coupling to the metal surface conspire to create novel hybrid systems with particular properties in terms of structure, stoichiometry, and electronic and chemical behavior. The flexibility of structure concepts in the reduced dimension makes epitaxial growth a rather common phenomenon in formally lattice mismatched 2-D overlayer-substrate systems. Many novel applications of 2-D oxide materials are presently emerging on the technological horizon, Reference Pacchioni34,Reference Lorenz, Ramachandra Rao, Venkatesan, Fortunato, Barquinha, Barquinho, Salgueiro, Martins, Carlos, Liu, Shan, Grundmann, Boschker, Mukherjee, Priyadarshini, Das Gupta, Rogers, Teherani, Sandana, Bove, Rietwyk, Zaban, Veziridis, Weidenkaff, Muralidhar, Murakami, Abel, Fompeyrine, Zuniga-Perez, Ramesh, Spaldin, Ostanin, Borisov, Mertig, Lazenka, Srinivasan, Prellier, Uchida, Kawasaki, Pentcheva, Gegenwart, Miletto Grazozio, Fontcuberta and Pryds35 ensuring continued future scientific interest for ultrathin oxide films.
ACKNOWLEDGMENT
This work has been supported by the FWF Project P26633-N20.