Introduction
In their prophetic 1980 paper, Mizushima, Jones, Wineman, and Goodenough provided the first evidence of reversible lithium intercalation in a 4 V cathode (LixCoO2).Reference Mizushima, Jones, Weisman and Goodenough1 They proposed the “use of a solid electrolyte of large breakdown voltage to enable a greater fraction of the potential energy density to be utilized.” Experiments in this work were done using a liquid electrolyte: a mixture of a lithium salt (lithium tetrafluoroborate) and propylene carbonate. Harris and TobiasReference Harris2 first proposed the possibility of using alkyl carbonates as solvents for lithium salts in batteries. This class of electrolytes also enables reversible intercalation into and out of graphite, as shown by Fong, VonSacken, and Dahn.Reference Fong, Von Sacken and Dahn3 The lithium-ion battery used today is built on these three discoveries.
The main motivation that drives the development of solid electrolytes today is the possibility of increasing energy density by replacing the graphite anode with a lithium foil, as Goodenough and co-workers recognized. Two classes of solid electrolytes have emerged: mixtures of salts and organic polymers, and inorganic materials—ceramics and glasses—that contain mobile lithium ions.
The field of polymer electrolytes began with the work of Fenton, Parker, and Wright, who discovered that alkali salts dissolve in poly(ethylene oxide) (PEO).Reference Fenton, Parker and Wright4 PEO, which is a semicrystalline solid at room temperature, is only conductive at temperatures above the melting temperature (60°C).Reference Armand5 Above the melting temperature, PEO is a viscoelastic liquid; the linear chains undergo Brownian motion on a time scale that is dictated by chain length.Reference de Gennes6 The conventional approach to “solidifying” viscoelastic chains is chemical cross-linking.Reference Flory7 Inorganic solids that conduct lithium ions have been identified for lithium batteries.Reference Mercier, Malugani, Fahys and Robert8–Reference Zhang and Kennedy12 In such crystalline solids, lithium ions hop from one unit cell to the next, and the motion of the ions depends on the activation barrier along the transport pathway. The motion of ions through inorganic glasses is similar, except for the fact that the atoms surrounding the mobile ions are not arranged on a well-defined lattice. Some inorganic solids exhibit room-temperature conductivity comparable to that of liquid electrolytes.Reference Kamaya, Homma, Yamakawa, Hirayama, Kanno, Yonemura, Kamiyama, Kato, Hama, Kawamoto and Mitsui10
The properties of different solids can be combined in composite electrolytes. Block copolymers, wherein a PEO chain is covalently bonded to a rigid polymer such as polystyrene (PS), are one example. The PS chains are trapped in the glassy domains and the covalent bond prevents Brownian motion of the PEO chains. The presence of rigid nonconducting domains (all known dry lithium-ion-conducting polymers are rubbery) reduces conductivity, but can lead to a dramatic increase in the modulus of the electrolyte. One approach to stabilize the lithium metal anode is through the use of rigid solid electrolytes.Reference Monroe and Newman13 Building robust rechargeable batteries with brittle inorganic crystalline and glassy materials is challenging. Additionally, maintaining electrical contact between the electrolyte and the active particles is difficult due to volume changes that accompany the redox reactions. These obstacles may be overcome through the design of polymer-inorganic hybrid electrolytes wherein the role of the polymer is to endow the electrolyte with ductility and adhesive properties that are necessary for battery manufacturing and operation. In this class of composite electrolytes, both phases need to conduct ions.
This article addresses polymer electrolytes and composites. Our discussion of composites begins with a discussion of block copolymer electrolytes, focusing on the effects of nonconducting domains on ion transport through a polymer. We then discuss composites of polymers and ion-conducting inorganic materials wherein ion transport can, in principle, occur in both phases. The ultimate goal of an electrolyte is to enable redox reactions. We thus conclude with a discussion of reaction kinetics at the interface between solid electrolytes and redox-active solids.
Single-phase polymer and inorganic electrolytes
The number of transport coefficients needed to fully characterize ion transport in an n-component mixture is n(n – 1)/2.Reference Newman and Thomas-Alyea14 In this respect, polymer electrolytes such as mixtures of linear PEO chains and a lithium salt are similar to liquid electrolytes. These binary electrolytes contain three species: the cation, the anion, and the “solvent.” They are characterized by three transport coefficients (n = 3): ionic conductivity, κ (or κc) measured using ac impedance, salt diffusion coefficient, D (or D c) measured using restricted diffusion, and the cation transference number,  $t_ + ^0$ (or
 $t_{ + c}^0$) measured by either the current-interrupt methodReference Ma, Doyle, Fuller, Doeff, De Jonghe and Newman15 or the steady-state current method.Reference Pesko, Timachova, Bhattacharya, Smith, Villaluenga, Newman and Balsara16 The cation transference number is defined as the fraction of current carried by the cations under an applied potential in the absence of a concentration gradient. In addition, ion transport depends on the thermodynamic factor, T h = (1+ dlnγ ±/dlnm), where γ± is the mean molal activity coefficient of the salt and m is the molality of the conducting phase. These parameters for mixtures of PEO (molecular weight, M, 5 kg/mol) and lithium bis(trifluoromethanesulfone)-imide (LiTFSI) are given in Table I at m = 1.4 and 3.6 mol/kg at 90°C. Experiments have shown that κ is independent of polymer molecular weight when M exceeds 5 kg/mol.Reference Shi and Vincent17,Reference Teran, Tang, Mullin and Balsara18 We expect the same to hold for D,
 $t_ + ^0$, and T h.
Transport properties of selected polymer and composite electrolytes at 90°C.
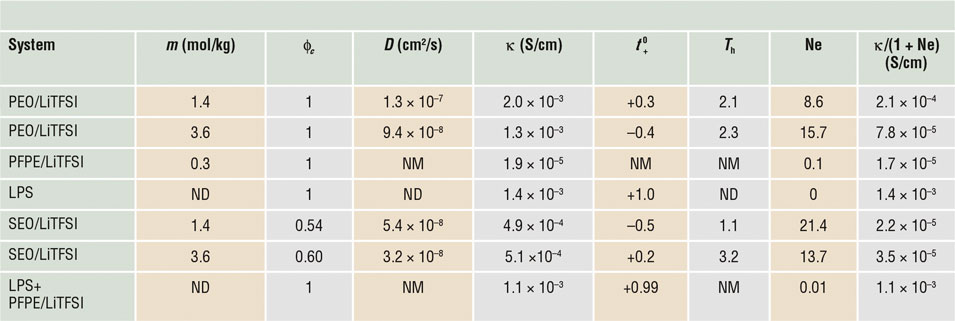
Note: PEO, poly(ethylene oxide); LiTFSI, lithium bis(trifluoromethanesulfone)-imide; PFPE, perfluoropolyether; LPS, lithium-phosphorus-sulfur; SEO, polystyrene-block-polyethylene oxide electrolyte; Ne, dimensionless number that we propose to call the Newman number; ϕc, volume fraction of the conducting phase; NM, not measured; ND, not defined.
The parameters, κ, D,  $t_ + ^0$, and T h of PEO/LiTFSI are strong functions of salt concentration;Reference Pesko, Timachova, Bhattacharya, Smith, Villaluenga, Newman and Balsara16 we have chosen to show data obtained at particular salt concentrations for purposes of illustration. The second law of thermodynamics requires κ, D, and T h to be positive. At m = 1.4 mol/kg,
 $t_ + ^0$ of PEO/LiTFSI is positive, the usual case for most electrolytes. However, at m = 3.6 mol/kg,
 $t_ + ^0$ is negative. Since
 $t_ + ^0$ +
 $t_ - ^0$= 1 by definition, the anion transference number,
 $t_ - ^0$, for the PEO/LiTFSI electrolyte at m = 3.6 kg/mol in Table I is 1.4. The second law of thermodynamics places no bounds on either
 $t_ + ^0$ or
 $t_ - ^0$. Table I also shows data on a less-studied electrolyte wherein LiTFSI is dissolved in a perfluoropolyether (PFPE).
The performance of an electrolyte in a battery depends on its ability to sustain a current under an applied potential. Measurements of this important parameter were first made by Bruce and VincentReference Bruce and Vincent19 and Watanabe et al.Reference Watanabe, Rikukawa, Sanui and Ogata20 Newman and co-workersReference Newman and Thomas-Alyea14,Reference Doyle and Newman21,Reference Balsara and Newman22 have shown that the current under a small applied constant potential is governed by the dimensionless parameter, Ne, defined for univalent salts as:
 $${\rm{Ne}} = {{2\mathrm{\kappa} TR{T_{\rm h}}{{1 - t_ + ^0}^2}} \over {{F^2}Dc}}\,.$$
Here, R, T, and F are the gas constant, temperature, and Faraday’s constant, respectively. The variable c is the salt concentration expressed in molarity. We propose calling the nondimensional parameter defined by Equation 1 the Newman number, in recognition of the central role that J. Newman has played in deriving Equation 1 and for his pioneering efforts to characterize ion transport in electrochemical systems.Reference Newman and Thomas-Alyea14,Reference Doyle and Newman21,Reference Balsara and Newman22
The steady-state current in any homogeneous electrolyte (liquid or solid) under a small applied constant potential (i.e., constant transport coefficients can be assumed) is proportional to κ/(1 + Ne). This enables direct determination of Ne if other transport parameters in Equation 1 are not known.Reference Pesko, Timachova, Bhattacharya, Smith, Villaluenga, Newman and Balsara16 Values of Ne and κ/(1 + Ne) for PEO/LiTFSI and PFPE/LiTFSI are given in Table I.
It is, perhaps, important to discuss the consequences of transference numbers that are less than 0 (or greater than 1). For an electrolyte subjected to a small constant potential in a symmetric lithium-electrolyte-lithium cell, a negative value for  $t_ + ^0$ implies that migration drives both the cation and the anion toward the same electrode. For the case of PEO/LiTFSI at m = 3.6 mol/kg, migration drives the Li+ ions toward the positive electrode while diffusion drives the Li+ ions toward the negative electrode. The net flux of Li+ ions is always toward the negative electrode where they are consumed by the electrochemical reaction; Ne is always positive, even if t + is less than zero or greater than unity (see Equation 1).
The last pure electrolyte listed in Table I is an inorganic lithium-phosphorus-sulfur (LPS) glass (xLi2S.(100 – x)P2S5 (mol%)) developed by Zhang and Kennedy;Reference Zhang and Kennedy12 data are taken from Reference Reference Villaluenga, Wujcik, Tong, Devaux, Wong, DeSimone and Balsara23. In this electrolyte,  $t_ + ^0$ = 1. For electrolytes with
 $t_ + ^0$ = 1, Ne = 0 (see Equation 1). The material contains only one mobile charge carrier in a matrix (n = 2), and the number of transport parameters needed to predict the properties of these electrolytes is 1, usually κ. Polymers with anions that are covalently bonded to the chains and free lithium counterions are also examples of single-ion conductors.Reference Sun, Reeder and Kerr24–Reference Doyle, Fuller and Newman26
The properties of electrolytes are affected by temperature, following the Arrhenius or Vogel–Fulcher–Tammann (VFT) equation.Reference Hallinan and Balsara27 Ion transport in PEO electrolytes depends on the crystallization and glass-transition temperatures, T c and T g. The effect of these parameters on κ has been studied extensively—κ increases sharply above T c and increases with increasing temperature in accordance with the VFT equation.Reference Hallinan and Balsara27 The addition of salt to PEO decreases T c and increases T g. In practical applications, batteries containing PEO-based electrolytes are run at elevated temperatures (e.g., 70 or 90°C [above both T c and T g]). This is not a concern for electric vehicle applications. In fact, thermal management for such a battery is simpler and cheaper than battery management systems for lithium-ion technology wherein the battery must be cooled to maintain temperatures below 35°C. The main limitation with PEO-based electrolytes is that with the addition of salt, T g of the electrolytes increases and this decreases conductivity; the T g of PEO increases from –56 to –27°C when m is increased from 0 to 3.6.Reference Pesko, Jung, Hasan, Webb, Coates, Miller and Balsara28,Reference Lascaud, Perrier, Vallee, Besner, Prudhomme and Armand29 Batteries with PEO electrolytes cannot be operated at room temperature at high rates, not because they are crystalline, but because of the proximity of T g to room temperature.
Composite electrolytes with one conducting domain
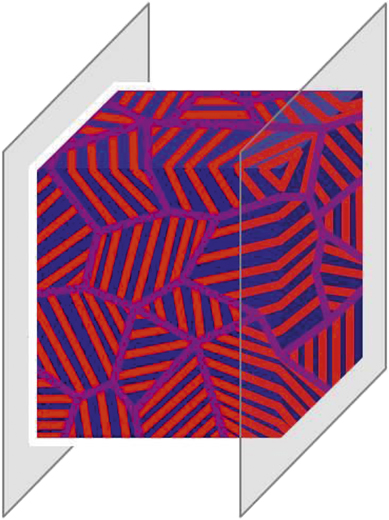
A composite electrolyte has two distributed phases. We first focus on composite electrolytes in which only one of the phases conducts ions (the other phase is an insulator). Examples include a polymer electrolyte matrix filled with nonconducting ceramic particles, conducting particles bound in a nonconducting elastomer, and block copolymers in which one microphase conducts ions and the other does not. Nanoparticles (whether conducting or not) commonly take the form of spheres, rods, or platelets. A diblock copolymer is obtained by covalently linking two chemically distinct chain molecules. In the bulk, these molecules self-assemble into ordered morphologies comprising spheres, cylinders, or lamellae, depending on the volume fraction of the conducting block. The ability to use molecular structure to tune morphology makes block copolymers ideal for quantifying the effect of composite structure on ion transport. A typical block-copolymer electrolyte is shown in Figure 1. Here, we show randomly oriented grains; each grain comprises coherently ordered conducting and nonconducting lamellae.
Morphology of a composite block copolymer electrolyte with randomly oriented grains. Each grain comprises alternating conducting and nonconducting lamellae. We are interested in ion transport between two electrodes, shown as thin plates in the figure.

The most widely studied block copolymer electrolytes for lithium batteries are based on PS and PEO chains (SEO). This block copolymer is mixed with a lithium salt, which more-or-less partitions exclusively into the PEO microphase. The PEO-rich domains thus conduct lithium ions (see previous section) while the glassy and rigid PS microphase provides mechanical strength.Reference Oparaji, Narayanan, Sandy, Ramakrishnan and Hallinan30 Effective-medium theory,Reference Sax and Ottino31 developed by Sax and Ottino to describe gas transport in composite membranes, can be used to predict ion transport in block copolymer electrolytes in which the conducting phase is the minority component.Reference Hallinan and Balsara27 This framework predicts transport through a collection of randomly oriented grains. This approach is valid when the transport path is much larger than the grain size and when the resistance to transport between grains is negligible.
The conductivity of a composite (κ) should increase with the conductivity of the pure conducting phase (κc) and the volume fraction of the conducting phase (ϕc). (Subscript c refers to the pure conducting phase for all variables.) In the simplest case, these increases are linear,
 $${\rm{\kappa }} = {f \over {\rm{\tau }}} {\rm{\phi }_c}{{\rm{\kappa }}_c}\,,$$
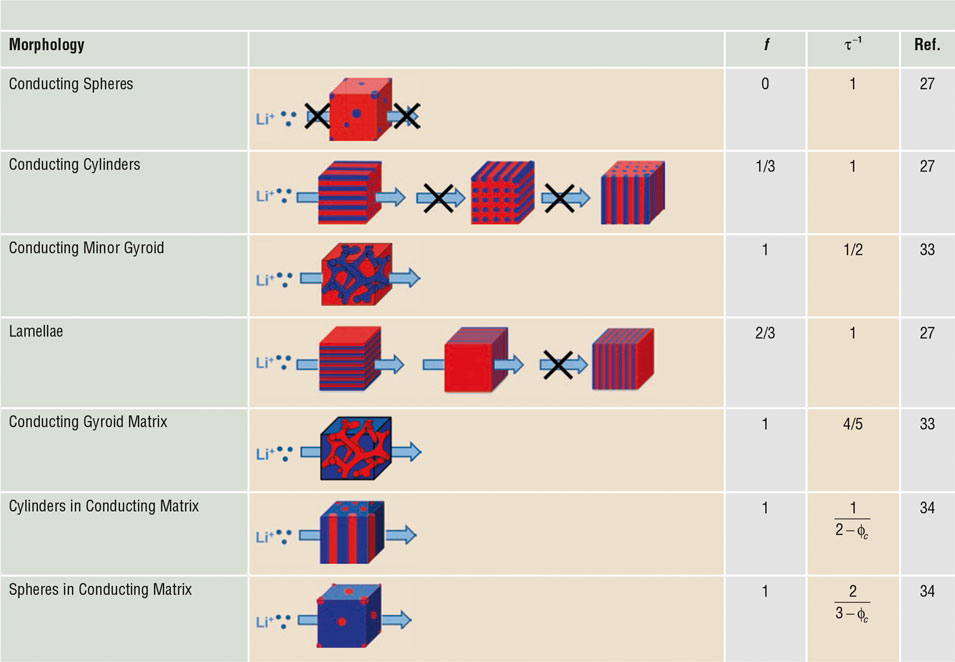
where f is the morphology factor and τ is the tortuosity. The morphology factor arises because certain grain orientations do not contribute to ion transport in the desired direction. The dependence of block copolymer morphology on composition (ϕc) is well established. Table II lists morphologies that are obtained as ϕc increases. We begin by discussing composites with low ϕc (i.e., systems wherein the majority component is insulating). For simplicity, we show grains oriented along the x, y, and z directions of a Cartesian coordinate system oriented along the desired direction of transport. Also given in Table II are values of f and τ−1 for each morphology. In the trivial case wherein the conducting phase takes the form of isolated spheres, no orientation allows macroscopic ion transport, and f is 0.
Morphology and tortuosity factors for transport in ion-conducting block copolymers with specified morphology.Reference Villaluenga, Chen, Devaux, Hallinan and Balsara32
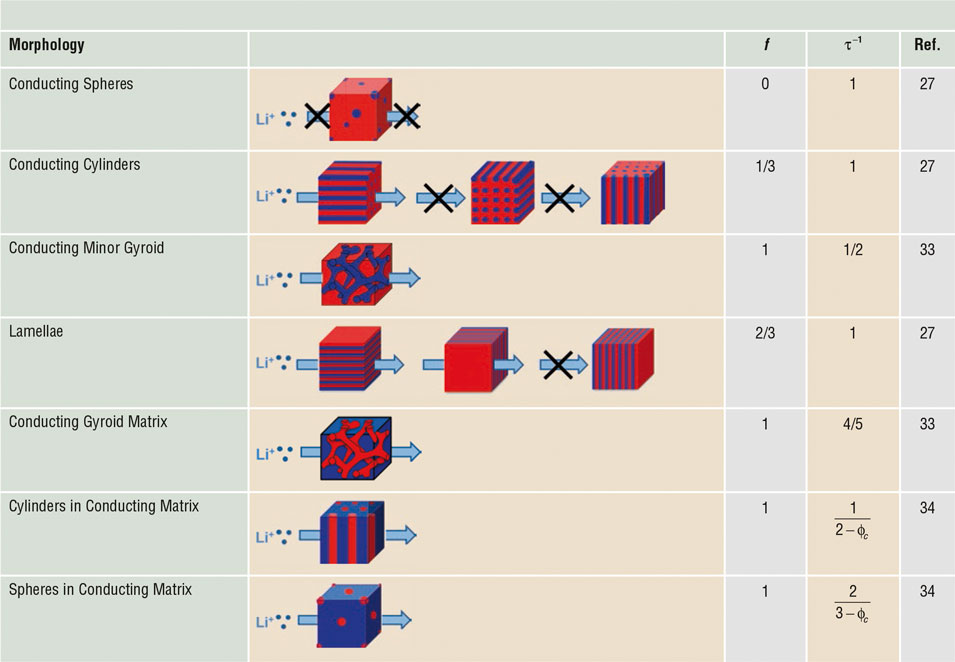
An X over an arrow indicates that ion transport does not occur in the specified direction.
One out of three cylindrical grains contributes to transport, while two out of three lamellar grains contribute to transport. Thus, for cylinders and lamella, f is 1/3 and 2/3. The calculations of Sax and Ottino averages over all possible orientations of lamellar and cylindrical grains.Reference Sax and Ottino31 The final results of these calculations are identical to those presented here based on simple arguments. In a narrow composition window between cylinders and lamellae, block copolymers form triply connected networks called the gyroid phase. Here, all grains contribute to transport and f is 1. However, the path of the ions is tortuous in this case. The tortuosity of the network in the block copolymer gyroid phase was recently shown to be a weak function of ϕc, and τ–1 was found to be approximately 1/2 and 4/5 when the network is the minority and majority phase, respectively.Reference Shen, Brown and Hall33
The matrix in block copolymers with ϕc > 0.676 is conducting, and f = 1 in this regime. The tortuosity of a composite comprising a conducting matrix and randomly placed insulating spheres was derived by MaxwellReference Maxwell35
 $${\rm{\tau }}^{ - 1} = {{d - 1} \over {\left( {d - {\rm{\phi }_c} } \right)}}.$$
Equation 3 applies in the limit of dilute, insulating spheres (d = 3) and cylinders (d = 2).Reference Torquato36 This gives τ–1 for the sphere and cylinder phases at high ϕc in Table II.
Ion transport in a composite with one conducting phase is described by the same three transport coefficients and the same thermodynamic factor that are used to describe homogeneous binary electrolytes. The salt diffusion coefficient is given by:
 $$D = {f \over {\rm{\tau }}}{D_c}\,.$$
The rationale for Equation 4 (absence of ϕc in the equation) is straightforward. Imagine an experiment wherein one creates a salt concentration gradient in a single lamellar grain by applying an electric field with suitable electrodes, and studies the relaxation of this gradient. This relaxation will be affected by f and τ, due to the morphology and orientation of the grain, but not ϕc. Similar arguments lead to the conclusion that  $t_ + ^0$ and T h are affected by neither f , nor τ, nor ϕc.
 $$t_{ + c}^0 = t_ + ^0\,{\rm{and}}\,{T_{hc}} = {T_h}\,.$$
The Newman number for a composite can then be expressed in terms of the transport properties of the composite as:
 $${\rm{Ne}} = {{2{\rm{\kappa }}TRT_h (1 - t_0^ + )^2 } \over {F^2 {Dc}{\rm{\phi }_c} }}\,,$$
where c is the salt concentration in the conducting phase.
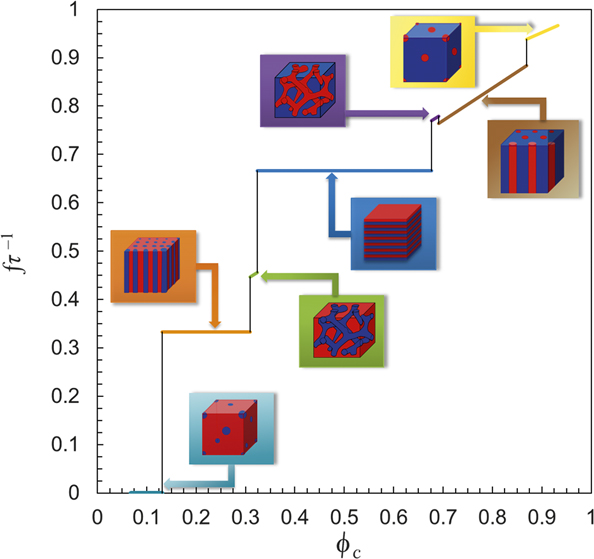
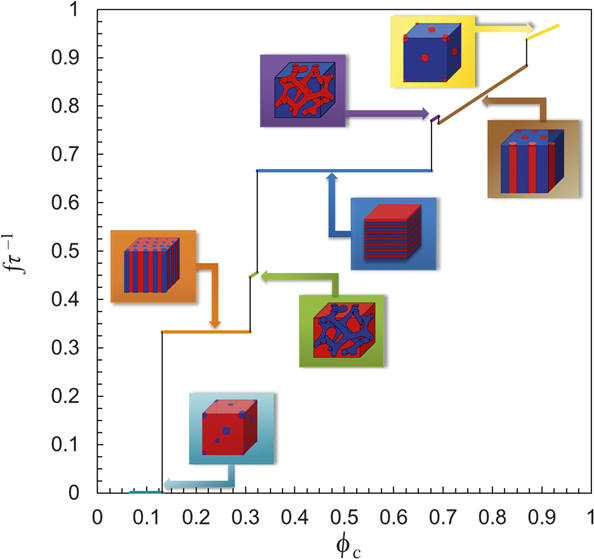
The conductivity (κ) and diffusivity (D) of composite electrolytes depend crucially on fτ–1. The dependence of this parameter for block copolymer electrolytes on ϕc is shown in Figure 2. The volume fractions at which morphological changes occur are from calculations for a neutral (ion-free) block copolymer that is strongly segregated (χN = 80, where χ is the Flory–Huggins interaction parameter and N is the chain length).Reference Matsen and Bates37,Reference Cochran, Garcia-Cervera and Fredrickson38
The ratio of the morphology factor, f, and tortuosity, τ, for composite block copolymer electrolytes with one conducting phase as a function of the volume fraction of that phase. Includes conducting spheres, conducting cylinders, conducting minor gyroid, lamellae, conducting gyroid matrix, cylinders in conducting matrix, and spheres in conducting matrix. All transport properties of the composite can be estimated using this plot.
Complete electrochemical characterization of a block copolymer electrolyte has been recently completed.Reference Villaluenga, Pesko, Timachova, Feng, Newman, Srinivasan and Balsara39 The results obtained for a lamellar SEO block copolymer electrolyte with ϕc in the vicinity of 0.5 is included in Table I. The salt concentration in the PEO lamellae is calculated under the assumption that all of the added salt partitions into the PEO lamellae. The model presented here predicts that κ/ϕcκc = D/D c = f/τ = 0.67, and  $t_ + ^0$/
 $t_{ + \rm{c}}^0$ = T h/T hc = 1. The data in Table I are not in agreement with this expectation. For m = 1.4, κ/ϕcκc = 0.45, D/D c = 0.42,
 $t_ + ^0$/
 $t_{ + \rm{c}}^0$ = –1.67, and T h/T hc = 0.52. For m = 3.6, κ/ϕcκc = 0.66, D/D c = 0.34,
 $t_ + ^0$/
 $t_{ + \rm{c}}^0$ = –0.50, and T h/T hc = 1.39. These results suggest that the intrinsic ion transport properties of salt-containing microphases in block copolymer electrolytes differ significantly from those of pure homopolymer electrolytes. One issue is that the transport coefficients (particularly
 $t_ + ^0$) are sensitive functions of m. If the distribution of salt in PEO is affected by the presence of other phases, then one may expect more complex relationships between the transport properties of block copolymer and homopolymer electrolytes. The present discussion is a simple starting point for understanding the factors that govern ion transport in composite electrolytes.
Composites comprising insulating nanoparticles such as silica or titania in PEO/salt mixtures have been studied extensively. Early work suggested that these composites had significantly higher conductivity than the pure electrolyte; at some compositions the reported composite conductivity was three orders of magnitude higher.Reference Croce, Appetecchi, Persi and Scrosati40 The framework presented in this article does not support these results. Most of the work that followed the original studies has shown that the conductivity of amorphous PEO/salt mixtures with and without added nanoparticles are similar.Reference Golodnitsky, Ardel and Peled41 Work from our laboratory has shown that adding titania nanoparticles reduces the conductivity of block copolymer electrolytes.Reference Gurevitch, Buonsanti, Teran, Gludovatz, Ritchie, Cabana and Balsara42 One of the problems with nanoparticle/polymer mixtures is aggregation of the particles driven by depletion interactions.Reference Gast and Leibler43 The morphology of these composites can thus evolve with time at temperatures above the T g of the polymer electrolyte.
The morphology of many composites made by conventional blending processes such as ball-milling or slurry casting is more complex than the ideal morphologies shown in Table II. In such cases, it is customary to use empirical relationships such as the Bruggemann equation to evaluate τ (assuming f = 1).Reference Bruggeman44
 $${\rm{\tau }} = {\rm{\beta }}{\rm{\phi }_c}^{1 - {\rm{\alpha }}} \,,$$
where β and α are empirically determined parameters. β is often taken as 1 and α as 1.5.Reference Thorat, Stephenson, Zacharias, Zaghib, Harb and Wheeler45
Composite electrolytes with two conducting domains
It is not difficult to imagine composite electrolytes with the geometries described in Table II wherein both phases are ionic conductors. There are a few inorganic glass-ceramics and crystals with conductivities that are in the vicinity of 10–2 S/cm (70Li2S.30P2S5 glass-ceramic, Li10GeP2S12, and Li9.54Si1.74P1.44S11.7Cl0.3) at room temperature.Reference Kamaya, Homma, Yamakawa, Hirayama, Kanno, Yonemura, Kamiyama, Kato, Hama, Kawamoto and Mitsui10,Reference Seino, Ota, Takada, Hayashi and Tatsumisago46,Reference Kato, Hori, Saito, Suzuki, Hirayama, Mitsui, Yonemura, Iba and Kanno47 The motivation for blending a polymer with inorganic particles is to address the limitations of pure inorganic materials, which are brittle and difficult to process. Very little is known about such systems at this time. The simplest composite is one wherein both phases are single-ion conductors (Ne = 0). Ion transport in such systems is fully characterized by κ. Since the ion of interest traverses both phases, and particular grain orientations do not forbid transport, a simple starting point is to assume that κ of the composite is given by a volume-fraction-weighted mean of the conductivities of the phases. Assuming that the composite comprises particles dispersed in a matrix,
 $${\rm{\kappa }} = {\rm{\phi }_m} {\rm{\kappa }}_m + \left( {1 - {\rm{\phi }_m} } \right){\rm{\kappa }}_p \,,$$
where κi is the conductivity of phase i (i = m for matrix and p for particle). Equation 8 would apply to materials containing parallel transport pathways through both phases. For conducting particles dispersed in a conducting matrix, more sophisticated analysis of charge transport was done by Maxwell, leading to the generalized equation:
 $${{\rm{\kappa }} \over {{{\rm{\kappa }}_m}}} = {{\left[ {d\left( {1 - {\rm{\phi }_m}} \right) + {\rm{\phi }_m}} \right]{{{{\rm{\kappa }}_p}} \over {{{\rm{\kappa }}_m}}} + \left( {d - 1} \right){\rm{\phi }_m}} \over {{\rm{\phi }_m}{{{{\rm{\kappa }}_p}} \over {{{\rm{\kappa }}_m}}} + \left( {d - {\rm{\phi }_m}} \right)}}\,,$$
where spherical (dimension, d = 3) or cylindrical (d = 2) particles are included. For the cylinder case, it is assumed that the cylinders are long with axes oriented normal to the transport direction, and thus ion transport reduces to a two-dimensional problem. For the case of long and wide platelets (d = 1), Equation 9 reduces to the volume-fraction-weighted harmonic mean, which applies to materials containing transport pathways in series. If the fraction of parallel and series pathways is known, such as in block copolymers, Equations 8 and 9 can be combined appropriately.Reference Sax and Ottino31
If the phases that make up the composite electrolyte are different binary electrolytes comprising the same lithium salt, then n = 4. If a single-ion conductor is dispersed in a binary polymer electrolyte, then n is also equal to 4. In these cases, six transport coefficients are necessary to describe ion transport in these composites. It is not clear what these transport coefficients are or how they might be measured. Additional parameters related to interfacial transport, particularly due to the mismatch in  $t_ + ^0$, may need to be introduced.
Strangely, addition of single-ion conducting particles at low volume fractions has not shown significant conductivity enhancements in polymer electrolyte.Reference Keller, Appetecchi, Kim, Sharova, Schneider, Schuhmacher, Roters and Passerini48 Similarly, at high particle volume fractions, the use of a conducting polymer binder does not improve conductivity beyond that found when conductive particles are bound by an inert polymer.Reference Skaarup, West, Julian and Thomas49 The major impediment is thought to be large interfacial resistance between conductive particles and conductive polymer.Reference MacFarlane, Newman, Nairn and Forsyth50 Experiments show that as the particle volume fraction is increased, the lithium-ion-transport pathway transition from purely through the polymer matrix to purely through percolated particles.Reference Zheng and Hu51
The large interfacial resistance between polymer and ceramic conductors is likely to arise due to a transference number mismatch. The ceramic particles are single-ion conductors, whereas both cations and anions are mobile in PEO electrolytes. At low particle volume fractions, the particle cannot contribute to conduction because anions must diffuse with Li+ in order to maintain electroneutrality. As depicted schematically in Figure 3, the necessity for anions, X–, to diffuse around particles limits transport of Li+. Even if Li+ were to diffuse through the particle, it would need to “wait” for the anion. This transference number mismatch is manifested as polarization losses in cells containing a laminated electrolyte comprising a binary electrolyte and a single-ion conductor in series.Reference Mehrotra, Ross and Srinivasan52 Such polarization losses have been modeled using the concept of charge-transfer reaction (discussed in more detail in the next section).Reference Schleutker, Bahner, Tsai, Stolten and Korte53
Schematic of a composite electrolyte with single-ion conducting particles and binary polymer electrolyte matrix.

These arguments regarding transference number mismatch are supported by results of a recent study that combined a single-ion conducting polymer electrolyte with conducting particles.Reference Villaluenga, Wujcik, Tong, Devaux, Wong, DeSimone and Balsara23 This composite was based on LPS glass electrolyte and PFPE/LiTFSI polymer electrolyte (the last entry in Table I). The conductivity of the composite was predicted by the volume-fraction-weighted average of the conductivities of the neat components. The values of ionic conductivity predicted are similar to those obtained experimentally. The term κ/(1 + Ne) for this composite is very close to the value of single-ion conductor LPS electrolyte, which corresponds to the highest value in Table I.
Reaction kinetics at solid-electrolyte–electrode interfaces
Just as the ion transport previously described is important in the bulk of electrolytes, reaction kinetics dictate behavior at the electrolyte–electrode interface. When ions reach the boundaries of an electrolyte (whether solid or liquid), they are consumed or generated via reaction with an electrode. In fact, it is the consumption at one electrode and generation at the other electrode that drives a current through a battery. Complete understanding of an electrolyte’s performance in a battery therefore requires knowledge of the electrochemical reaction kinetics. To measure reaction kinetics, it is important to achieve conditions in which the reaction is rate limiting. Two kinetic processes occur shortly (less than 10 ms) after the imposition of current—ohmic resistance dictated by κ and capacitive charging of the electric double layer. Then, the reaction kinetics tends to be rate limiting until a concentration gradient develops in the electrolyte due to mass transport limitations. The challenge is usually identifying conditions in which the reaction, rather than mass transport, limits kinetics. In single-ion conductors in which concentration gradients do not develop, this is trivial.
In binary liquid electrolytes, this challenge is traditionally met with a rotating disk electrode (RDE), which convectively mixes the electrolyte, minimizing concentration gradients so that reaction kinetics are rate limiting.Reference Bard and Faulkner54 Convective mixing is not possible in solid electrolytes, but there are other methods for determining the exchange current density, i 0, which represents the electrochemical reaction rate at equilibrium.Reference Bard and Faulkner54
Regardless of the experimental technique, current versus voltage data is analyzed with an appropriate reaction model, such as the Butler–Volmer model for an elementary, one-electron reaction between an oxidized and a reduced species,  $O + e^ - \begin{array}{*{20}c} {k_c } \\ \rightleftharpoons \\ {k_a } \\ \end{array} R$. Taking a lithium metal electrode as an example, O = Li+ and R = Li. The Butler–Volmer model can then be expressed as follows:Reference Newman and Thomas-Alyea14
 $$i = {i_0}\left[ {\exp \left( {{{{{\rm{\alpha }}_a}F{\rm{\eta }}} \over {RT}}} \right) - \exp \left( {{{{{\rm{\alpha }}_c}F{\rm{\eta }}} \over {RT}}} \right)} \right]\,,$$
where i is the net current density (mA/cm2). Under open-circuit conditions in an electrochemical cell (i = 0), both oxidation and reduction reactions occur at equal rates. i 0 is proportional to a rate constant used in ordinary chemical reaction kinetics, k 0 (cm/s), according to:
 $${i_0} = F{k_0}c_o^{{{\rm{\alpha }}_c}}c_R^{{{\rm{\alpha }}_a}}\,,$$
where c O and c R are the bulk concentrations of the oxidized and reduced species, respectively. αc and αa are the apparent transfer coefficients for the cathodic (reduction) and anodic (oxidation) reactions. They represent the fractional amount that each reaction is favored under an applied overpotential, η, and usually sum to unity for elementary, one-electron reactions.
One of the simplest methods for estimating i 0 is electrochemical impedance spectroscopy (EIS), which probes the interfacial resistance between a reversible electrode, such as lithium metal, and an electrolyte. If the measured resistance is dominated by charge-transfer resistance, R ct, then i 0 can be calculated simply as:
 $${i_0} = {{RT} \over {F{R_/rm{ct}}}}\,.$$
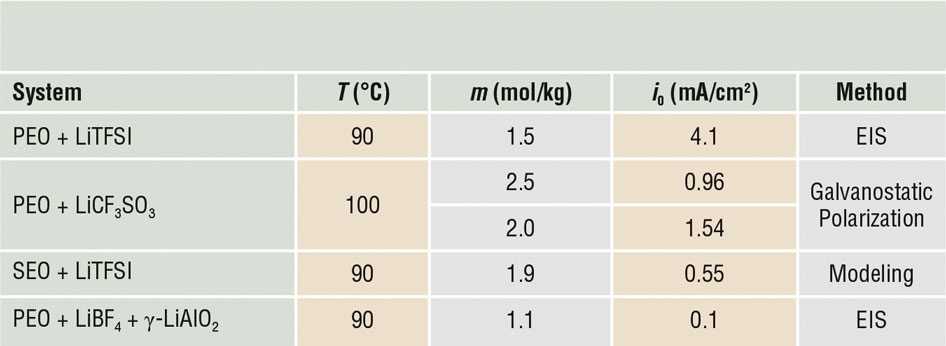
EIS was conducted on Li–PEO/LiTFSI–Li cells as a function of temperature. i 0 of the Li/Li+ reaction was determined with Arrhenius parameters based on Equation 12 and is reported in Table III.Reference Driscoll, Yang, Gervais and Kerr55 This approach has also been applied to a composite electrolyte composed of a PEO electrolyte matrix and γ-LiAlO2 ceramic particles.Reference Scrosati, Croce and Panero56 R ct was determined based on a deconvolution of EIS data and i 0 (reported in Table III) was found to be significantly lower than reports for PEO. This highlights an important limitation of the EIS approach. The assumption that charge-transfer resistance dominates is tenuous considering the possibility of contact resistance and formation of solid electrolyte interphases due to spontaneous reaction between electrolyte and lithium.
Exchange current density from various methods for lithium plating/stripping with specified electrolyte.

Note: PEO, poly(ethylene oxide); LiTFSI, lithium bis(trifluoromethanesulfone)-imide; SEO, polystyrene-block-polyethylene oxide electrolyte.
Another approach to measure i 0 is potential step voltammetry in which a current measurement is taken at a constant applied voltage. Equivalently, galvanostatic polarization (current-controlled measurement) was used in older literature due to the difficulty of controlling voltage with instruments in use at the time. When a potential is applied to a cell originally at rest, the ensuing current can be decomposed into a capacitive current, due to the rate of potential change, and a Faradaic current, due to charge transfer between electrode and electrolyte. The capacitive current acts to charge the electric double layer that exists at the electrode–electrolyte interface, but does not drive a reaction. The Faradaic current, on the other hand, is due to electrochemical reactions and is relevant for an operating battery. The primary disadvantage of galvanostatic polarization is that the voltage changes throughout the experiment, so that measurements are not purely Faradaic. With potential step voltammetry, capacitive charging decays rapidly.
With solid electrolytes, a rest step between measurements allows the cell to return to an equilibrium state via diffusion, which dissipates any concentration gradients that were generated by the previous measurement.Reference Hallinan, Rausch and McGill57 The length of the rest step is related to Ne. For sufficiently slow reactions (with respect to diffusion) and sufficiently small applied overpotentials, reaction kinetic control can be maintained. The results of a representative study using galvanostatic polarization to measure i 0 of Li/Li+ reaction kinetics in PEO electrolyte is reported in the second row of Table III.Reference Sequeira and Hooper58 This approach can also be applied to kinetics of other electrodesReference Swiderska-Mocek and Lewandowski59 and electrolyte degradation reactions.Reference Hallinan, Rausch and McGill57
If all transport parameters of an electrolyte are known, then battery cycling can be phenomenologically modeled using i 0 as an adjustable parameter. In fact, i 0 for lithium plating and stripping has been determined by regressing a full cell model to constant-current cycling data from Li–SEO/LiTFSI–Li cells.Reference Wu, Javier, Devaux, Balsara and Srinivasan60 Despite constant transport parameters being used in the model, i 0 from this study compares reasonably well with the other reports in Table III.
Considering the differences in PEO molecular weight, anion type, and lithium metal surface preparation methods (causing uncertainty in the contact and passivation layer resistances at the Li–electrolyte interface), the agreement in Table III is remarkable. i 0 between Li and PEO-based electrolytes is on the order of 1 mA/cm2. Interestingly, this is similar in magnitude to that reported for a carbonate-based liquid electrolyte used in lithium-ion batteries,Reference Jasinski, Delahey and Tobias61 but an order of magnitude lower than an ether-based liquid electrolyteReference Hedges and Pletcher62 and an inorganic solid electrolyte.Reference Chiku, Tsujiwaki, Higuchi and Inoue63
Conclusions
Composite polymer electrolytes allow material combinations that can address processing challenges, maintain adhesion during battery cycling, and enable higher charge and discharge rates. There is much, however, to be done in order to build a framework that predicts battery performance in composite electrolytes, not to mention the rapid recent development of new electrolyte materials. We have attempted to provide a simple starting point upon which such a framework might be built. A key component of the framework is the Newman number that, in conjunction with conductivity, provides a prediction of electrolyte performance at low rates. Ultimately, predicting the performance of electrolytes at high charge and discharge rates requires knowledge of the dependence of transport and thermodynamic properties (κ, D,  $t_ + ^0$, and T h ) as a function of salt concentration.
The effective medium approach enables calculation of transport and thermodynamic properties of composite electrolytes with one conducting phase in terms of the volume fraction of the conducting phase. It must be recognized that the effective medium model is only a starting point that does not address factors such as interparticle interactions and resistance between grains. It is not straightforward to extend effective medium framework to composites with two ion-conducting phases. Even for the simple case of single-ion conductors dispersed in a conventional binary polymer electrolyte, the six transport coefficients necessary to characterize the system have not yet been identified. We expect the transport number mismatch between the phases to have a large effect on ion transport. We conclude by noting the importance of quantifying reaction kinetics in addition to measuring transport parameters of electrolytes for predicting the charge-discharge behavior of lithium batteries containing solid electrolytes. This is particularly challenging in solid electrolytes due to the lack of convection.
Lithium-ion technology based on transition-metal oxide cathodes, graphite anodes, and carbonate-based liquid electrolytes provides hope for powering the emerging clean-energy landscape. In spite of the challenges that remain, solid electrolytes offer the most promising approach to improve upon this technology, as stated by Goodenough and co-workers in 1980.
Acknowledgments
This work was supported by the Joint Center for Energy Storage Research, an Energy Innovation Hub funded by the US Department of Energy, Office of Science, Basic Energy Sciences, under Contract No. DEAC02–06CH11357. D.H. acknowledges support from NSF CAREER Award No. 1751450 and NSF CREST Award No. 1735968, as well as the LG Chem Battery Innovation Contest.

Daniel T. Hallinan Jr. is an assistant professor of chemical engineering at the Florida A&M University–Florida State University College of Engineering. He received his bachelor’s degrees from Lafayette College and his PhD degree from Drexel University. He was a postdoctoral fellow at Lawrence Berkeley National Laboratory and the University of California, Berkeley. His current research focuses on fundamental polymer physics of nanostructured materials, as well as applications related to energy sustainability. Hallinan is actively involved in the polymer communities of the American Physical Society and the American Institute of Chemical Engineers. He recently received an NSF CAREER Award and has testified before a US congressional subcommittee in support of national synchrotron facilities. Hallinan can be reached by email at dhallinan@fsu.edu.

Irune Villaluenga is an electrolyte chemist at Blue Current, a battery startup company, located in Berkeley, California. She obtained her bachelor’s degree in 2005 and her PhD degree in chemistry in 2010, both from the University of the Basque Country, Spain. She was a postdoctoral researcher at CIC Energigune, Spain, and Lawrence Berkeley National Laboratory. In 2017, she worked as a project scientist at Lawrence Berkeley National Laboratory. Her current research interests include inorganic, polymer, and composite electrolytes for battery applications. Villaluenga can be reached by email at irvillaluenga@gmail.com.

Nitash P. Balsara is a chemical engineer at the University of California, Berkeley. He received his bachelor’s degree from the Indian Institute of Technology in Kanpur, India, his master’s degree from Clarkson University, and his PhD degree from Rensselaer Polytechnic Institute. This was followed by two postdoctoral appointments at the University of Minnesota and the Exxon Research and Engineering Company. In 1992, he joined the faculty of the Department of Chemical Engineering at Polytechnic University in New York. In 2000, he moved to Berkeley to join the faculty of the Department of Chemical Engineering at the University of California and to join Lawrence Berkeley National Laboratory as a faculty scientist. He co-founded two battery startups, Seeo and Blue Current. Balsara can be reached by email at nbalsara@berkeley.edu.