



No CrossRef data available.
LANDSCAPE ARCHAEOLOGY: Remote-sensing investigation of the ancient Maya in the Peten rainforest of northern Guatemala
Published online by Cambridge University Press: 11 July 2003
Extract
Conducting field research in the dense forests of the Peten, northern Guatemala, is as difficult today as it was for A. V. Kidder 70 years ago. However, through the use of airborne and satellite imagery we are improving our ability to investigate ancient Maya settlement, subsistence, and landscape modification in this dense forest region. Today the area is threatened by encroaching settlement and deforestation. However, it was in this region that the Maya civilization began, flourished, and abruptly disappeared for unknown reasons in the ninth century a.d. At the time of its collapse it had attained one of the highest population densities in human history. How the Maya were able to manage water successfully and feed this dense population is not well understood at this time. A project funded by the National Aeronautics and Space Administration (NASA) used remote-sensing technology to investigate large seasonal swamps (bajos) that make up 40% of the landscape. Through the use of remote sensing, ancient Maya features such as sites, roadways, canals, and water reservoirs have been detected and verified through ground reconnaissance. The results of this preliminary research cast new light on the adaptation of the ancient Maya to their environment. Microenvironmental variation within the wetlands was elucidated and the different vegetation associations identified in the satellite imagery. More than 70 new archaeological sites within and at the edges of the bajo were mapped and tested. The combination of satellite imagery and ground verification demonstrated that the Maya had modified their landscape in the form of dams, reservoirs, and possible drainage canals along the Holmul River and its tributaries. The use of Landsat Thematic Mapper (TM) and Enhanced Thematic Mapper (ETM), 1-m IKONOS satellite imagery, as well as high-resolution airborne STAR-3i radar imagery—2.5 m backscatter/10 m Digital Elevation Model (DEM)—are opening new possibilities for understanding how a civilization was able to survive for centuries on a karst topographic landscape. This understanding is critical for the current population that is experiencing rapid population growth and destroying the landscape through non-traditional farming and grazing techniques, resulting in socioeconomic problems.
Information
- Type
- Research Article
- Information
- Copyright
- © 2003 Cambridge University Press
And above all things we wished to get an idea of what the Maya country really looks like, for in spite of the fact that archaeologists have for many years been pushing their way into that region, they have been so buried in the welter of forest, their outlook has been so stifled by mere weight of vegetation, that it has been impossible to gain a comprehensive understanding of the real nature of this territory, once occupied by America's most brilliant native civilization [Kidder 1930:194–195; A. V. Kidder was a member of Colonel Charles A. Lindbergh's exploratory air flights over the Maya area].
RESEARCH OBJECTIVES
Under a three-year, NASA-funded project, the overall goal of our research was to use a combination of remote-sensing, Geographic Information System (GIS), and Global Positioning System (GPS) technology to understand the dynamics of how the Maya interacted with their environment. The unifying feature of our research was to investigate the nature and scale of landscape modification by the ancient Maya and to demonstrate the utility of NASA remote-sensing technology for detecting unrecorded archaeological features.
The specific objectives of this project were to:
- Detect linear features that might be related to roadways or canal systems
- Correlate settlement patterns with vegetational, hydrological, and geological features on the karst topographic landscape
- Isolate topographic features in great detail where sites are likely to be located (bajo islands)
- Map drainage patterns that may provide insight into human settlement, water management, and storage capability
- Create detailed vegetation maps to provide insight into the relationship(s) among land cover, paleohydrology, bajo systems, and subsistence strategies.
RESEARCH TEAM
This project incorporated an interdisciplinary research team. Thomas Sever of NASA was responsible for digital remote-sensing analysis and project coordination. T. Patrick Culbert of the University of Arizona directed field investigation and verification in the wetland (bajo) areas. Vilma Fialko, Instituto de Anthropología e Historia de Guatemala, was responsible for survey and investigation of the Río Holmul basin. Nicholas Dunning of the University of Cincinnati was responsible for soil studies and the collection and interpretation of sediment cores. Daniel Irwin of the University Space Research Association was in charge of digital data-processing, GIS development, and data integration.
THE PETEN
The Peten, in northern Guatemala, covers 36,000 km2 (one-third of Guatemala's land mass) and is threatened by deforestation activities and agricultural practices. The Peten is one of the world's richest areas of biological diversity. The forest and wetland ecosystems contain more than 800 species of trees, 500 species of birds, and large populations of mammals, including monkeys, jaguars, and tapirs. The area also contains some of the most prehistorically significant Maya archaeological sites in Latin America. A few Maya descendants still live in the Peten, although the population of the inhabitants is increasing rapidly in the wake of migration and settlement by the Q'eqchi Maya (Cahuec and Richards 1994). Until 1970, nearly 90% of the Peten was forested. Today, more than half of the forest has been cut, and if deforestation rates continue, only 2% of the Peten's forest will remain by the year 2010 (Canteo 1996).
DEFORESTATION
Satellite imagery (Garrett 1989; Sever 1998) helped in the creation of the Maya Biosphere Reserve (MBR) in the northern Peten. Established in 1990 by President Cerezo and the Guatemalan Congress, the MBR was a major step in the conservation of one of the largest areas of pristine tropical forest in Central America. But the area is under pressure from invading peasant farmers, illegal roads, illicit crops, and lumbering. Deforestation activities are destroying the local flora and fauna as well as the archaeological sites. Looters can use the cleared areas as easy access to plunder the ruins. Trafficking of Maya artifacts in the Peten has become a $10-million-a-month business, resulting in a destructive and sometimes violent business (Hansen 1997). Our research team is also using remotely sensed imagery to monitor deforestation activities throughout the Peten to help Guatemalan agencies preserve and protect the region's cultural resources. These images also help us in our archaeological survey and analysis. For instance, deforestation activities along the Holmul River have changed the course of the river within a few years.
THE BAJO DEBATE
The primary objective of our research was to investigate the ancient Maya's use of the large seasonal wetlands (bajos) in the Peten. The ancient Maya civilization reached a spectacular peak during its Late Classic period (a.d. 600–850) that in turn was followed by a devastating collapse. At this time, population declined by more than 80% in little more than a century (Culbert 1988). The Late Classic population reached the extremely high level of 200 persons/km2 across an area of tens of thousands of square kilometers (Culbert and Rice 1990). To feed this large population, the Maya must have replaced the slash-and-burn agriculture that marked their early centuries of development (Harrison and Turner 1978) with more effective agricultural techniques.
One way to increase agricultural support capacity would be for the Maya to have farmed the extensive seasonal wetlands (bajos) that make up 40% of the land surface (Culbert and Rice 1990). However, the question of whether the bajos were put to agricultural use has been a source of contentious debate. Proponents believe that the Maya used the bajos as part of an intensive agricultural system (Culbert, Levi, McKee, and Kunen 1996; Culbert, Fialko, McKee, Grazioso, and Kunen 1997; Harrison and Turner 1978; Turner and Harrison 1983). Other researchers argue that Maya wetland agriculture was neither extensive nor a significant part of the subsistence base (Fedick and Ford 1990; Pohl et al. 1996; Pope and Dahlin 1989; Pope et al. 2000).
To help resolve this debate, remote-sensing technology was employed to map and locate ancient settlements, landscape modifications, and drainage patterns in the bajos. Both the satellite and airborne imagery provided information to help prioritize areas for survey and excavation and aided immeasurably in planning logistics. In particular, this data made it possible to see linear features, areas of vegetational change, elevations on which sites are located, in addition to the course and conditions of the Holmul River and its tributaries. In short, the use of remote sensing has been a significant tool in improving our archaeological survey methodology.
THE USE OF REMOTE SENSING
Archaeology was one of the first disciplines to use remote sensing in scientific investigations (Sever 1990, 2000). The black-and-white aerial photography from the early decades of the twentieth century has yielded to the airborne and satellite digital data of the past three decades. Remote sensing is a non-destructive, cost-effective technology that, when coupled with computer analysis, allows the investigator to detect features in the far reaches of the electromagnetic spectrum that are invisible to the human eye. Charles Lindbergh; Oliver Ricketson, Jr.; and A. V. Kidder conducted the first use of remote sensing in the Peten. In addition to their visual reconnaissance, they acquired black-and-white aerial photography (Ricketson and Kidder 1930). These aerial flights produced mixed results. Although the researchers could detect features such as site locations, mound patterns, topographic relief, and vegetation differences, they could not locate known causeways and other archaeological features beneath the rainforest canopy.
The dense jungle vegetation of the Peten still hampers archaeological ground survey today. However, the multi-spectral capability of current remote-sensing instrumentation allows our research team to detect unrecorded features, navigate to them using GPS technology, and conduct research at the regional level. The airborne and satellite imagery reveals areas of vegetational change, linear features, elevations on which sites are located, and the course of rivers and drainages. This information allows us to prioritize areas for investigation, ground survey, and excavation. The cost of remote-sensing data and computer technology has fallen dramatically in the past two decades. However, the cost of conducting field research has increased. Consequently, having a priori knowledge of where to survey and excavate contributes significantly to cost-effective research.
DATA ANALYSIS AND REMOTE-SENSING INSTRUMENTATION
Image-processing software used for this study included ERDAS Imagine (1999), RSI-ENVI, and ELAS (Junkin et al. 1981). ERDAS Imagine is the industry standard for processing remotely sensed data and offers a vector module that seamlessly reads, integrates, and processes ArcInfo vector files. ERDAS Imagine also includes a powerful graphical modeling capability to develop customized models and streamline routine tasks. RSI-ENVI is a competitive image-processing product that was used for specific tasks that were problematic in Imagine. For example, RSI offers improved capabilities for post-classification and spectral mapping. Also, ENVI color tables are generally superior to those in ERDAS. Finally, ELAS is a sophisticated image-processing and remote-sensing package that allows the user great flexibility in modifying the operations and parameters at a very fundamental level.
Landsat TM and ETM
For nearly 30 years, a series of Landsat satellites have been collecting repetitive and systematic data of the earth's surface. The Thematic Mapper (TM), initially launched in 1982 aboard Landsat 4, and the Enhanced Thematic Mapper (ETM), launched in 1999 aboard Landsat 7, both provide 30 m multispectral data in visible, near-infrared channels. ETM also offers 15 m panchromatic data that was merged with the multispectral dataset for improved spatial resolution. The Landsat satellite collects data from the same part of the earth approximately every 16 days.
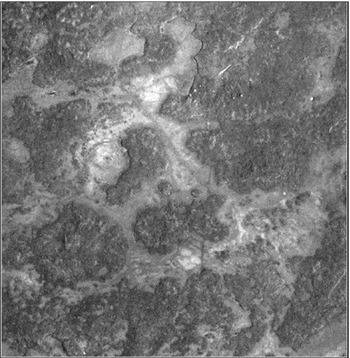
Despite the relatively low spatial resolution of TM and ETM (as compared with IKONOS and STAR-3i), multispectral Landsat data offer several advantages. Because Landsat data are collected repetitively and systematically, it was feasible to acquire archived imagery throughout the different seasons of the year and over the span of several years. For instance, Maya causeways are best detected when there is a moisture difference between the vegetation on the causeway and the surrounding natural vegetation (Figure 1). Radiometrically corrected and differenced Landsat TM or ETM near-infrared bands best detected the stress in the vegetation growing on top of the causeway. This phenomenon appears as a linear feature in the image (Sever 1998). In fact, we observed that even a specific precipitation event can either facilitate or hinder the ability to detect Maya causeways or other anthropogenic features in the Landsat data. Because rainfall in the tropics is frequently a microclimatic event, it was critical to obtain several Landsat scenes over time, each depicting a specific portion of a given causeway or network of causeways. Thus, the linear signature from each Landsat scene was aggregated to develop a more complete mosaic of the causeway network.

Thematic Mapper (TM) satellite image created by ratioing Band 4 with Band 5. The dark lines represent Maya causeways and natural geological features. Ground reconnaissance and sometimes excavation are required to separate the cultural from the natural features.
Several filtering techniques were employed to enhance causeways and other linear and curvilinear features. These techniques had previously been applied to detect Anasazi roads in New Mexico and prehistoric footpaths in Costa Rica (Sever 1990). They include Laplacian edge-enhancement filters, designed to operate without regard to edge direction, and directional filters that selectively enhance image features having specific direction components. Principal Component Analysis (PCA) was applied to the Landsat ETM and TM imagery to reduce the dimensionality of the dataset and produce uncorrelated output bands. Other processing techniques used include Normalized Difference Vegetation Index (NDVI), Normalized Difference Moisture Index (NDMI), and textural analyses.
Landsat TM and ETM data were also effective for identifying specific bajos and bajo islands. Compared with higher-resolution datasets, the footprint of a Landsat TM/ETM scene is relatively sizeable, with approximately 185 km on a side. Thus, it was feasible and advantageous to be able to observe entire watersheds and drainage patterns in a single Landsat TM/ETM scene. Moreover, Landsat TM/ETM data were enhanced to distinguish bajo islands better. Based on the known altitude and azimuth of the sun at the time the Landsat scene was collected, a customized ERDAS Imagine graphical model was employed to augment shadow contrast and length. Because bajo islands are elevated features surrounded by low-lying areas, they typically cast a small, although sometimes indistinguishable, shadow within a Landsat scene. Artificially “controlling” the sun's altitude and azimuth significantly improves discriminating bajo islands from the background areas.
Both a supervised and unsupervised classification (Jensen 1996) was conducted on Landsat TM and ETM data sets. The classification results were compared with ground information provided by local inhabitants, who identified the vegetation types every 25 m along two transects between Yaxha and Nakum. One transect was cut for 10 km in a straight line, while the other transect followed a 17 km jeep road. This information was used to distinguish various bajo vegetation types that are discussed later.
IKONOS
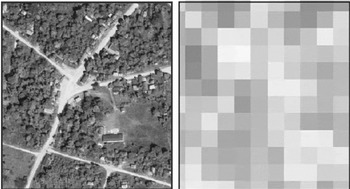
IKONOS imagery promises to be a significant improvement over previous satellite data used for archaeological research. The IKONOS high-resolution satellite was launched in September 1999 and carries both panchromatic and multispectral sensors. IKONOS provides 1m resolution panchromatic imagery and four multispectral bands (visible and near-infrared) at 4 m resolution. The satellite has a polar, circular, sun-synchronous 681 km orbit, and both sensors have an at-nadir swath width of 11 km. Approximately 700 km2 of IKONOS data were collected and analyzed over selected areas of the Peten. Features not apparent in the Landsat TM imagery are easily visible in the IKONOS data, as shown in Figure 2. For each IKONOS scene, the high-resolution panchromatic band was merged with the multispectral bands using a Brovey transformation (ERDAS 1999:161–162). The Brovey transformation was selected to increase contrast in the low and high ends of the image histogram, consequently improving distinction between vegetated and disturbed areas.

Comparison of high-resolution IKONOS imagery (left) and Landsat TM imagery over El Cruce Dos Aguadas in Peten, Guatemala. The high-resolution capability of IKONOS data clearly reveals detailed modern-day features such as huts, footpaths, and roads.
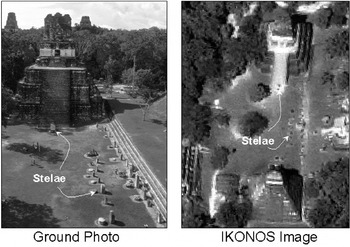
Although IKONOS data have not yet been extensively field-tested for archaeological use, they appear to offer several promising advantages to lower-resolution optical sensors (Figure 3). Principally, because IKONOS data are of such high spatial resolution, it is feasible to discriminate contemporary anthropogenic features visually in the imagery. Whereas with lower-resolution data such as Landsat, a small house and adjacent lot might appear as a single whitish area, with IKONOS, one can easily differentiate the two and even detect small details, such as the location of a latrine. Therefore, IKONOS data are an excellent navigational aid in remote regions, because the user can frequently identify his or her location down to an individual tree, path, or stream crossing. Further, IKONOS data are excellent for corroborating features that are ambiguous in lower-resolution imagery before entering the field.

Comparison of ground photograph with 1 m pan-sharpened IKONOS satellite image. These images demonstrate the capability of high-resolution data to detect small features from space, such as Maya stelae at Tikal National Park, Guatemala.
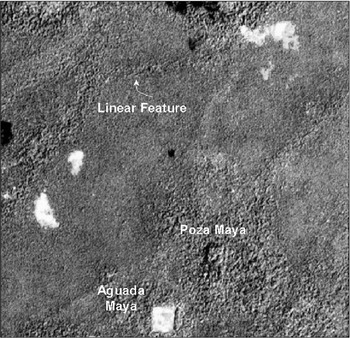
IKONOS data are also particularly useful in detailing small drainages and linear features that are indistinguishable in Landsat data (Figure 4). The considerable and varied texture of IKONOS panchromatic data, together with the four multispectral bands, may also be useful for detailed vegetation classification, although further study is in progress.

IKONOS satellite data reveal detailed features that are indistinguishable in Landsat TM/ETM imagery.
A Landsat scene's dimension is 185 × 185 km2; a typical IKONOS image covers only 11 × 11 km2. On a per-square-kilometer basis, IKONOS data are approximately 1,500 times the cost of Landsat data; thus, it is highly advantageous to use a Landsat image as a guide in selecting an IKONOS scene where high-resolution data are required.
STAR-3i
Radar uses microwave energy rather than visible light energy to produce an image of the earth's surface. Radar, an active system that produces its own energy, can be used day or night and has cloud-penetration capability (Sever 2000). STAR-3i is an airborne Interferometric Synthetic Aperture Radar system operated by Intermap Technologies and was originally developed by NASA's Jet Propulsion Laboratory (JPL) and the Environmental Institute of Michigan (ERIM). More than 2,000 km2 of STAR-3i radar data were collected over eastern Peten. Intermap produces various STAR-3i products. Data collected over Guatemala includes a 2.5 m resolution orthorectified image (ORI) and a 10 m resolution (3 m vertical) Digital Elevation Model (DEM). The ORI is a grayscale image generated from the radar backscatter and can be used for visual interpretation. The STAR-3i DEM represents the terrain's vertical component and can be used for various applications, including topographic mapping, watershed analysis, and viewshed analysis.
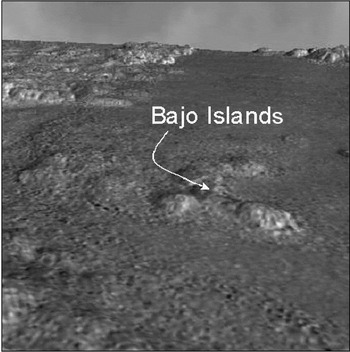
The STAR-3i DEM was particularly useful for identification of bajo islands that were either unidentifiable or ambiguous in Landsat imagery. The STAR-3i DEM also enabled us to develop detailed three-dimensional images that improved our ability to visualize the terrain (Figure 5).

Visualization of STAR-3i DEM revealing bajo island features. The DEM is generated with 10 m postings from interferometric radar data to map detailed topographic information.
Multisensor Integration
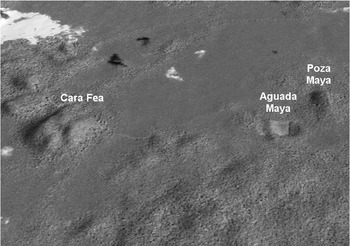
Although each individual sensor (Landsat TM/ETM, IKONOS, and STAR-3i) offers specific advantages for distinguishing linear features, drainages, and vegetation types, we had considerable success integrating the different datasets. For example, combining the high-resolution STAR-3i DEM and the visible and near-infrared IKONOS bands provided a spectacular dataset for a virtual visualization of the landscape using the ERDAS Imaging Virtual GIS software (Figure 6). The Virtual GIS enables the user to fly, drive, or walk through the dataset and modulate parameters such as sun altitude and azimuth. It also allows the researcher to develop detailed viewsheds. This detailed visualization of the Peten landscape was advantageous for analyzing and understanding the topography before entering the field and to prioritize areas of interest because of limited budgets. In addition, exaggerating the vertical component offered image information that was difficult to extract otherwise. For example, small rises that were overlooked in two-dimensional imagery were conspicuous in the virtual environment.

Virtual GIS visualization of features within Bajo la Justa.
Integration of the IKONOS and Landsat ETM/TM datasets for detailed vegetation classification is under investigation. ETM/TM offers infrared band information that is unavailable in the high-resolution IKONOS imagery. A first-level classification is thus beneficial with ETM/TM to separate broad vegetation classes. The texture component of the IKONOS is an additional dataset that might facilitate broad class separation. In addition, we are determining whether a detailed classification can be generated directly from the IKONOS data, then “scaled up” to the broad-coverage Landsat scene.
RESULTS
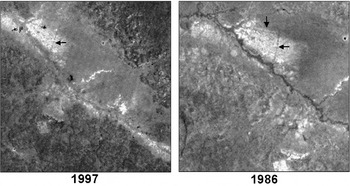
Ancient Maya causeway features were detected in the TM imagery through the use of various filtering techniques. As part of the theoretical framework of landscape archaeology, causeways are tangible evidence of the Mayas' structural organization across geographic space. From a remote-sensing perspective, the causeways demonstrate how cities were connected and provide insights into regional organization (Gorenflo and Bell 1991). Previously known causeways were located in the imagery and used as a training sample for data-extraction techniques. These techniques were applied to locate and map unrecorded linear features, some of which were subsequently verified as causeways through ground survey. A large number of linear features were mapped that appear to be causeways but have not been verified on the ground. This includes, for example, linear features that were detected in the area of La Carona (Graham 1997) and Calakmul (Figure 7). Recently, linear features not visible in the TM data have been detected in IKONOS imagery in the Bajo de Santa Fe, east of Tikal (Figure 8). Whether these features represent ancient causeways or canals is uncertain at this time. A field survey conducted during May 2002 suggested that these features are not of recent origin. Future excavation will be required to determine their function.

Two-date comparison of Landsat TM imagery near Calakmul, Mexico. The intensity of linear features differs in separate satellite collection dates due to variable moisture conditions and micro-climatic events.

IKONOS satellite image revealing linear features in Bajo Santa Fe east of the archaeological site of Tikal. It is unknown whether these features represent ancient causeways or canals or are due to recent landscape modification. These features are a primary focus for future ground activities.
Bajo Communities
Analysis of TM, IKONOS, and STAR-3i imagery demonstrated that almost every rise in elevation that reaches above the level of seasonal inundation contains an archaeological site. More than 70 bajo sites were investigated, and cultural features were found at each site. The difference in scale and size of bajo communities suggests that there is an organizational structure within the bajo landscape. The bajo settlements range from isolated mounds to small groups of structures, larger formal plaza arrangements, the medium-size center of Poza Maya, and major centers such as Yaxha and Nakum that are located on the edges of Bajo la Justa. In addition, the bajo sites document centuries of habitation, ranging from the Late Preclassic through the Terminal Classis periods (Culbert and Fialko 2000; Kunen et al. 2000). Preliminary evidence suggests that the occupation of bajo sites seems to correlate with that of the urban centers.
TM imagery was used to create vegetation maps of the bajo environment. There are pronounced microenvironmental differences within bajos that are known by inhabitants today and were recognized by scholars in the past (Lundell 1933, 1937; Wright et al. 1959). We hypothesize that the ancient Maya adapted to this environmental variability. In our analysis of the TM data, we were able to identify three major vegetational differences: palm bajo (escoba bajo), scrub bajo (tintal bajo), and corozo bajo. Palm bajo is composed of a variety of palms with canopy heights reaching 15 to 20 m. Scrub bajo is marked by a profusion of small trees with canopy heights of 6 to 12 m. Corozo bajos consist of single-species stands, because corozo palms rarely occur in association with other palm species. Local workers report that Corozo bajo is the best land available for farming. Ground verification of the bajo vegetation confirms that there is great variety in vegetation and soil-moisture levels within a single bajo. In addition, lines that cross the bajos in the imagery were identified as seasonal watercourses, some of which may have been modified by the Maya. We anticipate that the 1 m, pan-sharpened IKONOS imagery will allow us greater accuracy in the mapping of bajo vegetation types, subtypes, aguadas, and drainage features. This information has implications not only for archaeology but also for the planning and future use of the wetlands by the current inhabitants.
Images from remote sensing assisted in the investigation of the Holmul River in delineating land forms and vegetational associations as well as dry and ancient watercourses. Eighty-six linear kilometers of the upper and middle sections of the river were surveyed. The information on topography and vegetation from the imagery made it possible to estimate directions, distances, and times required to reach critical areas for ground survey. The exact form and size of bajos, islands, and multiple courses of the Holmul River and its tributaries can be defined only by the use of satellite and airborne images.
This information made it possible to test the following objectives related to the exploration of the upper and middle course of the Holmul River: origin of the river in the hilly regions of Macanche, to the east of Lake Peten Itza; the eastern river branch that crosses the Bajo Ixtinto; the western branch that crosses the Bajo Socotzal; “bajo Islands” (areas that are elevated above the level of seasonal inundation) associated with the Ixtinto and Socotzal bajos; verification of the location of the southwestern corner of the Tikal National Park; the location and mapping of archaeological sites associated with the river; the location of waterholes associated with the Holmul River; excavation of sections of the Holmul River to demonstrate cultural modifications affected by the ancient Maya; investigation of the major and minor tributaries that feed the Holmul River; location of sink holes associated with the Holmul River; exploration of the relationship between the Holmul River and the Bajo de Santa Fe at the margins of the bajo on all sides; exploration of islands within the Bajo de Santa Fe; and identification in the satellite images of the hydrological, geographic, and cultural features discovered in survey.
SUMMARY
Satellite and airborne imagery provided by NASA has been used in the dense tropical forest of northern Peten, Guatemala, to improve archaeological survey methods. Through the combination of remote sensing and ground verification, we have been able to identify causeways, archaeological sites, vegetation types, water-storage areas, detailed topography, and hydrologic drainage patterns. This information provides evidence that the Maya made effective use of the regional wetlands (bajos) for many centuries. The use of bajos as an important subsistence strategy is as important today for the current inhabitants as it was for the ancient Maya. In addition to the detection of archaeological features, the imagery is documenting the magnitude and rate of deforestation by settlers in the region who are practicing destructive, non-traditional forms of agriculture. These activities threaten the biological, botanical, and cultural resources of the area.
The use of remote-sensing technology allows the archaeologist to see information that is often invisible to the naked eye. Multispectral scanners and advanced computer-analysis techniques extend the range of human vision and allow research projects to be conducted at the regional level. Radar data, with its cloud-penetration capability, can provide information at any time of the year, including the rainy season. Features of interest in the data can be mapped and prioritized for survey and excavation. Early pioneers in Maya archaeology recognized the potential of remote sensing, but it is the high-resolution, multi-band capabilities of recent satellite and aerial instruments and the accuracy of GPS technology that will provide innovative and cost-effective applications in the future.
top
Para realizar el trabajo de campo en los bosques densos del Peten, en el norte de Guatemala, es tan dificil hoy endía como lo fue para Kidder (1930) hace setenta años. Sin embargo, por medio del uso de imagines de satellite, se esta mejorando la habilidad para investigar la distribución de asentamientos humanos, subsistencia, y modificación del paisaje de los mayas en esta region de bosque denso. Hoy el area esta amenazado por medio de la fontera agrícola y deforestación. Sin embargo, fue en esta región que la civilización maya empezó, floreció, y desapareció repentinamente por razones no conocidos en el siglo IX a.C. En el tiempo del colapso, los mayas tuvieron uno de las densidades de población más alta en la historia humana. No se entiende bien como los mayas lograron abastercerse con agua y alimentos para a toda esta población. Un proyecto financiado por medio de la NASA, usó la tecnología de sensors remotos para investigar los bajos queabarcan un 40% del area. Por medio de esta tecnología, se ha logrado detectar y verificar hallazgos de sitios, caminos, canales y depósitos de aqua usados antiguamente por los mayas. Los resultado de ésta investigación preliminar demuestran la adaptación de los mayas a su ambiente. Se identificó en las imagines de satellite una variación microambiental dentro de los bajos. Se realizó mapas y se comprobó mas que 70 sitios arqueológicos nuevos dentro y en las orillas de los bajos. La combinación de imagines de satellites y verificación del campo demonstró que los mayas modificaron sus areas por medio de presas, depósitos de aqua, y posiblemente con canales de drenaje a la orilla del Río Holmul y sus tributarios. El uso de Landsat Thematic Mapper y Enhanced Thematic Mapper, 1 m IKONOS, y radar STAR-3i de alta resolución esta está aportando oportunidades nuevas para entender como está civilización logró sobrevivir por varios siglos en un area karstico. Está información es muy importante para la población actual está destruyendo la misma area por medio de la agricultura y el pastoreo no tradicional, lo cual que esta resultando en problemas socioeconómicos.
References
REFERENCES
Cahuec, E., and
J. Richards
1994
La Variación Sociolinguistica del Maya Q'eqchí. Boletin Linguistico
40.
Guatemala.Google Scholar
Canteo, C.
1996
Destrucción de Biosfera Maya avanza ano con ano.
Siglo Veintiuno,
Jueves, Guatemala,
21 November.
Culbert, T.P.
1988
The Collapse of Classic Maya Civilization. In
The Collapse of Ancient States and Civilizations, edited by
N. Yoffee and
G. Cowgill, pp.
69–101.
University of Arizona Press,
Tucson.
Culbert, T.P., and
Vilma Fialko
2000
Reconnaissance of the Course of the Holmul River and Bajo de Santa
Fe in the Region of the Tikal National Park, Guatemala, 2000
Season.
Report to the National Aeronautics and Space Administration,
Global Hydrology and Climate Center,
Marshall Space Flight Center, Huntsville, AL.
Culbert, T.P.,
L.J. Levi,
B.M. McKee, and
J.L. Kunen
1996
Investigaciones Arqueológicas en el Bajo la Justa entre
Yaxha y Nakum.
IX Simposio de Investigaciones Arqueológicas en
Guatemala, pp.
51–57.
Instituto Nacional de Antropología e Historia,
Guatemala.
Culbert, T.P.,
V. Fialko,
B.M. McKee,
L. Grazioso, and
J.L. Kunen.
1997
Investigacíon Arqueológica en el Bajo la Justa: La
Temporada de 1996.
X Simposio de Investigaciones Arqueológicas en
Guatemala.
Instituto Nacional de Antropología e Historia,
Guatemala.
Culbert, T.P., and
D.S. Rice (editors)
1990
Precolombian Population History in the Maya Lowlands.
University of New Mexico Press,
Albuquerque.
ERDAS
1999
Field Guide.
Version 8.5, 5th ed.
ERDAS Inc.,
Atlanta.
Fedick, Scott L., and
Anabel Ford
1990
Prehistoric Agricultural Landscape of the Central Maya Lowlands:
An Examination of Local Variability in a Regional Context.
World Archaeology
22(1):18–33.Google Scholar
Gorenflo, Larry J., and
Thomas L. Bell
1991
Network Analysis and the Study of Past Regional Organization. In
Ancient Road Networks and Settlement Hierarchies in the New World, edited by
Charles Trombold, pp.
80–98.
Cambridge University Press,
Cambridge.
Harrison, P.D.,
B.L. Turner II, and editors
1978
Prehispanic Maya Agriculture.
University of New Mexico Press,
Albuquerque.
Jensen, John R.
1996
Introductory Digital Image Processing—A Remote Sensing
Perspective.
Prentice-Hall,
Saddle River, NJ.
Junkin, B.G.,
R.W. Pearson,
B.R. Seyfarth,
M.T. Kalcic, and
M.H. Graham.
1981
Earth Resources Laboratory Applications Software (ELAS).
Report No. 183.
National Aeronautics and Space Administration, National Space Technology
Laboratory (currently Stennis Space Center), Earth Resources Laboratory,
NSTL, MS.
Kidder, A.V.
1930
Five Days over the Maya Country.
Scientific Monthly
(March):193–205.Google Scholar
Kunen, J. L.,
T. P. Culbert,
V. Fialko,
B. M. McKee, and
L. Grazioso
2000
Bajo Communities: A Case Study from the Central Peten.
Culture and Agriculture
22(3):15–31.Google Scholar
Lundell, Cyrus L.
1937
The Vegetation of the Peten.
Carnegie Institution Publication No. 478.
Carnegie Institution of Washington,
Washington, DC.
Pohl, M.D.,
K.O. Pope,
J.G. Jones,
J.S. Jacob,
R. Piperno,
S.D. DeFrance,
D.L. Lentz,
J.A. Gifford,
M.E. Danforth, and
K. Josserand
1996
Early Agriculture in the Maya Lowlands.
Latin American Antiquity
7:355–372.Google Scholar
Pope, Kevin O., and
Bruce H. Dahlin
1989
Ancient Maya Wetland Agriculture: New Insights from Ecological and
Remote Sensing Research.
Journal of Field Archaeology
16:87–106.Google Scholar
Pope, Kevin O.,
Mary Pohl,
John Jacob,
John Jones, and
Eliska Rejmankova
2000
Ecosystem Dynamics: The Palaeoecological Imperative in Archaeological
Research.
Paper presented at the 65th Annual Meeting of the Society for
American Archaeology,
Philadelphia.
Ricketson, O., Jr., and
A.V. Kidder
1930
An Archaeological Reconnaissance by Air in Central America.
Geographic Review
20(2):177–206.Google Scholar
Sever, Thomas L.
1990
Remote Sensing Applications in Archeological Research: Tracing
Prehistoric Human Impact Upon the Environment.
Ph.D. dissertation, University of Colorado, Boulder.
University Microfilms,
Ann Arbor, MI.
Sever, Thomas L.
1998
Validating Prehistoric and Current Social Phenomena upon the
Landscape of the Peten, Guatemala. In
People and Pixels: Linking Remote Sensing and Social Science, pp.
145–163.
National Academy Press,
Washington, DC.
Sever, Thomas L.
2000
Remote Sensing Methods. In
Science and Technology in Historic Preservation, edited by
Ray Williamson and
Paul Nickens, pp.
21–51.
Kluwer Academic/Plenum Publishers,
New York.
Turner, B.L., II, and
P.D. Harrison (editors)
1983
Pultrouser Swamp:Ancient Maya Habitat, Agriculture, and Settlement
in Northern Belize.
University of Texas Press,
Austin.
Wright, A.C.S.,
D.H. Romney,
R.H. Arbuckle, and
V.E. Vial
1959
Land Use in British Honduras.
Her Majesty's Stationery Office,
London.
Thematic Mapper (TM) satellite image created by ratioing Band 4 with Band 5. The dark lines represent Maya causeways and natural geological features. Ground reconnaissance and sometimes excavation are required to separate the cultural from the natural features.
Comparison of high-resolution IKONOS imagery (left) and Landsat TM imagery over El Cruce Dos Aguadas in Peten, Guatemala. The high-resolution capability of IKONOS data clearly reveals detailed modern-day features such as huts, footpaths, and roads.
Comparison of ground photograph with 1 m pan-sharpened IKONOS satellite image. These images demonstrate the capability of high-resolution data to detect small features from space, such as Maya stelae at Tikal National Park, Guatemala.
IKONOS satellite data reveal detailed features that are indistinguishable in Landsat TM/ETM imagery.
Visualization of STAR-3i DEM revealing bajo island features. The DEM is generated with 10 m postings from interferometric radar data to map detailed topographic information.
Virtual GIS visualization of features within Bajo la Justa.
Two-date comparison of Landsat TM imagery near Calakmul, Mexico. The intensity of linear features differs in separate satellite collection dates due to variable moisture conditions and micro-climatic events.
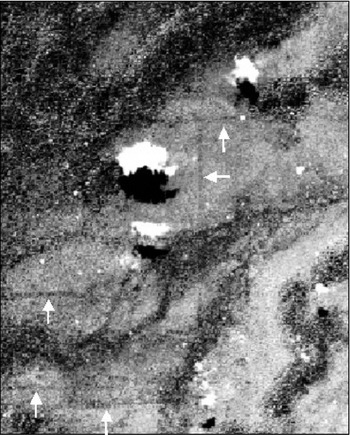
IKONOS satellite image revealing linear features in Bajo Santa Fe east of the archaeological site of Tikal. It is unknown whether these features represent ancient causeways or canals or are due to recent landscape modification. These features are a primary focus for future ground activities.
 You have
Access
- 52
- Cited by