


Following the 1865 Union victory in the Civil War, Southern Black men gained the right to vote and some were elected to office, a development Eric Foner calls a “massive experiment in interracial democracy without precedent in the history of this or any other country that abolished slavery in the nineteenth century” (Reference Foner1988, xxv). During this period of national oversight, new taxes were implemented to provide social welfare in a way unknown to the antebellum South. This leveling of the field was short-lived, however, as white elites were able to return to power by the end of the 1870s and tried to “redeem” the region’s politics by reverting it back, as much as possible, to the antebellum status quo.
In this paper, we examine the relationship between slavery and county-level taxation and bureaucratic capacity during Reconstruction and Redemption in the American South. In 1870, during Reconstruction, the mean level of per capita county taxation was $1.17. By 1880, in the immediate aftermath of Reconstruction’s demise, this figure dropped to $0.87, a 26% decline in per capita taxation. In Montgomery County, Alabama (66% enslaved in 1860), overall county taxes increased to $95,003 in 1870, but they dropped to $48,846 by 1880—a 49% decline.Footnote 1 By contrast, in Alleghany County, North Carolina (5% enslaved in 1860), taxes in 1870 were $1,723, and actually increased to $3,145 by 1880. What explains this variation over time and across counties?
Canonical political economy models argue that an expansion of the franchise is likely to be associated with an increase in taxation because of the preferences of the now poorer median voter (Meltzer and Richard Reference Meltzer and Richard1981; Romer Reference Romer1975). However, empirical studies of many parts of the world have not found a growth in taxation following franchise expansion (Acemoglu et al. Reference Acemoglu, Naidu, Restrepo, Robinson, Atkinson and Bourguignon2015; Perotti Reference Perotti1996). Recent research has argued that incumbent elites, facing the prospect of losing power, can “hollow out” the state’s bureaucratic machinery (Suryanarayan Reference Suryanarayan2016). While scholars studying variation in spending and taxation across democracies have emphasized factors that shape fiscal policy (Alesina and Glaeser Reference Alesina and Glaeser2004; Iversen and Soskice Reference Iversen and Soskice2006; Lee and Roemer Reference Lee and Roemer2006; Scheve and Stasavage Reference Scheve and Stasavage2006a, Reference Scheve and Stasavage2006b), this new research has emphasized how elites can target both levels of taxation and the bureaucratic capacity essential for taxation and redistribution. Elites can strategically target institutions vital to effective taxation in an effort to weaken future redistribution.
A strategy focused on institutional weakening is more likely to be successful in ranked societies (Suryanarayan Reference Suryanarayan2016). In hierarchical systems, “high-status” groups value their rank in the social hierarchy, which they preserve and perpetuate through direct systems of control such as slavery, aristocracy, or caste. An expansion of the franchise in such contexts paves the way for greater social equality for lower-status groups and the elimination of vertical stratification (Marshall Reference Marshall1950). High-rank groups, therefore, fear the state’s ability not only to redistribute but also to integrate society and to expand access to goods and spaces for the benefit of newly enfranchised low-status citizens. In such a scenario, wealthy elites can gain the support of poorer upper-status members both to oppose tax increases and to weaken investments in institutions vital for collecting taxes by suggesting that expansions to state-led redistribution would threaten their social rank. Consequently, in societies with high status inequality, an expansion of the franchise is likely to be associated with a weakening of support for taxation and the bureaucratic capacity essential for tax collection.
We argue that one of these societies is the canonical case of the American South. The end of the Civil War led to the introduction of civil, political, and social rights for Black freedmen, who became eligible to work for wages, own property, vote, sit in horse-drawn streetcars, and access social services. In a particularly dramatic shift from the antebellum period, Black men attained political positions including postmaster, judge, state legislator, congressional representative, and senator (Foner Reference Foner1996). We argue that this transformation was short-lived because it threatened a vertical racial order (Cell Reference Cell1982), and concerns over white racial status shaped the development of taxation in the decades following Reconstruction because of the potential of a well-funded and competent bureaucracy to undertake social integration. Southern elites could weaken taxation and bureaucratic capacity where the legacy of slavery was the strongest because these places were characterized by higher levels of interracial status inequality. Our arguments build on those made by Du Bois (Reference Du Bois1935), Roediger (Reference Roediger1991), and others that despite the potential for interracial coalitions between poor Black and white Southerners, whites were instead largely united “despite divergent economic interests” by “the shibboleth of race” (Du Bois Reference Du Bois1935, 680).
We test our claims using fine-grained measures of social and economic inequality, taxation, and bureaucratic quality based on county-level census data from the 11 Confederate states between 1850 and 1880. We measure county-level taxation and bureaucratic quality in three ways: (1) per capita tax collections—a measure that captures both changes to fiscal policy and the bureaucracy’s ability to extract revenue; (2) census quality—a measure of the underlying capacity of bureaucrats to collect accurate information; and (3) per capita government employees—a measure of the size of the local bureaucratic presence. To create the census quality and government employment measures, we make use of full population datasets from the 1850 and 1880 censuses. We measure racial-status inequality as the 1860 county-level prevalence of slavery and slaveholding.
We find that in counties with higher proportions enslaved and slaveholders in 1860, the end of the Civil War was associated with higher levels of per capita taxation under federal occupation. Our findings corroborate historical claims that an expansion of the franchise to African Americans led to greater redistributive benefits in this era and reflected the predictions of canonical political economy models. After Reconstruction ended, however, these counties saw a decrease in taxation. Importantly, counties where slavery was more prevalent in 1860 were also places with weaker bureaucratic quality, measured as census quality and government employment in 1880. Our main results are robust to alternative explanations for the strength of taxation such as agrarian economic distress, local economic developmental factors such as proximity to railroads and water transportation, the value of farms, and other population characteristics.
Next, we explore the claim that a cross-class coalition among whites emerged in response to the expansion of the franchise to African Americans. We find that intrawhite economic inequality—measured as 1850 occupational inequality—was associated with higher 1880 tax collections and better bureaucratic quality in places with lower levels of slavery in 1860, whereas it was associated with lower tax collections and weaker bureaucratic quality in places with higher levels of slavery in 1860. These findings suggest that the association between economic inequality and taxation, as predicted by conventional tax-and-transfer models, was mediated by status distinctions between white and Black Southerners. We supplement our aggregate county-level findings with a discussion of qualitative evidence about the Democratic Party’s increasing reliance on white supremacist appeals to rally votes in the lead-up to Reconstruction’s demise.
Finally, we investigate a mechanism for bureaucratic weakening by examining both quantitative and qualitative information about census enumerators in 1880. We find that enumerator districts with higher proportions of African Americans in 1880 were associated with poorer census quality among white respondents, suggesting that post-Reconstruction enumerators performed their duties less effectively in places with greater numbers of formerly enslaved Black Southerners.
Our findings contribute to scholarship on race and American political development by linking the uneven development of bureaucratic capacity to the American South’s protracted democratization (Bateman, Katznelson, and Lapinski Reference Bateman, Katznelson and Lapinski2018; Bensel Reference Bensel1990; Brandwein Reference Brandwein2011; Francis Reference Francis2014; Johnson Reference Johnson2007; Reference Johnson2010; Mickey Reference Mickey2015; Valelly Reference Valelly2004) and highlighting how taxation and bureaucracy can be tools of both egalitarian and white supremacist racial orders in American politics (King and Smith Reference King and Smith2005). Our paper also contributes to a developing research agenda that demonstrates that the variation in the extent of slavery in the antebellum South is associated with greater vote share for the Republican party, racial animosity, and interracial inequality in the present day (Acharya, Blackwell, and Sen Reference Acharya, Blackwell and Sen2018; O’Connell Reference O’Connell2012; Reece and O’Connell Reference Reece and O’Connell2016). One implication of our findings is that variations in local bureaucratic capacity could present an alternative channel to explain preferences for small government.
Our findings also contribute to a growing literature on redistributive politics around the Civil War era. Logan (Reference Logan2020), for example, finds that the presence of Black officeholders was associated with increases in county taxation during the Reconstruction era. Our paper complements this account by emphasizing the importance of bureaucratic capacity beyond tax policy per se, as well as by emphasizing how Southern white elites were able to weaken taxation and bureaucratic institutions in the Southern states, even before the enactment of institutional mechanisms such as Jim Crow and suffrage restrictions (Acemoglu and Robinson Reference Acemoglu and Robinson2008; Ager Reference Ager2013; Bertocchi and Dimico Reference Bertocchi and Dimico2012). We thus build on an older literature that argues that traditional social distinctions in which status and power are correlated (Berreman Reference Berreman1960; Reference Berreman1972; Du Bois Reference Du Bois1935) can give rise to group norms that weaken democratization (Ziblatt Reference Ziblatt2008).
Taxation, Bureaucratic Capacity, and Social Status
Research on the consequences of franchise expansion for fiscal policy typically focuses on measures such as the size of the welfare state or rates of taxation (Aidt, Dutta, and Loukoianova Reference Aidt, Dutta and Loukoianova2006; Lindert Reference Lindert1994). Implicit in these studies is the assumption that the state can in fact tax its citizens effectively. Aidt and Jensen (Reference Aidt and Jensen2009), for example, find that European countries where franchise expansion was followed by welfare expansion were places where state building had preceded democratization and tax administration was more efficient. But in cases in which the state lacks the ability to tax effectively, wealthy elites have little to fear from democratization (Soifer Reference Soifer2013).
Strong bureaucratic capacity is essential for taxation. In order for the state to be able to tax effectively, it needs to have the technological and administrative capability to identify potential taxpayers accurately, quantify their tax obligation, and punish noncompliance.Footnote 2 In certain contexts, elites can strategically respond to democratization by weakening or strengthening tax capacity (Hollenbach Reference Hollenbach2015; Mares and Queralt Reference Mares and Queralt2015; Suryanarayan Reference Suryanarayan2016). By shifting the analytical focus from fiscal policy to capacity, newer scholarship in this area shows that elites can target the type of tax instrument, tax collection efforts, the size and quality of the administrative apparatus dedicated to taxation, and the ability of the state to enforce compliance impartially.
We build on these studies and argue that Southern elites, facing the prospect of losing de jure power under Reconstruction, targeted bureaucratic institutions to limit redistribution and to maintain de facto power (Acemoglu and Robinson Reference Acemoglu and Robinson2008). When capacity is weakened, redistribution becomes much harder. For example, Soifer (Reference Soifer2013) notes that the lack of government surveys (such as cadastral maps and land surveys) severely limited the military government’s ability to redistribute land in Peru. Under what conditions, though, might this strategy of bureaucratic weakening have been successful? Theories of endogenous democratization focus on elite fears of taxation of immobile assets to explain elites’ decision to resist or accept franchise expansion (Boix Reference Boix2003). Such theories suggest that, facing the prospect of democratization for exogenous reasons instead, higher levels of land inequality might be associated with greater bureaucratic weakening around the time of franchise expansion because the threat of expropriation is greater, and the benefits of government redistribution are fewer, for landed elites. Given democracy, however, even landed wealthy elites require the willing cooperation of middle- and low-income voters who stand to benefit from redistribution.Footnote 3 The cooperation of lower-income voters is particularly important if elites seek to defund bureaucracies to limit their power or encourage local bureaucrats to provide misinformation to the state, engage in noncompliance, or be derelict in their duties. Elites, then, are more likely to undertake a process of bureaucratic weakening successfully when they can convince a substantial number of low- and middle-income voters that strong bureaucratic institutions are detrimental to their interests.
We focus on one basis for cooperation between wealthy and poorer voters: social status. In societies with ranked distinctions between groups, individuals are born with ascribed social location, with some groups ranked as high-status and others as low-status. In societies with this type of intergroup distinction, an expansion of the franchise portends not only a redistribution of income but also a possible leveling of social hierarchies. In such societies, wealthy upper-status elites are able to persuade poorer members of upper-status groups into coalitions by raising the specter of social equality for lower-status groups to both wealthy and poorer members of the upper-status group (Suryanarayan Reference Suryanarayan2019).
Take, for instance, the case of colonial India where an episode of limited franchise expansion in 1920 was associated with greater tax avoidance and lower tax collections. Suryanarayan (Reference Suryanarayan2016) finds that greater social inequality between castes was associated with greater tax noncompliance and a decline in the size of the district bureaucracy a decade later. She argues that franchise expansion threatened the social dominance of upper castes, who controlled vast aspects of the British bureaucracy and who sought to protect their control of education, drinking-water wells, sanitation, and temples from lower castes. Upper-caste politicians introduced legislation in the newly elected councils with the intent to weaken tax institutions and to limit the budgets for redistribution.
Lieberman (Reference Lieberman2003) argues that in South Africa the disenfranchisement of Black South Africans and the manufacturing of an identity of white national citizenship created a cross-class coalition of whites in favor of taxation during apartheid. Lieberman shows that this shared status identity increased wealthy whites’ empathy toward poor whites and increased voluntary tax compliance, resulting in better fiscal capacity over time (Levi Reference Levi1989). He contrasts South Africa’s experience with the case of Brazil, another multiracial context, where citizenship did not exclude people by race and where tax capacity was much weaker.
These two cases illustrate how elites anticipating democratization have focused their attention on bureaucratic institutions. The Indian case demonstrates how a group of middle-income—but high-status—voters was willing to undertake bureaucratic weakening. Conversely, the South African case illustrates how restricting the electorate to high-status groups increased wealthy whites’ investment in capacity and contributed to the tendency of poor whites to focus on their class interests. Both cases show how cross-class support is necessary for taxation, bureaucratic quality, and compliance with state attempts to collect information about the population. Upper castes in India and whites in South Africa sought to protect the material benefits of race- or caste-based access to services that are characteristic of ranked status systems in addition to the psychical benefits of high group status. Consequently, status distinctions opened possibilities for coalitions not only to set tax levels but also to shape the capacity of the state to tax in the future.
We do not argue that the American case is identical to the Indian or South African cases, but rather that there are informative theoretical lessons to be drawn about the relationship between status hierarchies and bureaucratic weakening despite case-specific differences. In India, for example, franchise expansion was not reversed, while in the case of the U.S. South, it was. For upper castes in India, then, bureaucratic weakening was a strategic response to a permanent process of democratization. In the U.S. South, by contrast, this strategy emerged in response to an initial democratization that, by the post-Reconstruction period, had been seriously curtailed, and would be almost fully reversed by the end of the nineteenth century. Importantly, however, there was some uncertainty about the future direction of Southern politics in 1880. Although we focus here on more immediate outcomes, we return to this point in the conclusion.
Historical Context: The Postwar American South
The antebellum American South was defined by labor-intensive agriculture and slavery, a particularly extreme form of hierarchy. This structure was drastically transformed by the Civil War (1861–1865). Nearly four million enslaved Black Southerners were freed by the war’s end. The war effort led to “the birth of the modern American state,” with the national budget increasing from $63 million in 1860 to over $1 billion in 1865 and the federal bureaucracy expanding dramatically (Foner Reference Foner1988, 23). With federal oversight providing the opportunity for voting and political participation by Black freedmen, more than six hundred Black men served as legislators during this period (355). Within a few years, the era’s egalitarian alliance passed constitutional amendments and created a range of new institutions to promote racial equality in the region (King and Smith Reference King and Smith2005, 77).
Taxation and Bureaucratic Capacity
The Reconstruction era saw the introduction of extensive progressive taxation to the South for the first time in its history.Footnote 4 Reconstruction-era taxation funded a wide variety of projects, including public schools, hospitals, prisons, and asylums for orphans (Foner Reference Foner1988, 364; Franklin Reference Franklin1961, 143), as well as restoration work on infrastructure damaged during the war (Beale Reference Beale1940, 823).Footnote 5 As federal oversight diminished, though, white elites worked systematically to roll back Reconstruction-era taxation, including removing pro-taxation Black politicians from state and local offices, amending state constitutions to limit the amount of taxation that could be collected for funding public schools, and severely cutting spending on governance and social services (Logan Reference Logan2020; Woodward Reference Woodward1971, 59). As Perman writes, “Of all the issues in southern politics during the later 1870s, none matched in importance the relentless pressure for retrenchment and the reduction of the costs of government,” including “a significant decrease in taxation” (Reference Perman1984, 228–230).
The Reconstruction era also saw the building up of administrative capacity in the region. Bensel, for example, describes the attempt to develop federal administrative presence in particular. He finds that the presence of federal officers was associated with stronger Republican vote share in this period (Reference Bensel1990, 392). Ultimately, though, he argues that Reconstruction’s persistence would have required a much more substantial investment in administration than national Republicans were willing to commit to (413). The withdrawal of administrative capacity likely had longer-term consequences. Johnson describes the existence of what came to be called “Alabama syndrome” in later decades: “for every New York, which adopted a policy early (and implemented it successfully) there was an Alabama, which adopted a policy late or not at all, and with limited administrative capacity” (Reference Johnson2007, 159). These accounts suggest that Southern elites targeted not simply tax levels or social policy but also state and local bureaucratic capacity, in particular key administrative institutions vital to collecting information and knowledge about local residents.
Status and Economic Inequality
We argue this targeting of taxation levels and bureaucratic capacity was made possible in part because of the particular nature of status and economic inequalities in the region. On the eve of the Civil War, about two-thirds of the Southern population was white, with a third of the region held in slavery and a small “free Black” population comprising about 1% of the population. The distinction between freedom and slavery marked the starkest type of inequality. There were also, however, important inequalities within the white population. Roughly 25% of Southern whites were slaveholders, with a much smaller number—between 1% and 4%, depending on the definition—constituting the planter class that controlled the largest portion of the region’s wealth and power (Bolton Reference Bolton1993). In the aftermath of the war, such white elites looked to Black freedmen not as economic competition but as a potential workforce to be repressed and utilized, ideally in a manner closely resembling slavery (Acharya, Blackwell, and Sen Reference Acharya, Blackwell and Sen2018, 85; Key Reference Key1949; Litwack Reference Litwack1979, 337). Below the planters was a white middle class, including the “yeomen,” owners of smaller amounts of land, some of whom were slaveholders, though to a lesser extent than the planters (Ford Reference Ford1986, 17). Below the yeomen were poor whites. In the states where slavery was most prevalent, at least a third of the region’s white population owned no land (and were not slaveholders) and possessed less than $100 in wealth (Merritt Reference Merritt2017).
Central to Republican plans for Reconstruction was a “new conception of the role of government with its significantly enlarged sphere of activity” (Franklin Reference Franklin1970, 383). Actualizing such a conception would have required a centralized bureaucracy that white elites feared would operate contrary to their economic interests. The success or failure of Reconstruction hinged in large part on whether poorer whites would vote with Black freedmen or whether whites of all class backgrounds would vote as a racial bloc. If only 20% of Southern whites had joined Black Southerners, “the new Republican alliance might have been able to exert its will upon southern society for a number of years” (Robinson Reference Robinson1981, 278).Footnote 6
Du Bois describes how, despite the theoretical potential for poorer whites to join Black Southerners in a class-based coalition, they ultimately joined with white elites instead. “For a time, the ancient breach between planters and poor whites gave control to carpetbaggers and scalawags supported by Negroes,” Du Bois writes. “But war and poverty had depleted the old planter families; and some poor whites, eager for land and profits, and jealous of Negroes, came to join the planters” (Reference Du Bois1935, 487). In Alabama, for instance, “the planters and poor whites after their first enmity early made alliance,” Du Bois writes, “and their concentrated social weight descended on whites who dared to vote with the blacks” (494). Similarly, in Georgia, “the planters and the poor whites combined to put the Negroes out of the legislature” (510).Footnote 7
Why did poorer whites ultimately reject an alliance with Black Southerners and instead join with white elites? For whites lower on the economic ladder, Black freedmen represented both economic competition and a social status threat. Black freedmen’s new right to demand wages for their labor presented a material challenge to whites. And the access to education and other social services that emancipation produced posed a status threat beyond mere material interest. To achieve their desired economic goals, white elites thus had to take these concerns into consideration, at least to some extent. Although violence, social ostracism, and suffrage restrictions are certainly important parts of the story, here we emphasize the extent to which many poorer whites simply began to enjoy the privileges of whiteness, which were extended down the class hierarchy beginning in the Reconstruction era (Merritt Reference Merritt2017).Footnote 8 Their whiteness allowed them “public deference and tides of courtesy” not granted to Black Southerners of similar economic backgrounds (Du Bois Reference Du Bois1935). There could also be clear material benefits to whiteness beyond this psychological wage, including preferential hiring and access to better educational facilities.
Access to social services was frequently connected with concerns about racial-status hierarchies. Reconstruction gave rise to more extensive public education in the Southern states, which was almost entirely segregated.Footnote 9 Anecdotal evidence suggests these preferences for segregation were common among poorer whites from an early period. Ash describes one “cogent example of the power of racism as a hindrance to the advancement of poor whites” occurring before the war was even over. In 1864, a Northern missionary established an integrated school in Jacksonville, Florida. However, when Black students began to reach numerical parity with white students in the school, white parents began prohibiting their children from attending. Within six weeks, only one white child remained enrolled (Reference Ash1991, 59). Perhaps reflecting a more general “sensitivity manifested by yeomen scalawags about strident pressures for social equality,” one white South Carolina Republican declared in 1868, in response to legislative demands for greater civil and social equality for freedmen, “I have always maintained that whenever the question becomes a matter of color I would be obliged to take sides with my own color” (Robinson Reference Robinson1981, 291).Footnote 10
Expectations
The discussion above leads us to our theoretical expectations. We begin with the premise that racial-status inequality shaped taxation and bureaucratic capacity during the Reconstruction and Redemption eras in the American South. First, during the period of federal oversight brought by Reconstruction (1865–1877), we predict that there was a positive relationship between racial-status inequality and tax collections as predicted by canonical models. This is because places with greater status inequality were places with greater demand for social equality and public services among the newly emancipated Black citizens. However, starting in the Redemption period (beginning in 1877 and lasting until the establishment of formalized Jim Crow in the 1890s), we predict that there was a negative relationship between racial-status inequality and taxation as well as bureaucratic quality as Southern white elites began to return to power. This is because places with higher levels of racial-status inequality were places where status threat following franchise expansion was greater and where white elites were able to build a cross-class coalition against taxation more easily.
Second, in places with greater racial-status inequality, the expected relationship between economic inequality and stronger taxation that political economy models predicted was attenuated in the Redemption era because many poor whites valued their social rank over their economic interests. We therefore predict that in the post-Reconstruction era, where racial-status inequality was high, greater intrawhite inequality was associated with lower taxation and weaker bureaucratic capacity. Conversely, greater intrawhite inequality was associated with higher taxation and stronger bureaucratic capacity when racial-status inequality was low.
Data and Measurement
Measuring Racial-Status Inequality
The starkest status divide in this period was between those who had been enslaved and those who had not. We use Proportion enslaved from 1860, the last census in which the institution of slavery legally existed, measured as a ratio of total number enslaved to total population in a county, as the first measure of racial-status inequality.Footnote 11 Next, we also examine Proportion slaveholders in 1860, which is the sum of all slaveholding whites as a proportion of total whites. We argue that a larger number of slaveholders regardless of the size of the enslaved population reflected greater intrawhite support for preserving white status in the counties.Footnote 12
Measuring Bureaucratic Capacity
We develop three measures of bureaucratic capacity that, while related, capture different conceptual ideas. The first is a direct measure of taxation in the era, while the second and third are measures of bureaucratic capacity to administer taxation.
County-Level Taxation
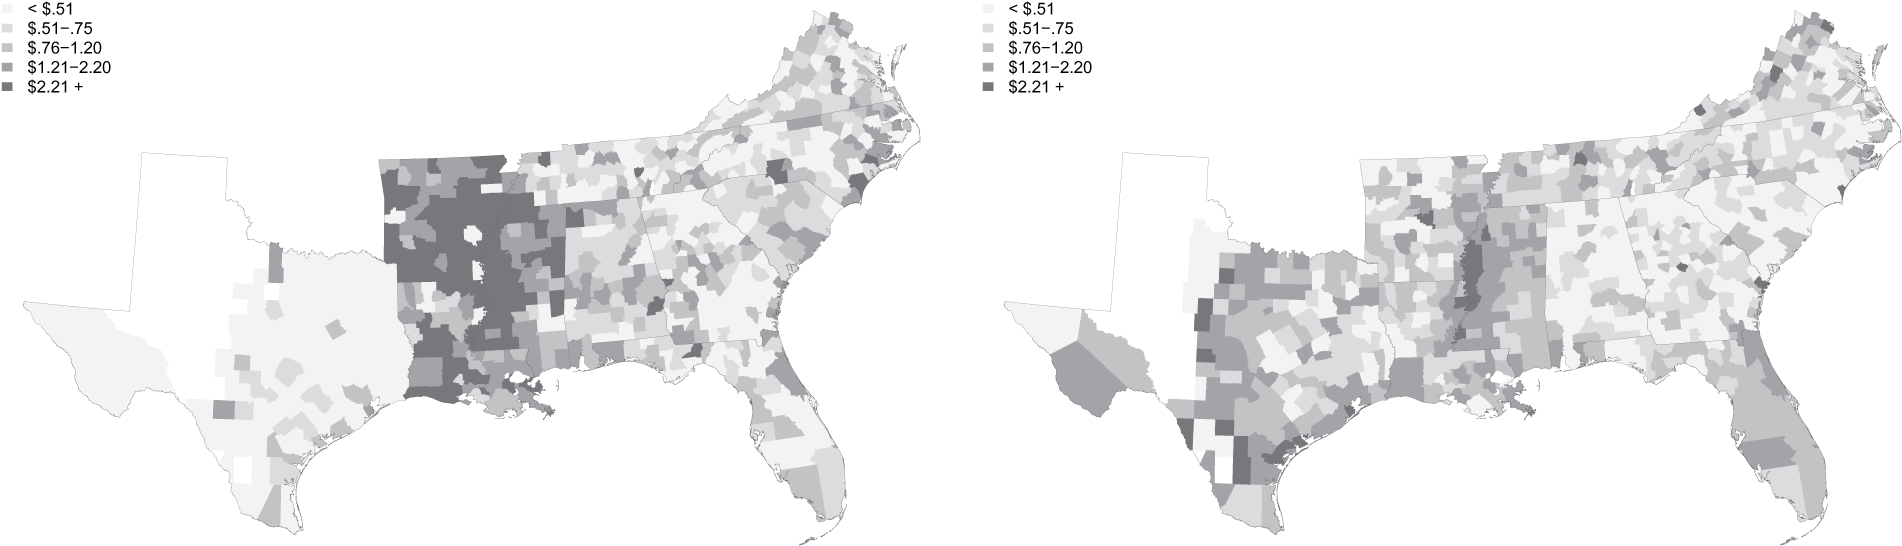
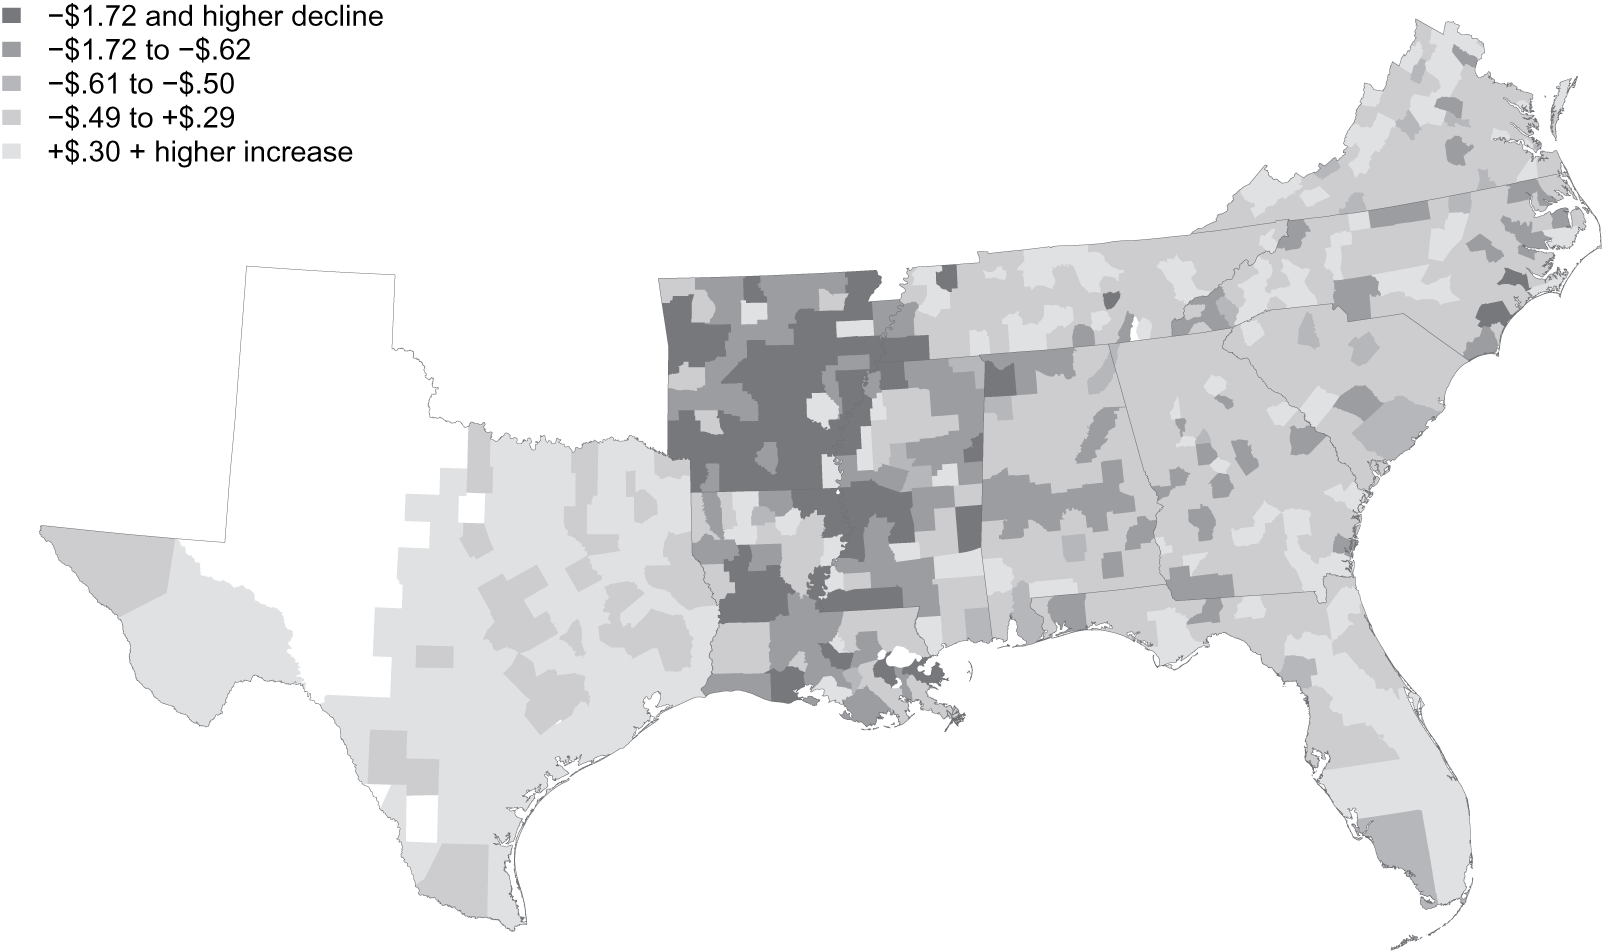
We examine actual tax collections in the eras of Reconstruction and Redemption. We calculate this as Log county tax per capita, which is the logged values of county taxes collected per person in 1870 and 1880.Footnote 13 Historical sources indicate that a large portion of county taxes in this period took the form of property taxes (Fleming Reference Fleming1905, 573; Hyman Reference Hyman1989, 52; Williams Reference Williams1946, 479).Footnote 14 Figure 1 maps per capita county tax levels in 1870 and 1880 in the Southern states, whereas Figure 2 maps the difference in per capita taxes between 1870 and 1880. Note the strongest declines are concentrated in Louisiana, Mississippi, and Arkansas, with additional pockets in other Deep South counties. In states such as Virginia and Texas, by contrast, taxes were actually higher after Reconstruction.
Per Capita Taxes in 1870 (L) and 1880 (R)
Note: The maps show county-level per capita taxes collected in the South as reported in the 1870 and 1880 censuses.

Change in Per Capita Taxes between 1870 and 1880
Note: The map shows the change in per capita taxes at the county level between the 1870 and 1880 census years.

We expect county taxes in 1870 to be positively correlated with the 1860 measures of proportion enslaved and slaveholders because federal oversight during Reconstruction created the conditions for improvements in tax collection. In 1880, we expect the opposite relationship: county taxes collected will be inversely correlated with 1860 measures of proportion enslaved and slaveholders in a county because Southern whites successfully fought to limit challenges to the old social order and to restrict redistribution to African Americans. Figure 3 plots Proportion enslaved against Log county tax per capita in 1870 and 1880, as well as the difference in log per capita taxes collected across those two census years. The patterns in the graph are consistent with the claims that tax capacity was positively correlated with status distinctions during Reconstruction and then declined in the period after (and that the rate at which taxes decreased was correlated with our measure of racial-status inequality).
Log Per Capita Taxes and Proportion Enslaved
Note: The graphs plot proportion enslaved in 1860 against log per capita taxes in 1870 and 1880, as well as the difference in log per capita taxes collected across those two census years at the county level in the South.

County-Level Age Heaping in the Census
Next, we focus on the ability of census operations in the county to survey the population accurately. The quality of a country’s census is critical to its government’s tax collection and tax enforcement efforts. As Lee and Zhang demonstrate, accurate census returns reflect the state’s more general “presence on the ground” (Reference Lee and Zhang2016, 119). We use age heaping among white respondents as a measurement of census bureaucratic quality. Importantly, in the contemporary world, age heaping census errors are correlated with a range of other indices of state capacity used by scholars of political economy (Lee and Zhang Reference Lee and Zhang2016, 125–26).
Unlike taxation, which was a state and local affair, census enumeration involved both federal policy-making and local-level discretion. Many residents apparently believed that census enumerators were gathering information in order to levy taxes, which not surprisingly meant they were often greeted with skepticism. Johnson J. Hooper, a nineteenth century humorist who worked as a census enumerator in Alabama, told a perhaps apocryphal story about a woman’s response to his questions about the age, sex, and race of her household. After initially refusing to answer, she supposedly decided to offer simply that the five members of the household were “all between five and a hundred years old; they are all a plaguy sight whiter than you, and whether they are he or she, is none of your consarns” (Merritt Reference Merritt2017, 342).Footnote 15
We create a measure called Age heaping that calculates anomalies in the way subjects report their age to census officials. In particular, individuals might be disproportionately likely to report ages that end in 0 and 5 (Driscoll and Naidu Reference Driscoll and Naidu2012; Lee and Zhang Reference Lee and Zhang2016). Age heaping is likely to be more prevalent when census bureaucrats are unable to collect good quality data about their respondents (Driscoll and Naidu Reference Driscoll and Naidu2012). In order to create this measure, we use full population data from the 1880 census and calculate the Whipple’s index score for each county using the following formula:
 $$ Whippl{e}^{\prime }s\quad Index=\frac{\sum \left({P}_{25}+{P}_{30}+{P}_{35}+\dots +{P}_{60}\right)}{\frac{1}{5}\left(\sum {P}_{23}+{P}_{24}+{P}_{25}+.\dots +{P}_{62}\right)}. $$
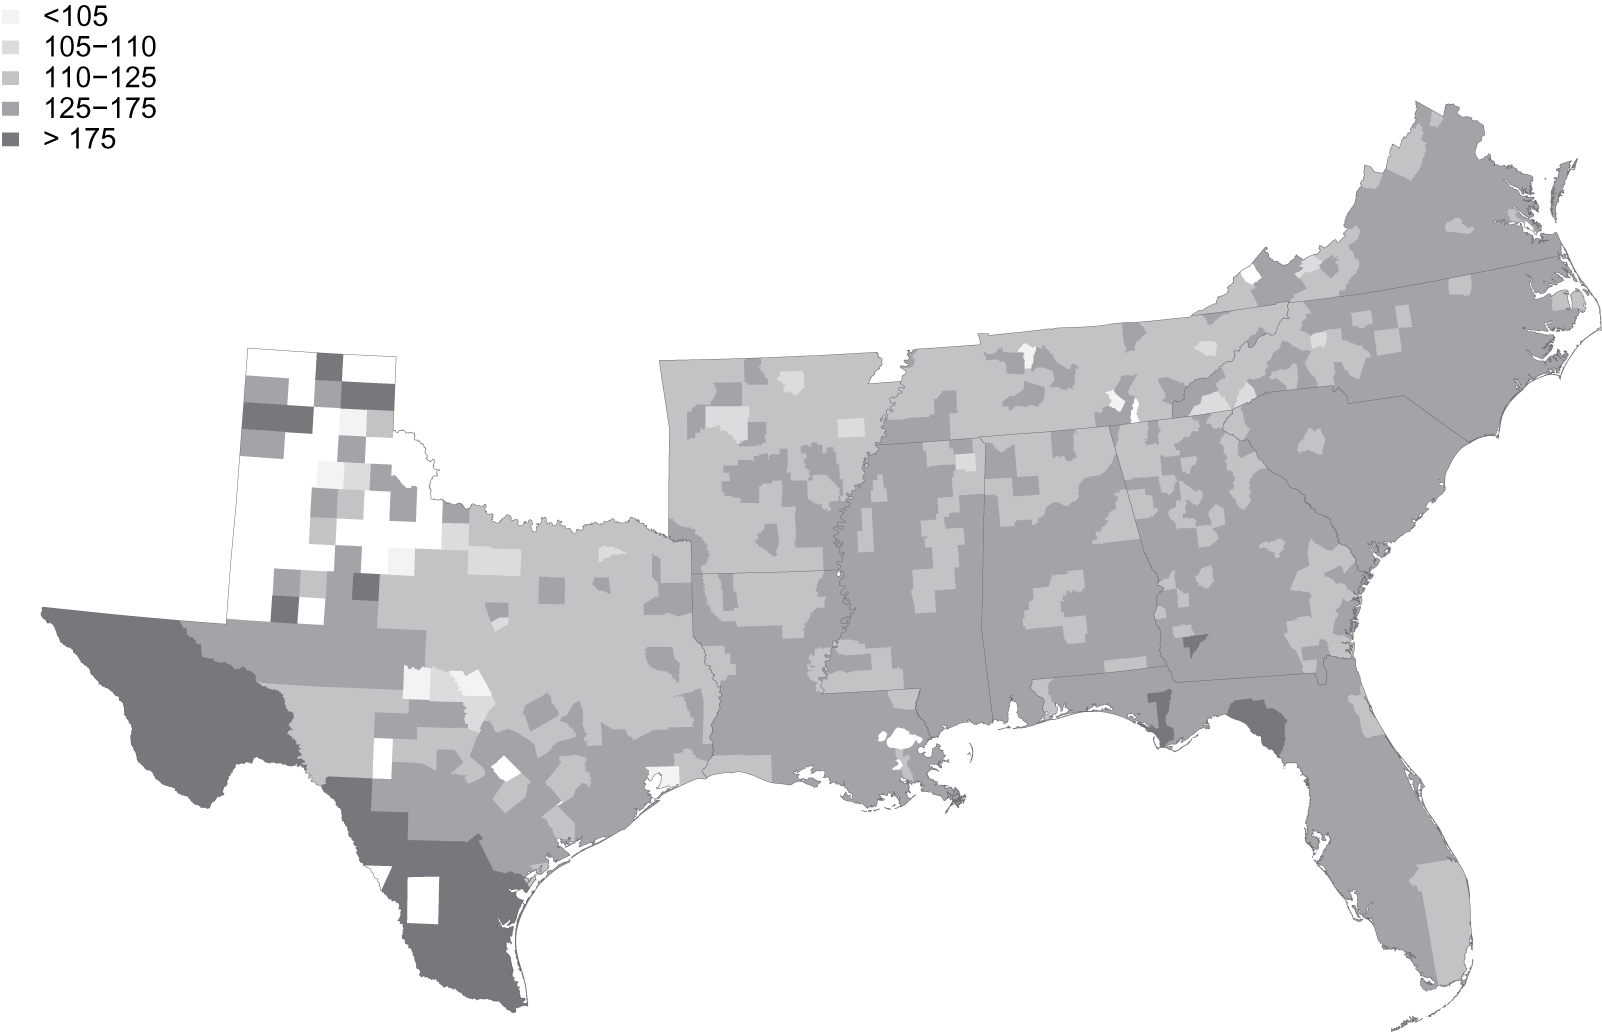
A score of 100 means that there is no heaping at numbers ending in 5 or 0, while numbers above 100 indicate evidence of heaping. Figure 4 maps the distribution of age heaping among whites across Southern counties in the 1880 census.
Age Heaping Among Whites in 1880
Note: The map shows the Whipple’s index score for age heaping among whites created using the full population data from the 1880 census for counties in the South. A score of 100 means that there is no heaping at the numbers ending in 5 or 0, while numbers above 100 indicate evidence of age heaping among whites.

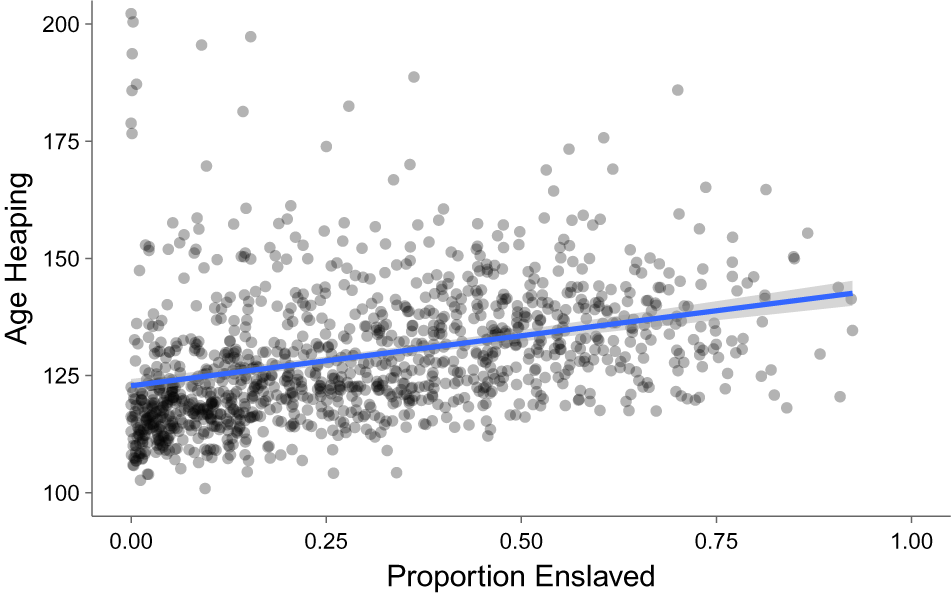
We expect higher Age heaping among white respondents during the Redemption era in places where slavery had been most extensive.Footnote 16 It is possible that census respondents who mistrust the state may engage in deception, but it is our argument that a professional bureaucracy should be able to overcome at least some of that deception. Figure 5 shows a positive association between slavery and age heaping in 1880, suggesting that in areas where slavery was strongest, errors in census-taking of Southern whites were more common in the Redemption era.
Age Heaping Among Whites and Proportion Enslaved
Note: The graph plots proportion enslaved in 1860 against the Whipple’s index score for age heaping among whites in 1880 for counties in the South.

Concentration of Government Employees in Counties
Research on bureaucratic capacity has emphasized the importance of measuring the ability of the state to penetrate society and implement policies (Mann Reference Mann1986). Scholars have operationalized administrative capacity as “bureaucratic presence”—that is, the extent to which local government personnel are able to gather information, detect noncompliance, and enforce decisions (Garfias Reference Garfias2018; Soifer Reference Soifer2008; Suryanarayan Reference Suryanarayan2016). We measure the size of the local government bureaucracy by utilizing the 1880 census to calculate the per capita number of individuals employed in government in each county.Footnote 17 Figure 6 maps the per capita number of government employees in each county in 1880.Footnote 18
Per Capita Government Employees in 1880
Note: The map shows the per capita number of government employees calculated using data on occupations from the full census in each county in the South in 1880.

Controls
We control for a range of alternative explanations. All models contain the following seven controls: First, we include Proportion free Black in 1860, “[p]erhaps the single best indication of [slavery’s] retreat” (Bensel Reference Bensel1990, 29). It is possible that places with greater proportions of free African Americans prior to the war were places where white residents were historically more comfortable with greater rights for African Americans. On the other hand, free African Americans could also have been seen as a threat to the racial status of poorer whites even if their existence also represented a weakening of slavery’s institutional power (Bateman Reference Bateman2018, 96; Roediger Reference Roediger1991). Logan (Reference Logan2020) uses the free Black population as an instrument for Black politicians and argues that Black men who were free before the war were more likely to become politicians for reasons unrelated to local redistributive demands. We include the variable as a control in our models to account for these possibilities. Second, one major alternative explanation is that resistance to taxation is a consequence of the presence of powerful landholders. If this is the case, then higher land inequality should be associated with greater resistance to taxation in the Redemption era. We control for Gini land in this period using the Gini coefficient for land holdings.Footnote 19 Changes in tax rates on property values were a likely driver of resistance to taxation in different periods, so we control for those changes using the Farm value variable from the 1860 census.Footnote 20 It is possible that at least some of the variation in bureaucratic capacity is a consequence of economic endowments, and we control for this possibility by using geographic dummies measuring accessibility to rivers and railways because greater accessibility might make it easier for the state to build capacity. We also control for size of population and size of geographic area in a county using Log population and Area sq miles because larger populations and bigger areas are more difficult to govern.Footnote 21 All models include state fixed effects.Footnote 22
County Boundaries
These county-level variables are measured using data from every U.S. census between 1850 and 1880.Footnote 23 Because county boundaries change over time (Slez, O’Connell, and Curtis Reference Slez, O’Connell and Curtis2017), we use areal weighting techniques to interpolate county-level data from earlier censuses to 1880 boundaries (Acharya, Blackwell, and Sen Reference Acharya, Blackwell and Sen2016), which we describe in the appendix.
Findings
County Taxation
Table 1 presents OLS regression models to examine the relationship between Log county tax per capita and our measures of racial-status inequality. All explanatory variables are standardized unless they are dummy variables, allowing us to compare coefficients across variables.
OLS Regressions of County Taxes on Racial Status

Note: Continuous variables standardized. *p < 0.10, **p < 0.05, ***p < 0.01.
The first model in Table 1 examines taxation in the Reconstruction era. The variable Proportion enslaved is positive and statistically significant at the 1% level. Substantively, a one standard deviation increase in the 1860 proportion enslaved in a county was associated with a 12% increase in per capita county taxation in 1870. The coefficient on this variable is substantively larger than all other variables except for River access and Rail access. The alternative explanation that land inequality rather than enslavement is driving the results does not hold as Gini land is not significant at conventional thresholds. The alternative measure of racial-status inequality, Free Black, also is not significant at conventional thresholds. Our results reiterate those by Logan (Reference Logan2020), who finds that greater Black representation during Reconstruction was associated with higher taxation. These findings suggest that at least for the first decade after the Civil War, redistributive politics in the American South developed as predicted by political economy models that expect taxation to increase when poorer people gain the right to vote.
In the second model in Table 1, we regress taxation on the two explanatory variables in the Redemption era. We observe a weak positive relationship between 1880 county taxation and 1860 enslavement levels, but the coefficient is not significant at conventional thresholds. The variable Gini land is also not statistically significant in this model. As in the first model, counties with greater farm value and accessibility were associated with an increase in county taxes even in the Redemption era.
In the third model, we regress the difference in the log values of per capita taxation between the two census years on the same predictors. The results show that a one standard deviation increase in 1860 slaveholdings was associated with a decline of 10% in the rate at which per capita taxes changed between the two census years. When we substitute the main explanatory variable with Proportion slaveholders in models 4–6, the results are similar. In model 6, a one standard deviation increase in 1860 slaveholders in a county was associated with an 9% decline in the per capita tax growth rates across the two periods. Taken together, these models provide evidence for our claims that racial-status inequality was associated with higher taxation in the Reconstruction era and a decrease in taxation in the decade following.
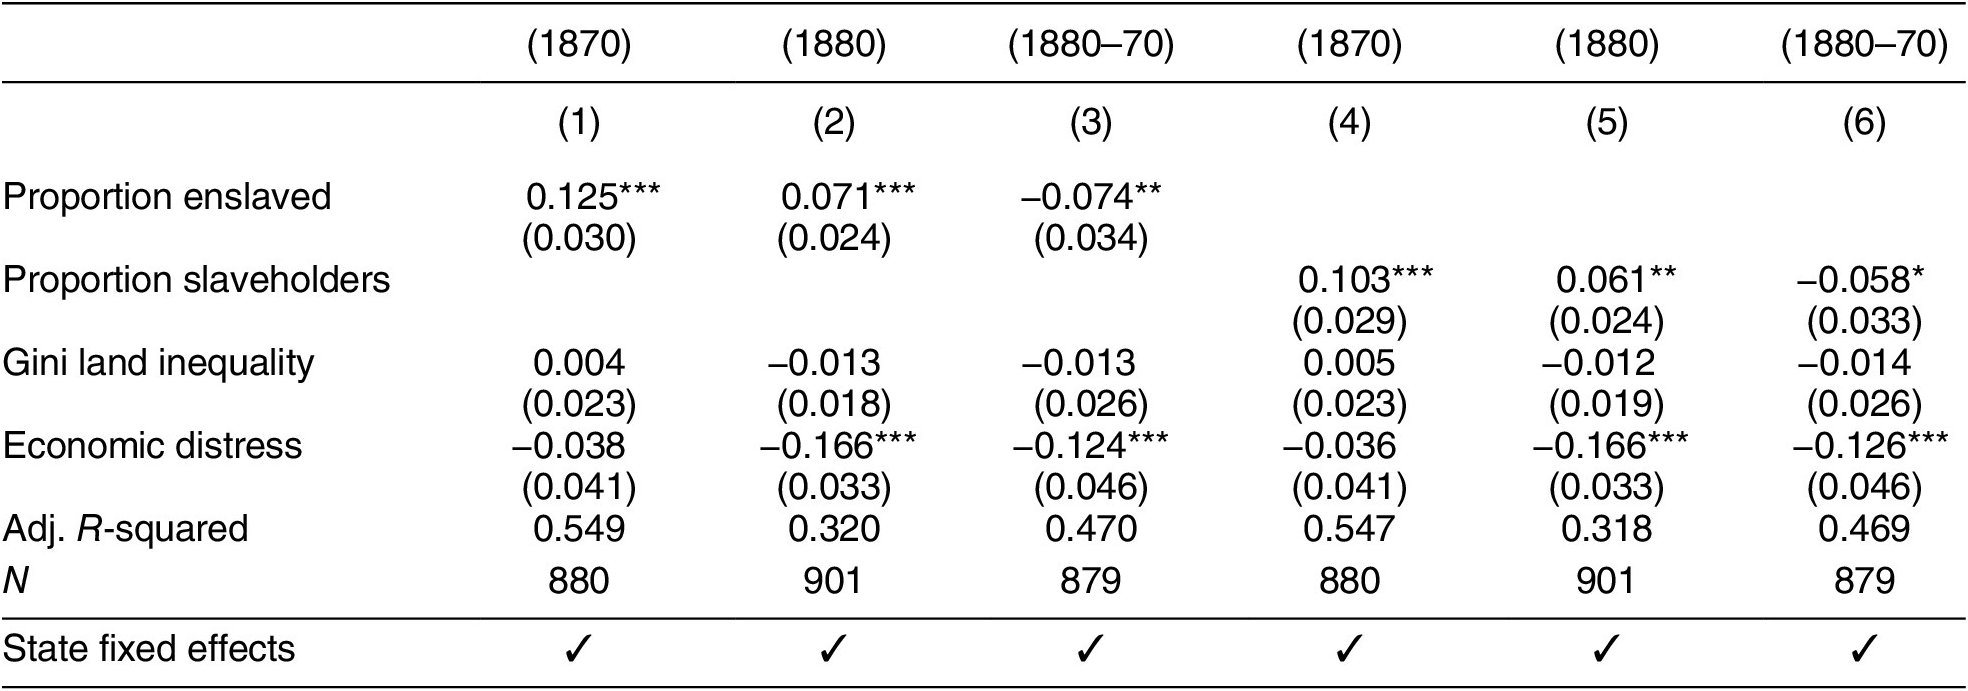
Economic Distress
It is possible that the correlation between racial status and Reconstruction-era taxation could be due to agrarian economic distress caused by the Civil War. If counties with higher levels of slavery were also counties with higher levels of war-related economic devastation, then the latter could be the cause of investment in postwar development rather than the former. In Table 2, we control for a variable, Economic distress, which measures the change in farm value between 1860 and 1870, to account for the economic costs of the war on the agrarian economy. The variable is not significant in the Reconstruction era and has a strong negative correlation with taxation in 1880. Importantly, the racial-status variables continue to be positive and significant in the Reconstruction era, and the change in taxes collected between the two decades is negative and significant.
County Taxes and Racial Status (Economic Distress)
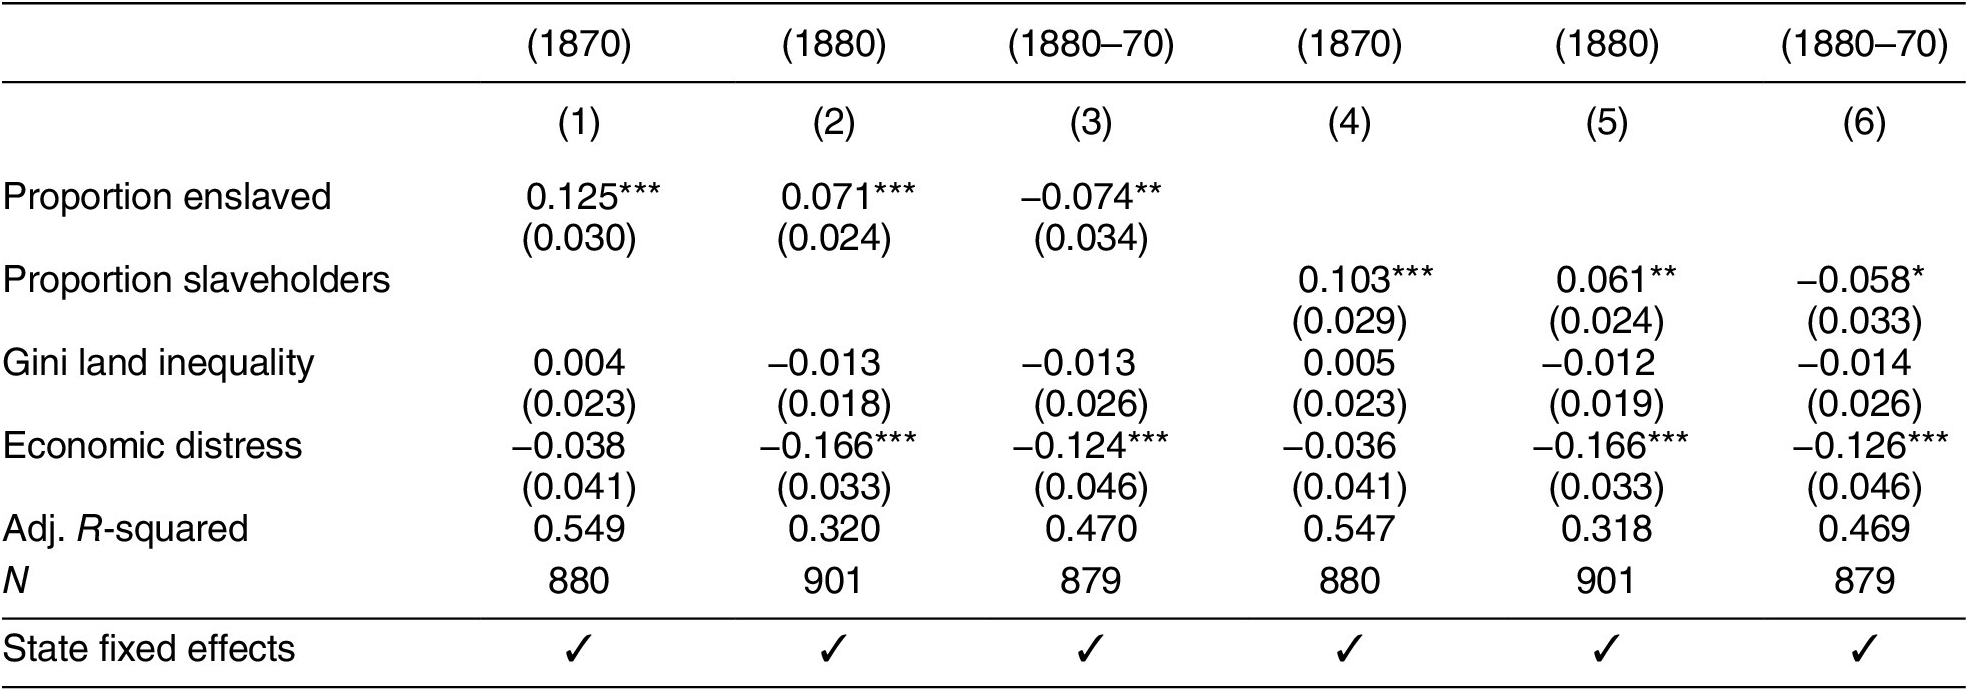
Note: Controls: area, population, free Black, farm value, river access, and rail access. Continuous variables standardized. *p < 0.10, **p < 0.05, ***p < 0.01.
Northern Counties and Frontier Areas
It is possible that the patterns we observe are being driven by a national-level discourse regarding taxation in this period and not by the South’s specific experience with slavery. If this were the case, the patterns we observe in the South should also be evident in the North. In Table S5 in the appendix, we replicate our models in Northern counties. We find no relationship between the proportions of African Americans in a county in 1860 with per capita taxation in 1870, 1880, or the change between the two periods. This suggests that what we find is particular to the experience of emancipation and democratization in the ex-Confederate states. It is also possible that patterns we observe are being driven by counties in sparsely populated and recently settled frontier areas with weak tax capacity. In Tables S6–S8 in the appendix we estimate our taxation models dropping Arkansas (which achieved statehood in 1836), dropping Texas (which achieved statehood in 1845 and extends geographically into the American West), and dropping both. Our results are robust to these changes.
Bureaucratic Quality
We use two measures—Age heaping and Government employment—across the decades to corroborate the patterns we observed with taxation to give credence to the claim that it was not solely fiscal policy but also the underlying bureaucratic capacity to tax that was being transformed in this period.
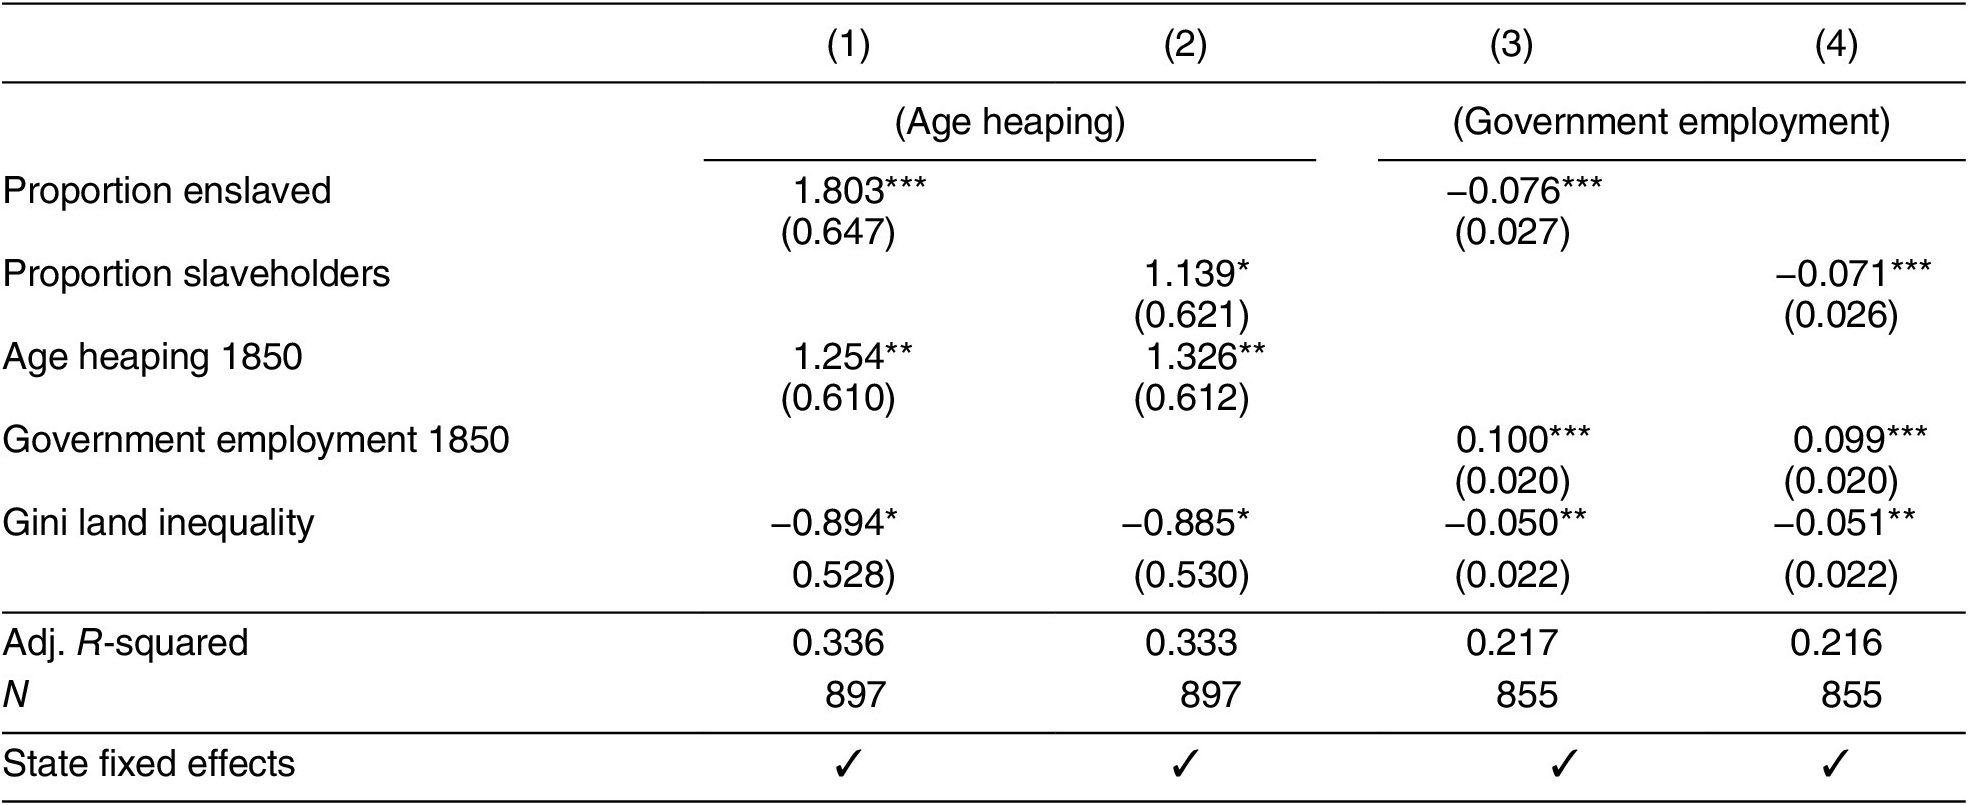
In columns 1 and 2 of Table 3, we present OLS regressions of Age heaping among whites on racial-status inequality. A one standard deviation increase in 1860 proportion enslaved corresponds with approximately a 1.8 percentage point increase in the Whipple’s index measuring age heaping. In order to address the concern that institutional weakness in 1880 was a legacy of historically weak institutions created under slavery (Engerman and Sokoloff Reference Engerman and Sokoloff2002), we control for age heaping among whites prior to the war using the 1850 full sample dataset.
OLS Regressions of Age Heaping and Per Capita Government Employees 1880 on Racial Status
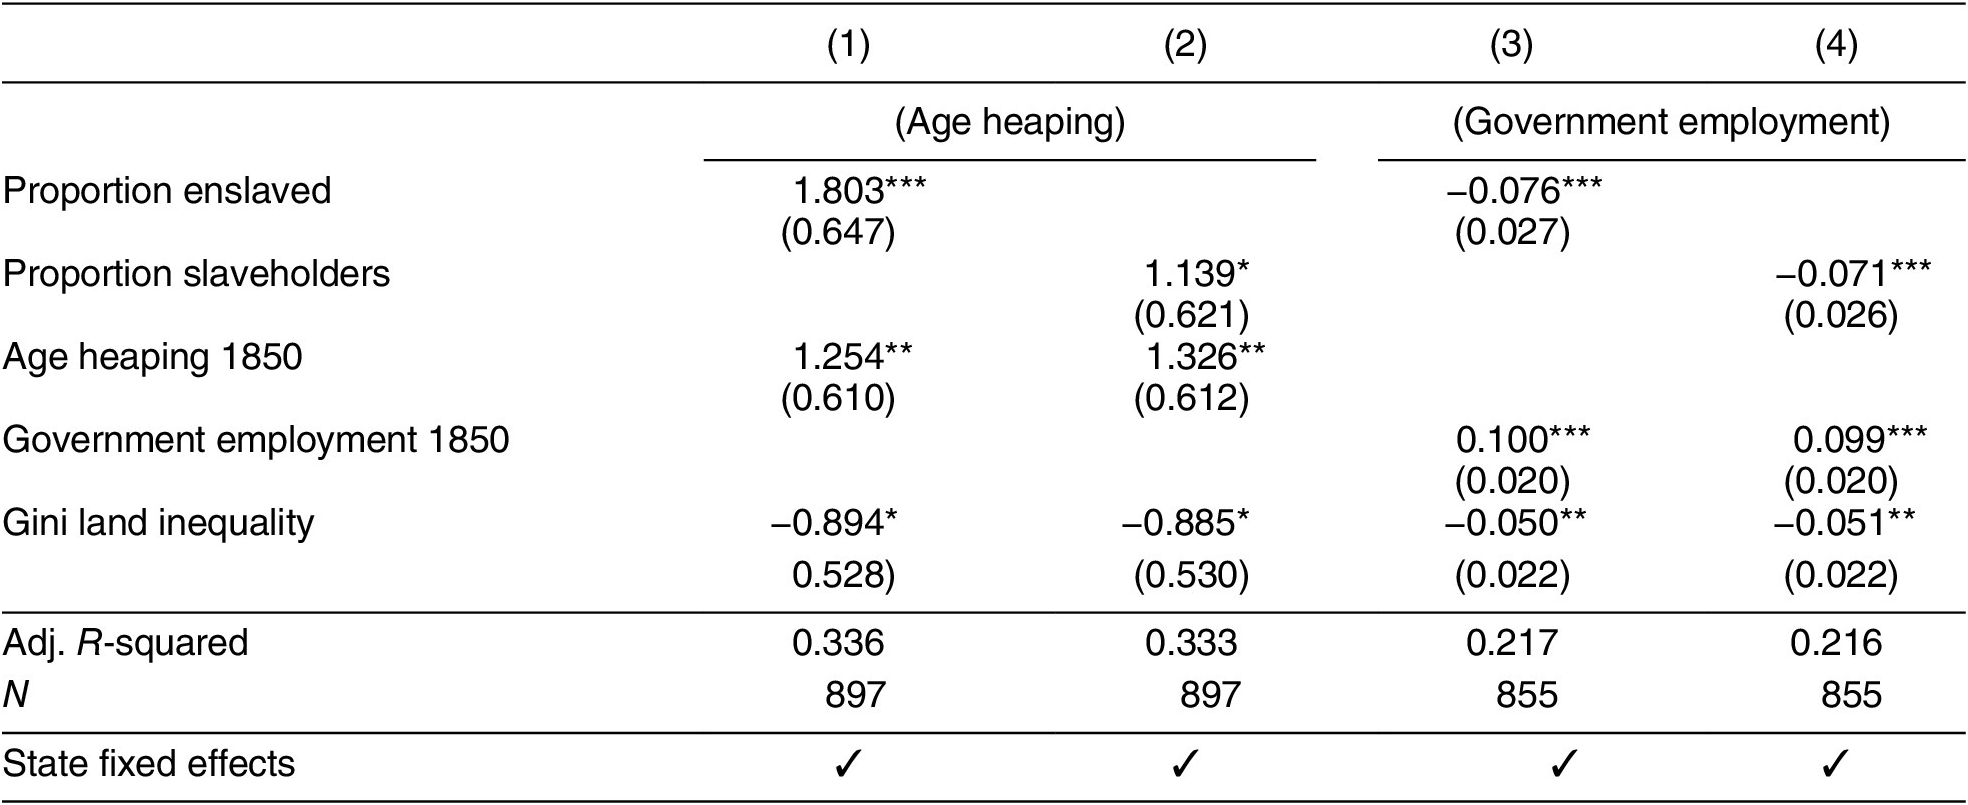
Note: Controls: area, population, free Black, farm value, river access, and rail access. Continuous variables standardized. *p < 0.10, **p < 0.05, ***p < 0.01.
In columns 3 and 4, we present models in which we regress government employment per capita in the county on our measures of status inequality. Once again, we control for government employment in the county prior to the war in 1850 using the full sample dataset from that year. In columns 3 and 4, we present a negative and robust association between per capita government employment in 1880 and the proportion enslaved in 1860. Taken together, these age heaping and government employment findings provide evidence in support of our argument that not only levels of taxation but also underlying bureaucratic capacity were weakened in the aftermath of Reconstruction.
Intrawhite Economic Inequality
Slavery also harmed many poor whites who did not benefit economically from it and were likely made worse off due to suppressed wages and high levels of illiteracy (Merritt Reference Merritt2017). An expansion of the franchise to emancipated Black men would have benefited poor whites to the extent that it resulted in greater taxation of the wealthy and better public goods. We argue, however, that intrawhite inequality was less likely to matter in places with a greater degree of racial-status inequality between Black and white citizens. Instead, in such places, poor whites might value their higher status relative to Black Southerners for both material (access to schools and other public functions) and psychological (a higher social rank not accorded to Black citizens) reasons. Therefore, we expect that places with higher racial-status inequality and higher intrawhite inequality were more likely to experience tax decreases and bureaucratic weakening in 1880.
To assess this claim, we examine the interactive effect of intrawhite inequality and 1860 proportions enslaved and slaveholdings. To measure intrawhite inequality, we create a measure called Intrawhite occupation gini, using the individual occupations of white males from the 1850 census. We used the Duncan Socio-Economic Index available through the IPUMS database that is based upon the income level and educational attainment associated with each occupation in 1950.Footnote 24 We calculate county-level occupational Gini coefficients using these scores. In Table S9 in the appendix, we again examine the relationship between slavery and our measures of bureaucratic capacity, this time explicitly modeling the interaction between proportion enslaved and intrawhite occupational inequality.
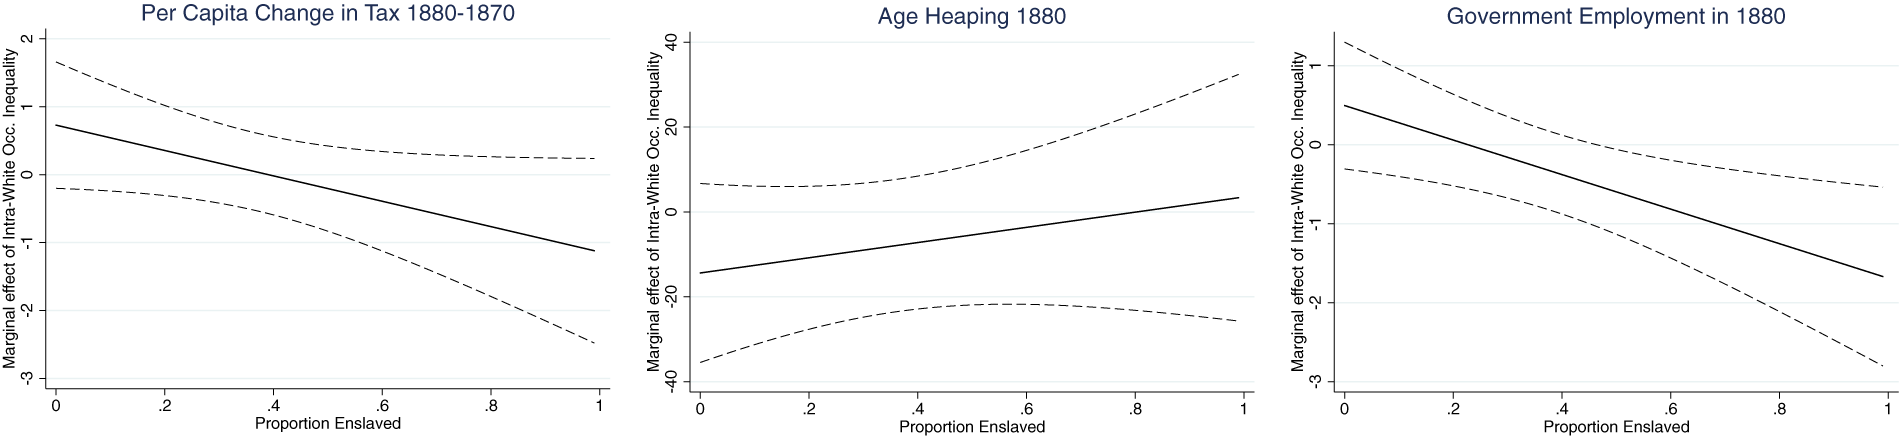
We find that the interaction term between proportion enslaved and intrawhite inequality is negative and significant for the dependent variables per capita tax collected in 1880 as well as the change in per capita tax collected between 1870 and 1880. Similarly, there is a negative and significant coefficient on the interaction term for per capita government employment in the county. While there is a positive coefficient on the interaction term, as expected, for age heaping in 1880, this is not significant at conventional thresholds.
In Figure 7, we graph the marginal effect of Intrawhite occupation Gini on the change in per capita tax collections between 1870 to 1880 and the two measures of bureaucratic quality. In the first panel on the left we show that when the 1860 proportion enslaved in a county increases, the marginal effect of inequality among whites on the change in per capita taxes collected between 1870 to 1880 moves from positive to negative. We find similar patterns for the other two measures of bureaucratic quality. These findings give credence to our claims that cross-class coalitions emerge within upper-status groups in places with greater status distinctions between groups.
Marginal Effect of Intrawhite Inequality on Taxation and Bureaucratic Quality

It is possible that the interactive relationship we observe between intrawhite inequality and racial-status inequality is being driven by counties with very high or very low levels of slaveholding in 1860. In Table S10 in the appendix, we rerun the models excluding counties with greater than 0.69 proportion enslaved and less than 0.01 proportion enslaved (i.e., the top 5% and bottom 5% of the sample). We find that the models remain robust to these specifications. In Tables S11–S12 and Figures S2–S3 in the appendix, we replace the intrawhite occupational Gini variable with Gini land inequality and the proportion of people who own any real property in a county—Proportion real property—and find similar results to occupational inequality. We replicate the results for the Proportion enslaved variable with the Proportion slaveholders variable in Tables S13–S15 and find that the interaction between Intrawhite occupational Gini and the proportion of slaveholders is a robust predictor of tax and bureaucratic weakening. In Table S16 we show the correlation between our measures of intrawhite inequality and proportion enslaved and slaveholders in the counties. This table shows a high correlation between our measures.
The Role of Census Enumerators
Finally, we investigate a mechanism for bureaucratic weakening by examining the role of census enumerators. We examine variation in age heaping recorded by different enumerators using the full population, individual-level dataset of the 1880 census. There were 6,957 enumerator districts across the 11 states with several enumerators per county. We argue that places with greater numbers of African Americans in 1880 were places where enumerators were more likely to face resistance from white respondents and also places where they were less likely to perform their duties effectively due to pressures from local wealthy whites. In Table S17 in the appendix, we regress the Whipple’s index for age heaping among whites on the numbers of African Americans within each enumerator district in 1880. The results show that a one standard deviation increase in the proportion of African Americans in an enumerator district is associated with an increase in the Whipple’s index of 16%. The results are robust to clustering the standard errors at the county level and using state fixed effects. In the appendix, we also provide qualitative information about the census enumeration process over time, including suggestive evidence that white elites were concerned about Black and northern white men serving as enumerators during Reconstruction, while “white men belonging to the old families” were given these positions after Reconstruction (Magnuson Reference Magnuson1995).
Discussion
One limitation of our historical analysis is that while we are theoretically interested in individual-level motivations, the available data are aggregated at the county level. Our intrawhite inequality analyses, where we use individual-level occupation and wealth data from the full 1850 census to create county-level measures of intrawhite inequality, attempt to at least partially remedy this. In this section, we explore additional qualitative evidence for our argument that cross-class racial coalitions emerged among whites to produce these outcomes.
By the middle of the 1870s, southern Democrats increasingly adopted a “straight-out” electoral strategy centered on making white supremacy the clear distinction between the two parties, resulting in an important shift in the region’s political character (Perman Reference Perman1984). In North Carolina, a Democratic journal in Alamance County told white Republicans that the national government had “passed a law to compel your children to go to school with negro children, and you to sit with negroes at church …. You are not in favor of negro equality. Then leave the party that advocates it. You owe it to yourself, and your children … to your race, and your country” (Escott Reference Escott1985, 166). In Virginia, a Democratic activist said that “[t]o save the state, we must make the issue White and Black race against race and the canvass red hot—the position must be made so odious that no decent white man can support the radical ticket and look a gentleman in the face” (Perman Reference Perman1984, 155). This strategy proved particularly important for white “redeemers” in states with larger Black populations (156).
To be clear, we do not argue that such rhetorical appeals were sufficient on their own to defeat Reconstruction. Democrats also turned to violence, intimidation, and fraud to bring Reconstruction to an end. Violence was an especially important tool in areas with larger Black populations, and it became much more strategically utilized in this period (Gelston Reference Gelston1974, 231–32; Perman Reference Perman1984). Perman describes how, through a range of strategies ranging from parades of rifle clubs to outright terrorism, “the last bastions of Republican rule were eliminated from the Deep South” (Reference Perman1984, 170–71). Along with various forms of intimidation, Democrats sometimes used outright fraud to simply change the election results during this period (Kousser Reference Kousser1974, 17, 26). Although primarily aimed at weakening Black political power, these tactics were also used to undermine white Republicanism. To the extent that increasing rhetorical appeals to white supremacy accompanied violence and fraud in producing electoral victories by the Democratic Party, though, it is consistent with our argument that maintaining a coalition between enough whites of varying economic positions was an important factor in allowing for the kinds of bureaucratic weakening observed after Reconstruction.
That said, our findings do not, strictly speaking, require a shift in the voting behavior of poorer whites. At the height of Reconstruction, many areas had majority Black electorates, which was likely itself sufficient for the policy shifts that happened (Valelly Reference Valelly2004, 32). Cross-class alliances within the dominant group, though, combined with decreasing oversight by the federal government, created the conditions that allowed for a reversal of this redistributive capacity and, over the longer term, democratization itself.
Conclusion
Reconstruction and its demise are among the most important junctures in American political development. In this paper, we demonstrate that Reconstruction was associated with higher taxation in counties where slavery was previously the most concentrated, whereas those same counties saw a weakening of taxation as well as bureaucratic capacity once white elites returned to power by the late 1870s. While democratization can lead to redistribution, even in cases where this does occur, as the case of Reconstruction in the United States shows, such a democratization-redistribution linkage can also be fleeting if elites successfully act to reverse it and work to prevent it from happening again.
Why would white elites have preferred to weaken bureaucratic institutions rather than merely reduce taxation levels? We argue that uncertainty about the future at the time of this bureaucratic weakening was a motivating factor. There was some chance that going too far in the direction of marginalizing Black Southerners through policy might invite another federal intervention in the region. Disinvesting in bureaucratic capacity itself, then, allowed white elites to achieve their goals in a more indirect way, albeit in a manner that involved substantial trade-offs for the welfare of white Southerners as well. Reconstruction, as Johnson notes, “did not suddenly stop as opposed to slowly become undone” (Reference Johnson2018, 122).
Future work might examine whether the demise of Reconstruction was a critical juncture that locked the region onto a particular path or whether the initial trajectory diverged in response to the institutionalization of disenfranchisement in the following decades. Some accounts point to a continuing lack of capacity. Describing highway policy in the late 1910s and 1920s, Johnson writes that Southern states did not benefit as much as their influence in Congress might predict, either because of ideological opposition or “simply the incapacity of southern state governments to build roads despite this additional infusion of monies” (Reference Johnson2007, 130). The region, though, did invest increasingly in infrastructural developments like water and sewer systems (Troesken Reference Troesken2004). Trounstine notes that Southern cities were early adopters of discriminatory zoning practices (Reference Trounstine2018, 79, 91). Did the advent of zoning allow for the development of capacity in a way that could more easily preserve racial hierarchy? Understanding these patterns might also involve assessing the extent to which bureaucratic development was elite-driven or mediated by demands of poorer whites and how this might have changed once the most severe suffrage restrictions were in place (Caughey Reference Caughey2018; Kousser Reference Kousser1974, 238).
Finally, our paper highlights the analytical value of placing American political development in comparative theoretical perspective. We argue that placing the American South into a larger comparative discussion about bureaucratic weakening can helpfully highlight the strategic incentives at work in a variety of contexts characterized by hierarchical social structures. Future work could examine the extent to which such comparative perspectives do—and do not—helpfully elucidate other aspects of Reconstruction and its demise (Chacón and Jensen Reference Chacón and Jensen2020; Stewart and Kitchens Reference Stewart and Kitchens2020), as well as the process of American democratization more broadly (Bateman Reference Bateman2018; King et al. Reference King, Lieberman, Ritter and Whitehead2009; Mickey Reference Mickey2015; Teele Reference Teele2018).
Supplementary Materials
To view supplementary material for this article, please visit http://dx.doi.org/10.1017/S0003055420000933.
Replication materials can be found on Dataverse at: https://doi.org/10.7910/DVN/BC2HEO.







Comments
No Comments have been published for this article.