INTRODUCTION
Cassava (Manihot esculenta) is an important crop used for human and animal foods as well as for the production of bioenergy. With an increasing human population, the demand for food and energy from cassava could also increase. Thailand is the world's major producer of cassava, and according to the Office of Agricultural Economics, the average storage root yield in 2013/14 was around 22·3 t/ha fresh weight. However, storage root yield of cassava can be improved by using appropriate production technologies, such as planting with high-yielding cultivars, selecting suitable planting dates and applying adequate fertilizer rates. At present, many improved cassava cultivars are recommended for the production system in Thailand, and each cultivar responds and adapts differently to various management practices (Kaweewong et al. Reference Kaweewong, Tawornpruek, Yampracha, Yost, Kongton and Kongkaew2013a , Reference Kaweewong, Kongkeaw, Tawornprek, Yampracha and Yost b ). Nitrogen (N) fertilizer application is one of the most important management processes for increasing cassava storage root yield. Significant responses of cassava to N fertilizer have been observed in Asia, especially in Thailand (Howeler Reference Howeler, Hillocks, Thresh and Bellotti2002). The use of N fertilizer at appropriate rates, meeting the requirements of each cassava cultivar, improves crop growth and ultimately supports the production of high storage root yield.
Previous studies have evaluated the responses of cassava to different application rates of N fertilizer and found that high rates can increase plant height, canopy width (Cenpukdee & Fukai Reference Cenpukdee and Fukai1991), number of leaves, number of storage roots, weight per storage root, final yield (Olasantan Reference Olasantan1999), leaf N concentration (Nguyen et al. Reference Nguyen, Schoenau, Nguyen, Van Rees and Boehm2002), chlorophyll concentration, chlorophyll a/b ratio, stomatal conductance, photorespiration rate, net carbon assimilation rate, specific leaf area (SLA) (Cruz et al. Reference Cruz, Mosquim, Pelacani, Araujo and DaMatta2003) and above-ground dry weight (Kaweewong et al. Reference Kaweewong, Tawornpruek, Yampracha, Yost, Kongton and Kongkaew2013a , Reference Kaweewong, Kongkeaw, Tawornprek, Yampracha and Yost b ). However, studies on the other physiological characteristics, such as crop growth rate (CGR), stem growth rate (SGR), leaf growth rate (LGR), storage root growth rate (SRGR), leaf area index (LAI), SLA and harvest index (HI) together with final storage root yields of different cassava branching types under different rates of N fertilizer applications are rare. Such studies could provide additional information concerning growth habit and crop adaptation, leading to a better understanding of the response of different cassava cultivars to N fertilizer as well as advanced knowledge of physiological determinants of cassava storage root yield. Physiological traits have been used to explain yield performances under different management practices and environments in various crops, for example soybean (Yusuf et al. Reference Yusuf, Siemens and Bullock1999), triticale (Czerednik & Nalborczyk Reference Czerednik and Nalborczyk2001), peanut (Banterng et al. Reference Banterng, Patanothai, Pannangpetch, Jogloy and Hoogenboom2003; Arunyanark et al. Reference Arunyanark, Jogloy, Wongkaew, Akkasaeng, Vorasoot, Wright, Rachaputi and Patanothai2009; Puangbut et al. Reference Puangbut, Jogloy, Toomsan, Vorasoot, Akkasaeng, Kesmala, Rachaputi, Wright and Patanothai2010), safflower (Koutroubas et al. Reference Koutroubas, Papakosta and Doitsinis2009), maize, sunflower (Massignam et al. Reference Massignam, Chapman, Hammer and Fukai2009), linseed (Dordas Reference Dordas2010) and Jerusalem artichoke (Ruttanaprasert et al. Reference Ruttanaprasert, Banterng, Jogloy, Vorasoot, Kesmala and Patanothai2016). However, studies on evaluating growth and physiological determinants of cassava storage root yield under different rates of N supply are still lacking. Such studies could be valuable in determining appropriate criteria with the overall aim of increasing crop productivity under N-limitation. Therefore, the objective of the current study was to investigate the relationship between physiological characteristics and storage root yield of three cassava genotypes under the three rates of N fertilizer.
MATERIALS AND METHODS
Plant materials
Three improved genotypes of cassava with different branching patterns were used for the current study: Rayong 9 (non-forking), Rayong 11 (forking) and Kasetsart 50 (forking). These three cultivars are high-yielding genotypes with high starch (%). They are also suitable as raw materials for industrial starch production in Thailand. Kasetsart 50 is currently the most popular cassava cultivar in Thailand and was introduced by Kasetsart University, Thailand. Rayong 9 and Rayong 11 cultivars were released by the Department of Agriculture, Thailand.
Experimental details
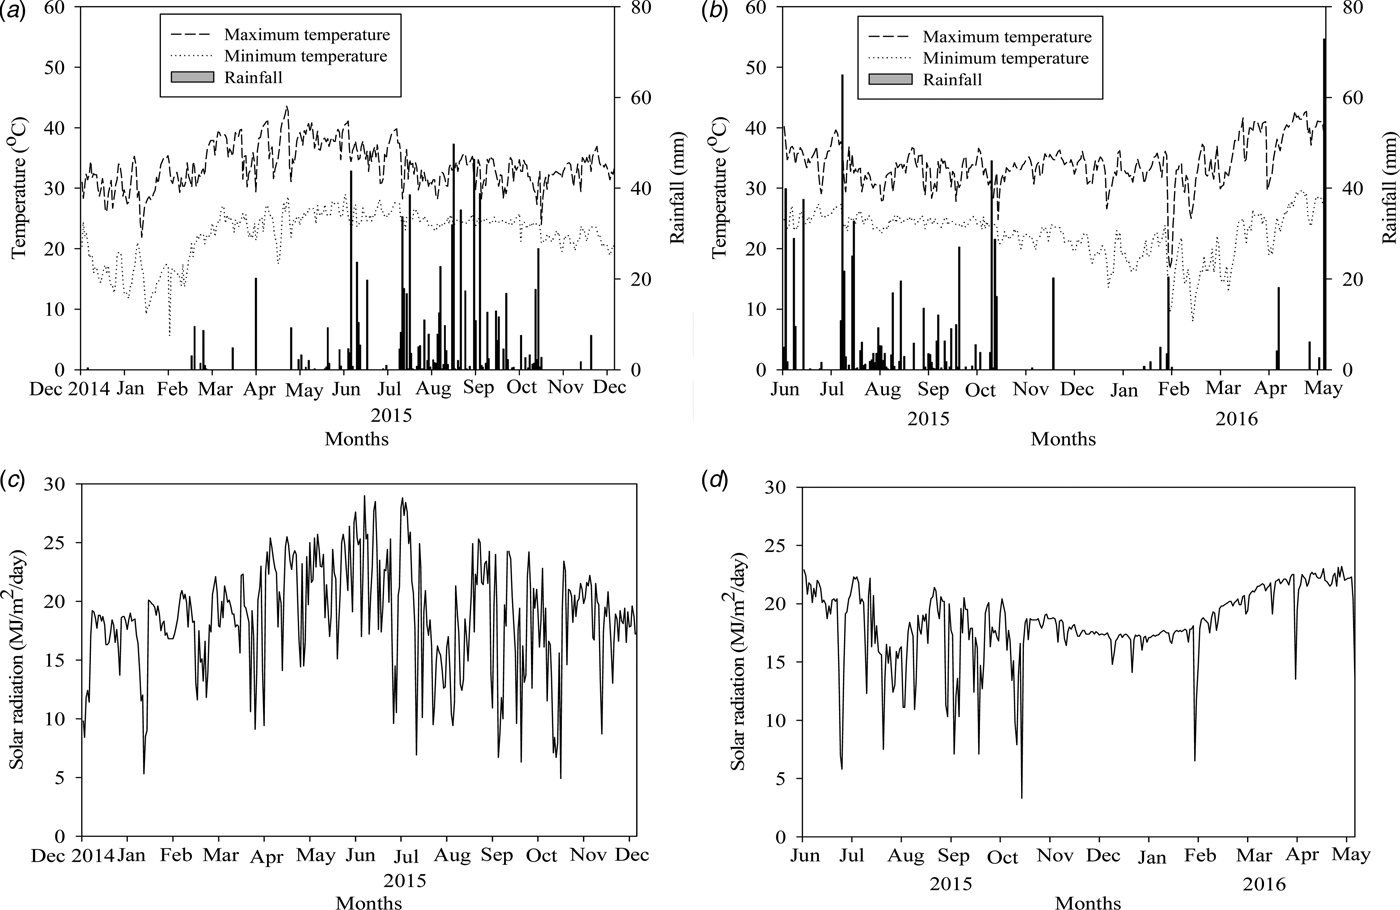
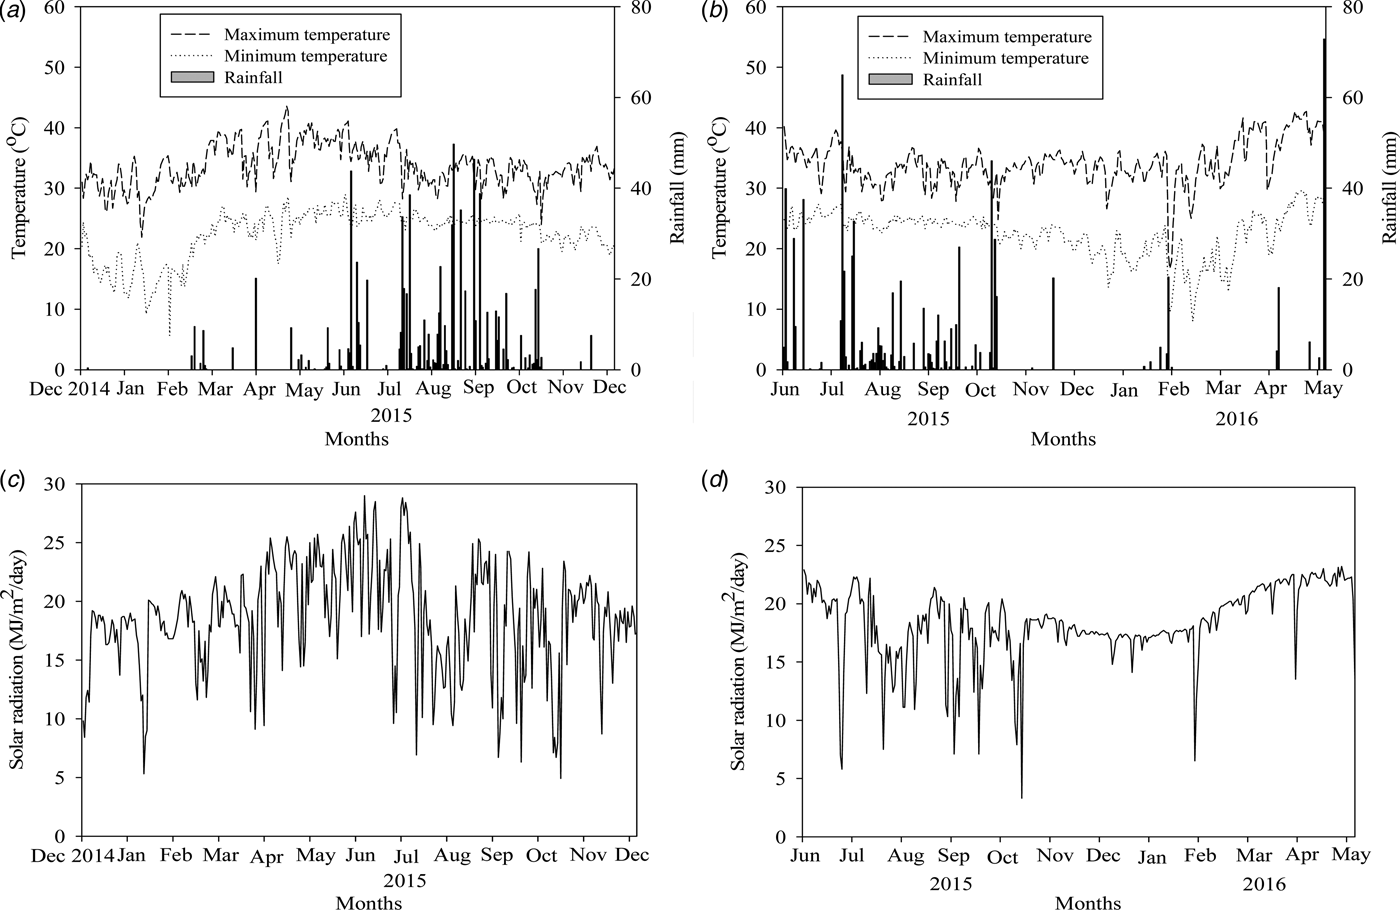
The experiments were conducted under rain-fed conditions at two sites of cassava production area (Ban Khok Sri; 16°32′14·9″N, 102°46′05·6″E, 177·3 m a.s.l., during 2014/15 and Ban Kham Pom; 16°08′50·8″N, 102°46′34·9″E, 199·4 m a.s.l., during 2015/16) in Khon Kaen province, Thailand. For both experimental sites, a randomized complete block split-plot design with four replications was used. Three different N fertilizer rates, i.e., 46·9 (minimum rate from the general recommendation of the Department of Agriculture, Thailand), 90·0 and 133·2 kg N/ha, were randomized in main plots and the three different cassava genotypes were allocated to sub-plots. The individual plot size was 120 m2 (20 × 6 m) with 1 m between plots. Land preparation was conducted following normal procedures for experimental cassava cropping. The stems of 9-month old cassava were cut as sticks to 0·2 m in length and soaked with thiamethoxam 25% water dispersible granules at a rate of 4 g per 20 litres of water for 5–10 min to prevent mealy bug infestation. The representative planting dates for cassava production in Ban Khok Sri and Ban Kham Pom were 18 December 2014 (the dry season planting date) and 18 June 2015 (the rainy season planting date), respectively, with a spacing of 1 × 1 m2 for each cassava stick. Since there was no rain during the first month after planting on the 18 December 2014 (Fig. 1), supplementary irrigation was applied immediately after planting, at 7 days after planting (DAP) and at 14 DAP in order to facilitate germination. Weeds were controlled manually throughout the experiment and a commercial compound fertilizer grade 15–15–15 at the rate of 312·5 kg/ha was applied to all experimental plots at 30 DAP that was equivalent to 46·9 kg/ha of N, 46·9 kg/ha of phosphorus pentoxide (P2O5) and 46·9 kg/ha of potassium oxide (K2O) (minimum recommended rate for the Department of Agriculture, Thailand). In order to improve the productivity, at 60 DAP, additional N fertilizer at rates of 0, 43·1 and 86·3 kg N/ha was applied to the main plots. Additional K2O fertilizer was applied to all experimental plots at a rate of 56·3 kg/ha.
Maximum and minimum temperatures, rainfall and solar radiation for the growing periods of (a and c) 2014/15 and (b and d) 2015/16.
Data collection
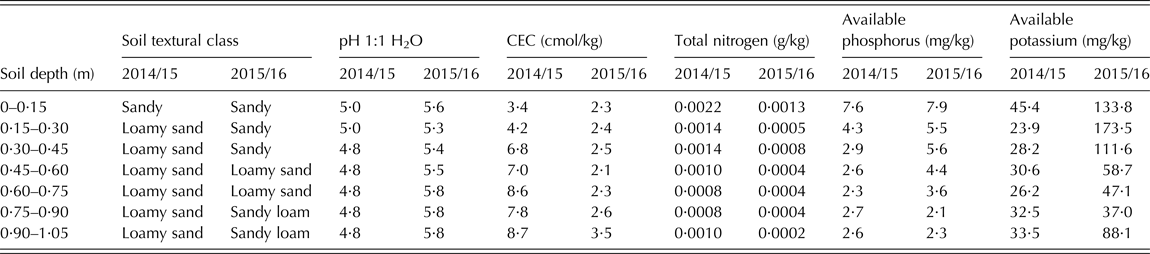
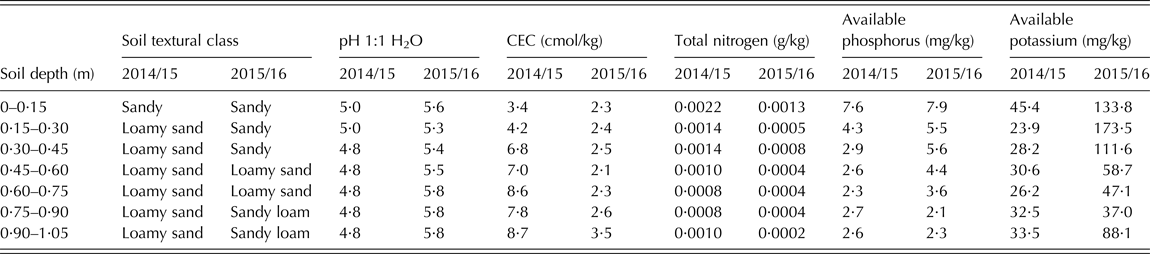
Soil physical and chemical properties for the two experimental years were determined before planting. Soil samples were taken from three points in each experimental site at 15 cm depths up to 1·05 m for soil texture, pH, cation exchange capacity (CEC), total N and exchangeable phosphorus (P) and potassium (K) analysis. Table 1 shows the soil analysis results; soil texture at 0–0·15 m for both experimental years was sandy, with low total N values, indicating low soil fertility.
Soil properties prior to land preparation for the two experimental years
Crop growth data in each experimental plot were recorded from four cassava plants per plot at 90, 120, 180 and 210 DAP. At final harvest (300 DAP), crop data were recorded for eight plants per plot. The plants were separated into leaves, stem and storage root, and all plant organs were then sub-sampled (about 0·10 total fresh weight of each organ). The sub-samples of green leaf were used to measure leaf area using a leaf area scanning meter (LI-cor3100). Sub-samples of all plant organs were oven-dried at 70 °C to constant weight to determine the dry weight of individual plant organs. Total leaf area and its corresponding dry weight at 120 and 210 DAP then used to calculate SLA, which was subsequently used to convert leaf weight into total leaf area and LAI. The physiological traits, i.e., CGR, SGR, LGR and SRGR during 90–120 DAP (early growth stage) and 180–210 DAP (late growth stage) were derived based on the function of changed dry weight per unit time. The value for HI was calculated based on the ratio of storage root dry weight to total crop dry weight (Yusuf et al. Reference Yusuf, Siemens and Bullock1999; Banterng et al. Reference Banterng, Patanothai, Pannangpetch, Jogloy and Hoogenboom2003; Koutroubas et al. Reference Koutroubas, Papakosta and Doitsinis2009). Starch content of storage roots at final harvest was determined by the specific gravity method. In addition, meteorological data were also recorded, i.e., daily maximum and minimum temperatures, amount of solar radiation and rainfall.
Statistical analysis
Separate analyses of variance for each experimental year and combined analysis with orthogonal polynomial contrasts for the data from the two experimental years were performed. Least significant difference was used for the mean comparisons. The relationship between physiological traits and final storage root yield was examined by single and multiple regression analyses. The stepwise regression technique was conducted to search for the best multiple regressions (Gomez & Gomez Reference Gomez and Gomez1984). The analysis of variance (ANOVA) and the mean comparisons were performed in MSTAT-C Version 1.42 (Freed & Nissen Reference Freed and Nissen1992). Partition of the variances into linear and non-linear contrasts and regression analysis were performed using Statistix 8 (Analytical Software, Tallahassee, Florida, USA).
RESULTS
Crop traits for the 2014/15 growing period
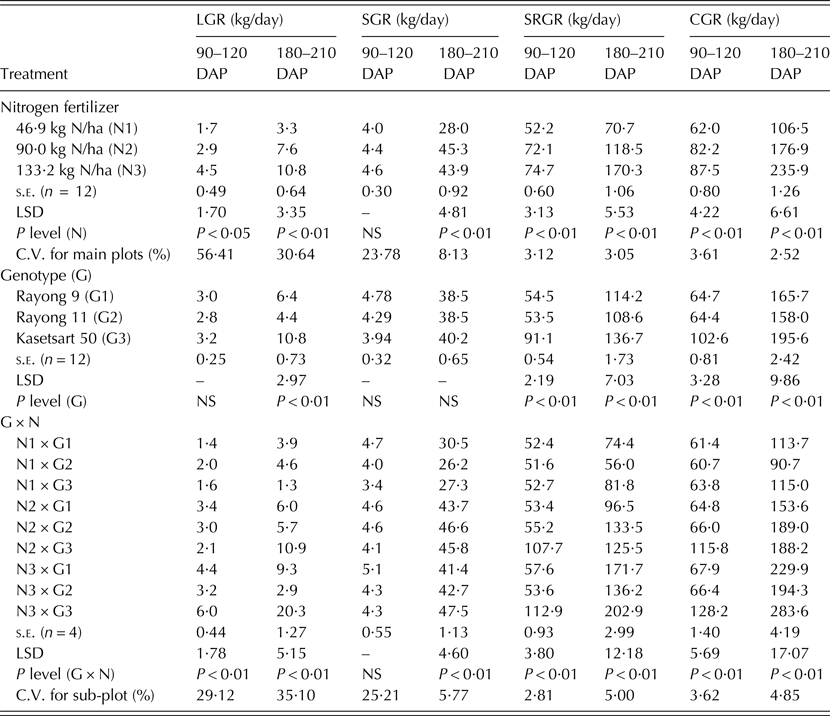
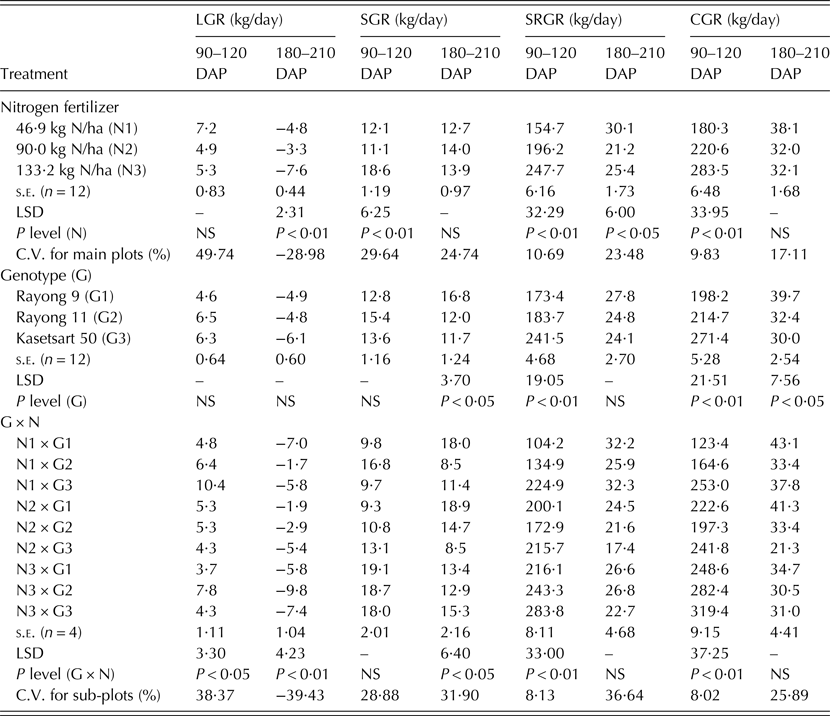
In 2014/15 with a planting date of 18 December 2014, representing the planting date of cassava for the dry season (Fig. 1) in Thailand, growth rates during 180–210 DAP in terms of LGR, SGR, SRGR and CGR for all different N fertilizer rates, cassava genotypes and combinations of N fertilizer and genotype were mostly higher than those during 90–120 DAP (Table 2). Significant interactions (P < 0·01) between genotypes and N fertilizer applications were found for LGR, SGR during 180–210 DAP, SRGR and CGR. The responses of the three cassava genotypes to the three different N fertilizer applications were different for those crop traits. There were significant differences among three rates of N fertilizer application for LGR during 90–120 DAP (P < 0·05), LGR during 90–120 DAP (P < 0·01), SGR during 180–210 DAP (P < 0·01), SRGR (P < 0·01) and CGR (P < 0·01), but not for SGR during 90–120 DAP, and high rates of N fertilizer application produced increased values for most crop traits in Table 2. Significant differences (P < 0·01) between the three cassava genotypes were also recorded for LGR during 180–210 DAP, SRGR and CGR, and Kasetsart 50 showed improved performance for almost all crop traits when compared with the other two genotypes (Table 2).
Means for leaf growth rate (LGR), stem growth rate (SGR), storage root growth rate (SRGR) and crop growth rate (CGR) during 90–120 and 180–210 days after planting (DAP) of three cassava genotypes under three nitrogen (N) fertilizer rates in 2014/215
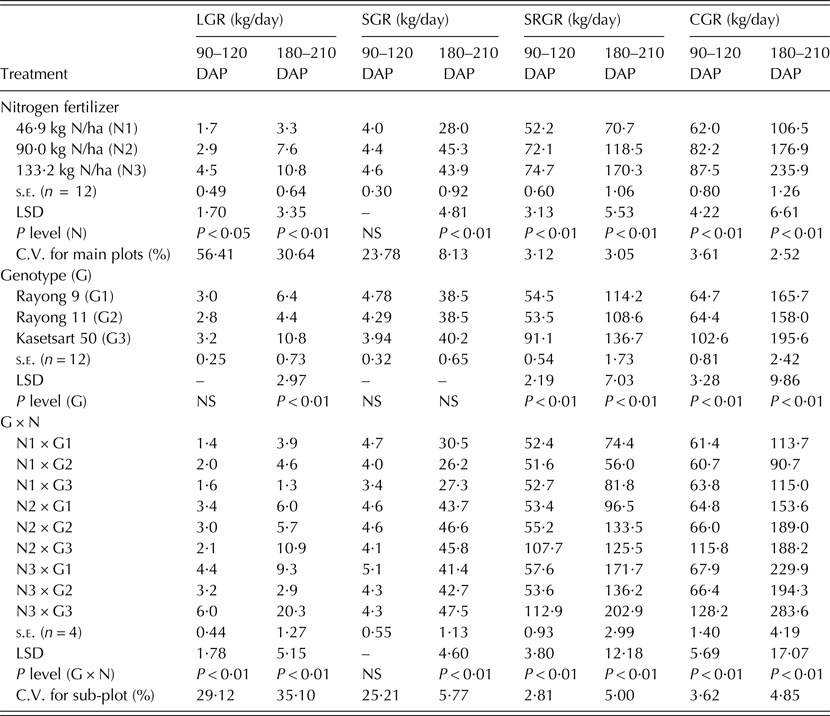
C.V., coefficient of variation; NS, not significant; s.e., standard error; n, number of observations; LSD, least significant difference.
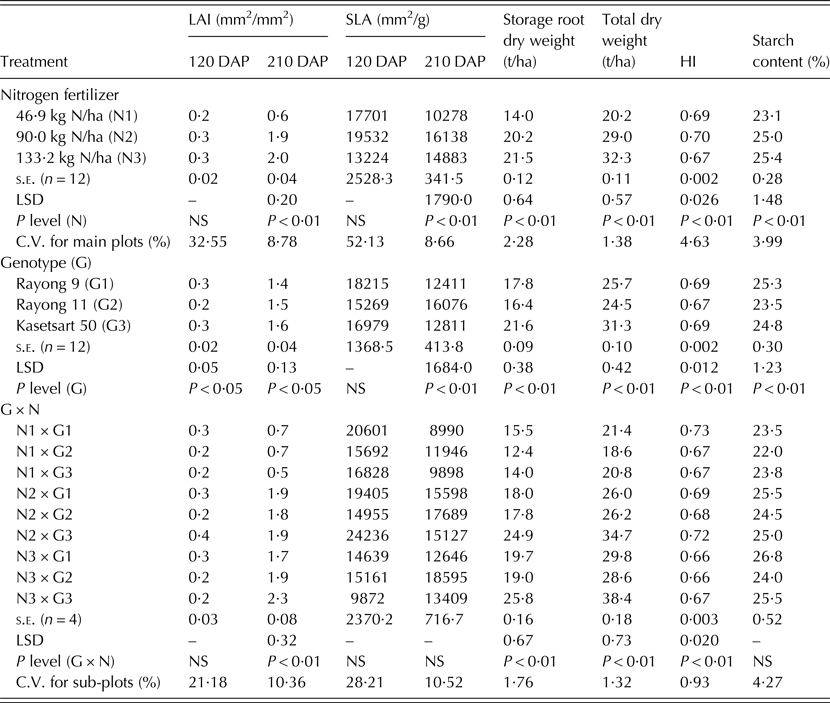
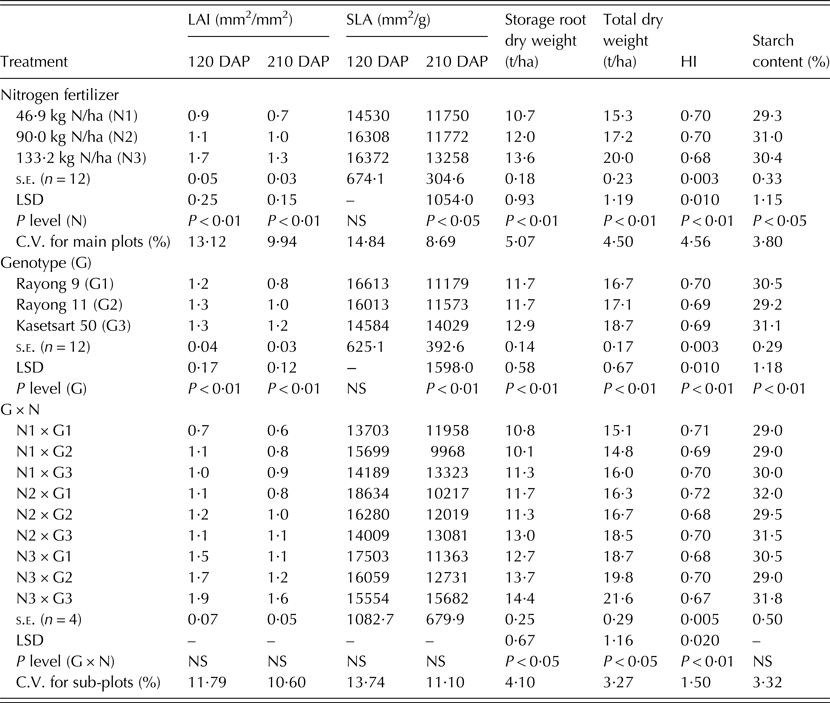
The values of LAI at 210 DAP for all additional N fertilizer rates, cassava genotypes and combinations of N fertilizer applications and genotypes were mostly higher than those at 120 DAP (Table 3). Interactions between genotypes and N fertilizer applications (P < 0·01) were also found for LAI at 210 DAP, storage root dry weight, total dry weight and HI. There were significant differences (P < 0·01) among the three rates of N fertilizer for LAI at 210 DAP, SLA at 210 DAP, storage root dry weight, total dry weight, HI and total starch content, but not for LAI at 120 DAP and SLA at 120 DAP, and high rates of N fertilizer application produced higher values for most crop traits (Table 3). Comparing the three cassava genotypes, there were significant differences for LAI (P < 0·05), SLA at 210 DAP (P < 0·01), storage root dry weight (P < 0·01), total dry weight (P < 0·01), HI (P < 0·01) and total starch content (P < 0·01). Kasetsart 50 had higher values for these crop traits (except for SLA) than the other two genotypes (Table 3).
Means for leaf area index (LAI) and specific leaf area (SLA) at 120 and 210 days after planting (DAP) and storage root dry weight, total dry weight, harvest index (HI) and starch content at harvest of cassava genotypes under three nitrogen (N) fertilizer rates in 2014/15
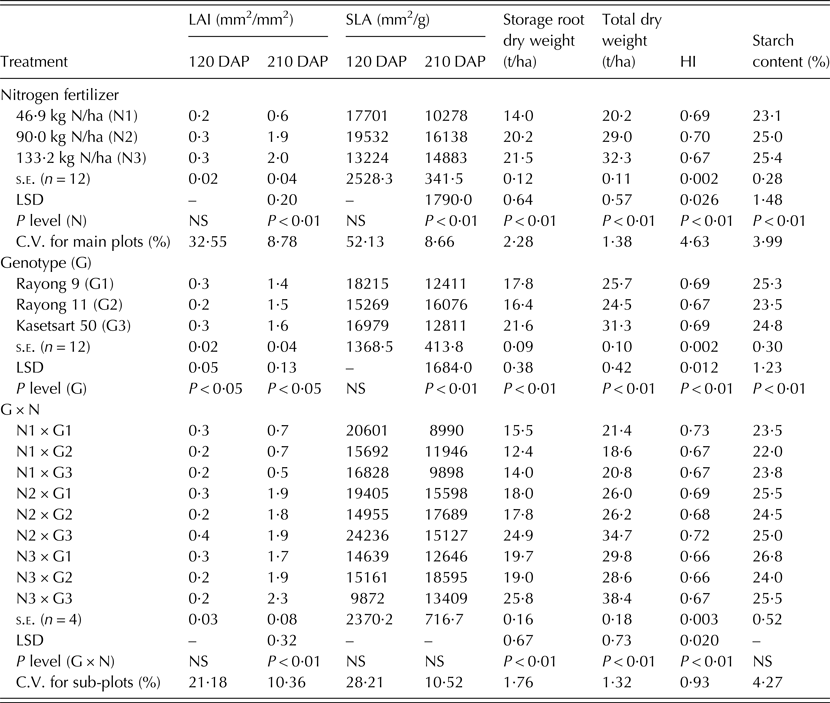
C.V., coefficient of variation; NS, not significant; s.e., standard error; n, number of observations; LSD, least significant difference.
Crop traits for the 2015/16 growing period
For 2015/16 with a planting date of 18 June 2015, representing cassava planting date for the rainy season in Thailand (Fig. 1), the growth rate values during 180–210 DAP with regard to LGR, SRGR and CGR for all N fertilizer rates, cassava genotypes and the combination of N fertilizer applications and genotypes were mostly lower than those during 90–120 DAP (Table 4). Non-significant differences for genotypes × N fertilizer applications in SGR during 90–120 DAP, SRGR during 180–210 DAP and CGR during 180–210 DAP in Table 4 indicate that the three different cassava genotypes responded similarly to the three rates of N fertilizer. Significant differences among the three rates of N fertilizer application were observed for LGR during 180–210 DAP (P < 0·01), SGR during 90–120 DAP (P < 0·01), SRGR during 90–120 DAP (P < 0·01), SRGR during 180–210 DAP (P < 0·05) and CGR during 90–120 DAP (P < 0·01) (Table 4), except for LGR during 90–120 DAP, SGR during 180–210 DAP and CGR during 180–210 DAP. Comparing the three genotypes, there were significant differences for SGR during 180–210 DAP (P < 0·05), SRGR during 90–120 DAP (P < 0·01), CGR during 90–120 DAP (P < 0·01) and CGR during 180–210 DAP (P < 0·05) (Table 4).
Means for leaf growth rate (LGR), stem growth rate (SGR), storage root growth rate (SRGR) and crop growth rate (CGR) during 90–120 and 180–210 days after planting (DAP) of three cassava genotypes under three nitrogen (N) fertilizer rates in 2015/16
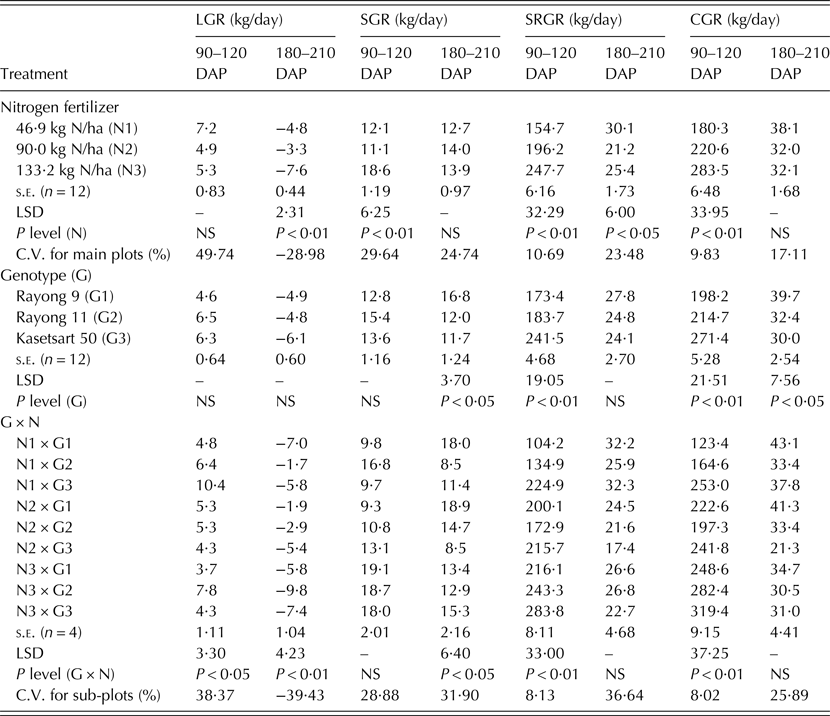
C.V., coefficient of variation; NS, not significant; s.e., standard error; n, number of observations; LSD, least significant difference.
Leaf area index at 210 DAP for all N fertilizer rates, cassava genotypes and the combinations of N fertilizer and genotype was mostly lower than at 120 DAP (Table 5). Non-significant differences for genotypes × N fertilizer applications in LAI, SLA and starch content were recorded. Significant differences among the three rates of N fertilizer application were observed for LAI (P < 0·01), SLA at 210 DAP (P < 0·05), storage root dry weight (P < 0·01), total dry weight (P < 0·01), HI (P < 0·01) and starch content (P < 0·05) (Table 5), except for SLA at 120 DAP. Application of higher additional N fertilizer rates gave high values of almost all crop traits (Table 5). There were also significant differences among the three cassava genotypes in LAI (P < 0·01), SLA at 210 DAP (P < 0·01), storage root dry weight (P < 0·01), total dry weight (P < 0·01), HI (P < 0·01) and starch content (P < 0·01). Kasetsart 50 showed the highest performance for most crop traits (Table 5).
Means for leaf area index (LAI) and specific leaf area (SLA) at 120 and 210 days after planting (DAP) and storage root dry weight, total dry weight, harvest index (HI) and starch content at harvest of cassava genotypes under addition nitrogen (N) fertilizer rates in 2015/16
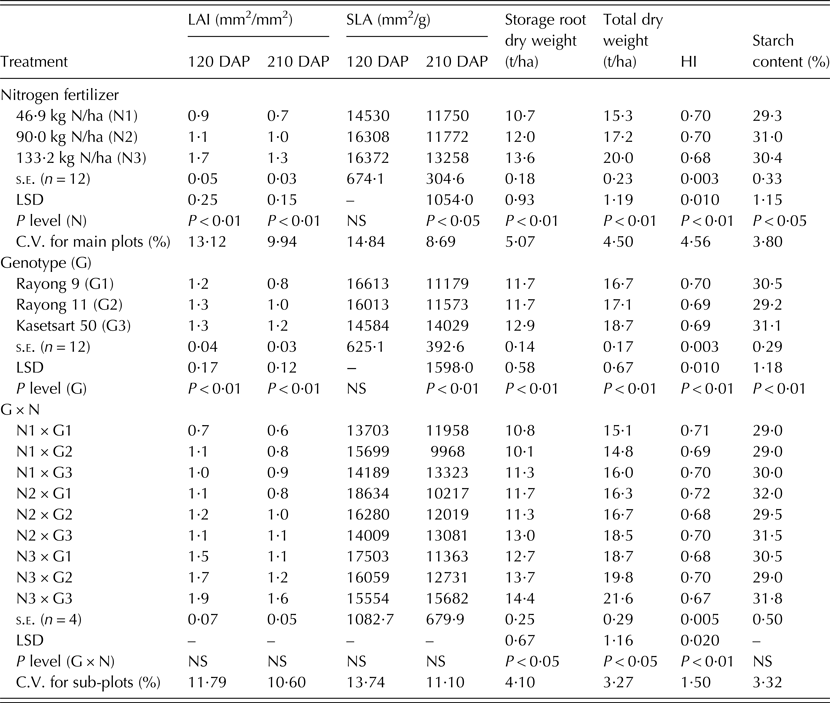
C.V., coefficient of variation; NS, not significant; s.e., standard error; n, number of observations; LSD, least significant difference.
Combined analysis and physiological determinants of storage root dry weight
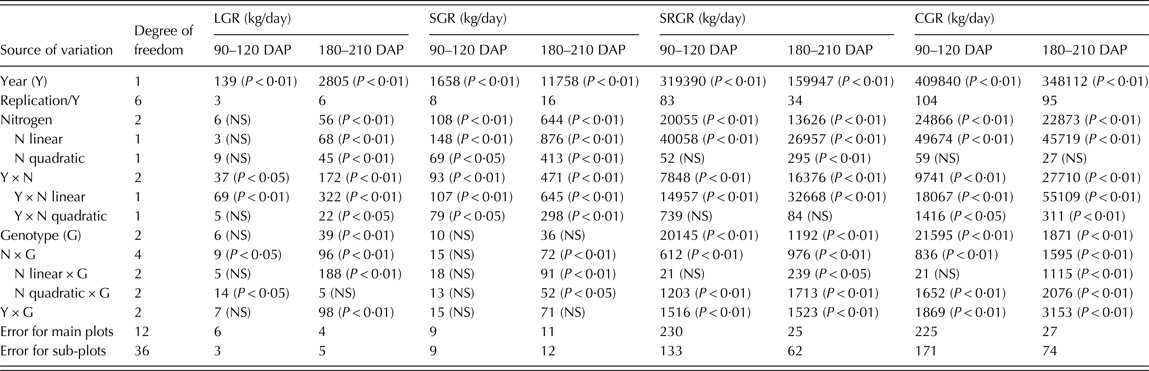
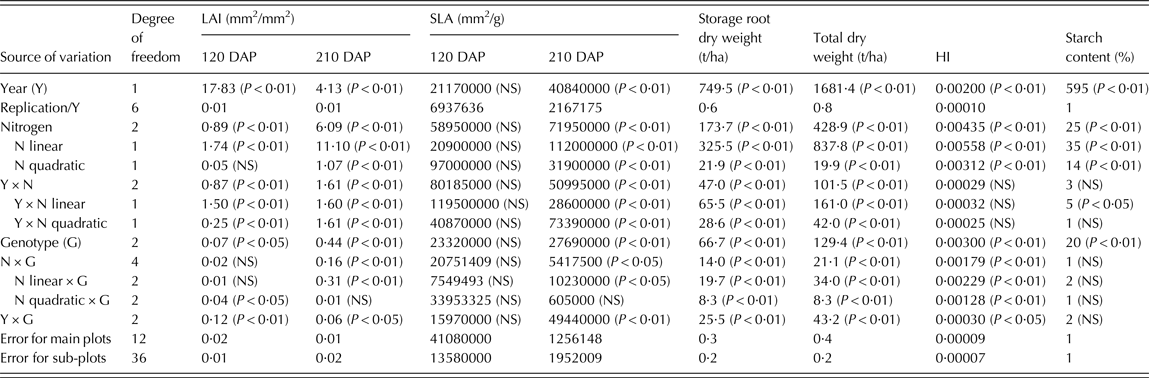
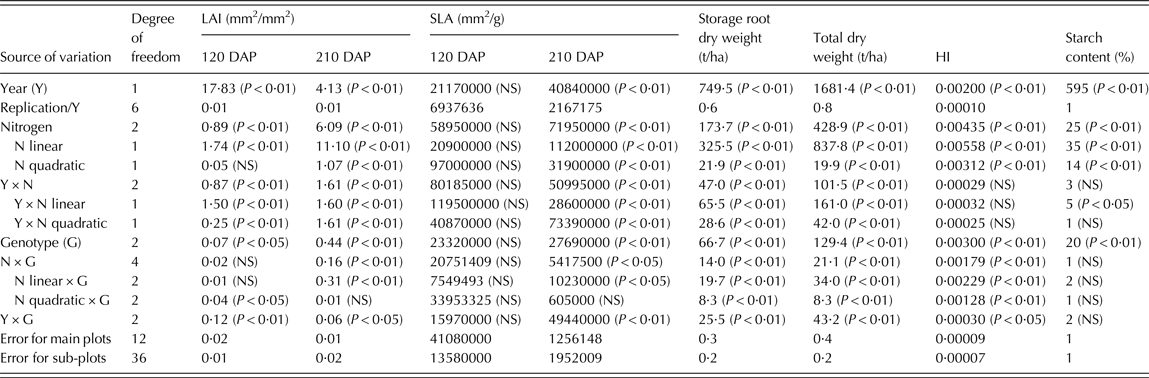
The results from the combined analysis (Tables 6 and 7) indicate that there were significant differences (P < 0·01) for almost all crop traits between the two experimental years or growing periods, except for SLA at 120 DAP. According to the final harvest data, the growing period of 2014/15 resulted in higher values of total dry weight (27·17 t/ha) and storage root dry weight (18·55 t/ha) than the 2015/16 growing period (17·50 and 12·10 t/ha for total and storage dry weights, respectively). However, the 2014/15 season had lower values of HI (0·68) and starch content (24·5%) than the 2015/16 season (0·69 and 30·2% for HI and starch content, respectively).
Mean square values from combined analysis for leaf growth rate (LGR), stem growth rate (SGR), storage root growth rate (SRGR) and crop growth rate (CGR) during 90–120 and 180–210 days after planting (DAP) of three cassava genotypes under three nitrogen (N) fertilizer rates
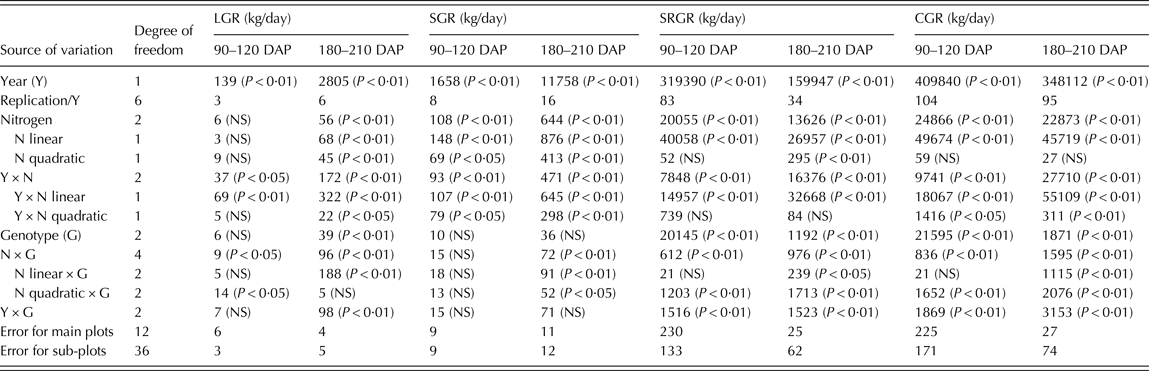
NS, not significant.
Mean square values from combined analysis for leaf area index (LAI) and specific leaf area (SLA) at 120 and 210 days after planting (DAP) and storage root dry weight, total dry weight, harvest index (HI) and starch content at harvest of cassava genotypes under three nitrogen (N) fertilizer rates
NS, not significant.
Significant differences (P < 0·05 and < 0·01) for the effect of N fertilizer applications in different years (years × N fertilizer) were found for almost all crop traits, except for SLA at 120 DAP, HI and starch content (Tables 6 and 7). For the performance of genotypes in different years (years × genotypes), non-significant differences were recorded for LGR during 90–120 DAP, SGR, SLA at 120 DAP and starch content. Significant differences in both linear and quadratic terms (P < 0·05 and < 0·01) for the effect of N fertilizer were observed for almost all crop traits, except for LGR during 90–120 DAP and SLA at 120 DAP (Tables 6 and 7). Both linear and quadratic parts of the effect of N fertilizer varied significantly with years or growing periods (P < 0·05 and < 0·01), except for SLA at 120 DAP and HI. Non-significant differences for N fertilizer (both linear and quadratic functions) × genotypes were recorded for SGR during 90–120 DAP, SLA at 120 DAP and starch content (Tables 6 and 7).
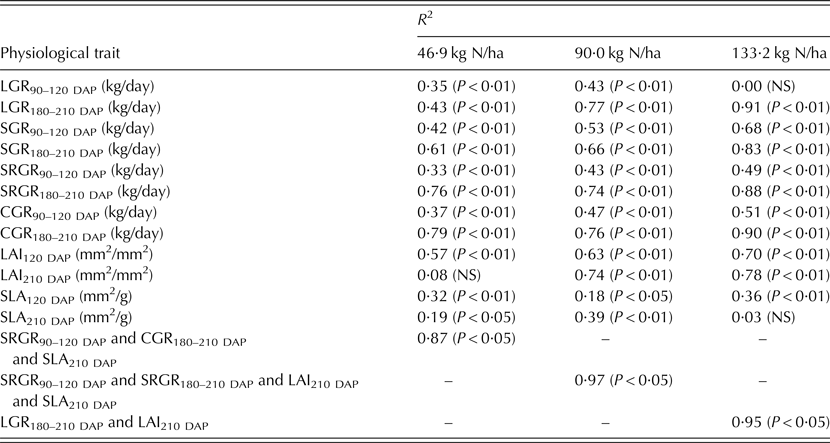
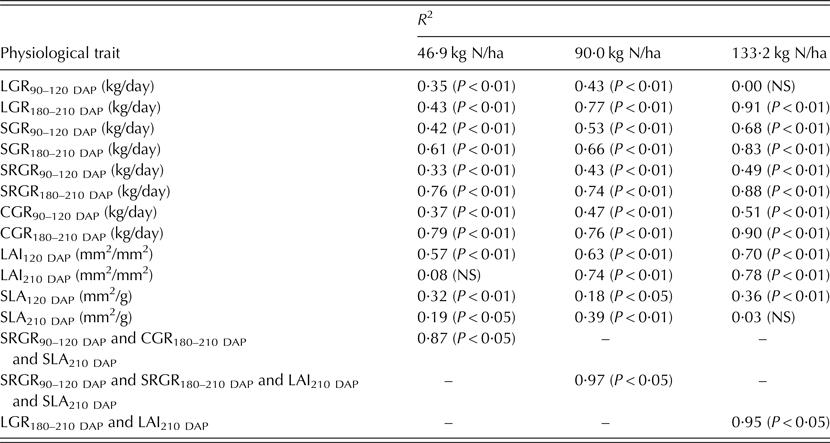
Based on the results of simple regression analyses with data from both experimental years, the growth rate values during 180–210 DAP in respect of SGR, SRGR and CGR contributed greatly to the variation in storage root dry weight at final harvest for all three rates of N fertilizer application, as indicated by high values of determination coefficients (R 2) (Table 8). Stem growth rate accounted for 61–83% of the variation in storage root dry weight at final harvest (Y (storage root yield) = 8·8 + 0·17 SGR during 180–210 DAP, Y = 9·1 + 0·24 SGR during 180–210 DAP and Y = 9·7 + 0·27 SGR during 180–210 DAP for N fertilizer of 46·9, 90·0 and 133·2 kg N/ha, respectively). The total variation in storage root dry weight at final harvest can be explained by SRGR, which ranged from 74 to 88% (Y = 8·6 + 0·07 SRGR during 180–210 DAP, Y = 10·4 + 0·08 SRGR during 180–210 DAP and Y = 12·0 + 0·06 SRGR during 180–210 DAP for N fertilizer of 46·9, 90·0 and 133·2 kg N/ha, respectively). Crop growth rate during 180–210 DAP accounted for 76–90% of the variation in storage root dry weight at final harvest (Y = 8·7 + 0·05 CGR during 180–210 DAP, Y = 10·2 + 0·06 CGR during 180–210 DAP and Y = 12·0 + 0·04 CGR during 180–210 DAP for N fertilizer of 46·9, 90·0 and 133·2 kg N/ha, respectively). Leaf area index in the early growth stage (at 120 DAP) was also able to explain storage root dry weight at harvest. However, the determination coefficients from simple regression analyses were not very high (0·57–0·70; Y = 14·5–3·76 LAI at 120 DAP, Y = 22·4–8·74 LAI at 120 DAP and Y = 22·6–5·24 LAI at 120 DAP for N fertilizer of 46·9, 90·0 and 133·2 kg N/ha, respectively).
Determination coefficient (R2 ) of simple and multiple regressions for physiological traits and storage root dry weight at harvest of cassava grown under three different nitrogen (N) fertilizer rates
NS, not significant.
LGR90–120 DAP and LGR180–210 DAP = leaf growth rate during 90–120 and 180–210 days after planting, respectively; SGR90–120 DAP and SGR180–210 DAP = stem growth rate during 90–120 and 180–210 days after planting, respectively; SRGR90–120 DAP and SRGR180–210 DAP = storage root growth rate during 90–120 and 180–210 days after planting, respectively; CGR90–120 DAP and CGR180–210 DAP = crop growth rate during 90–120 and 180–210 days after planting, respectively; LAI120 DAP and LAI210 DAP = leaf area index at 120 and 210 days after planting, respectively; SLA120 DAP and SLA210 DAP = specific leaf area index at 120 and 210 days after planting, respectively.
Multiple regression analyses using data from the two experimental years and three cassava genotypes indicated that there were different physiological combinations for describing the storage root yield of cassava grown under three different rates of N fertilizer. Storage root dry weight at final harvest of three cassava genotypes grown with N at a rate of 46·9 kg N/ha could be explained by the combination of SRGR during 90–120 DAP, CGR during 180–210 DAP and SLA at 210 DAP (accounted for 87%; Y = 9·0 + 0·01 SRGR during 90–120 DAP + 0·06 CGR during 180–210 DAP – 2·1 SLA at 210 DAP). Under the N fertilizer rate of 90·0 kg N/ha, the combination of SRGR during 90–120 DAP, SRGR during 180–210 DAP, LAI at 210 DAP and SLA at 210 DAP accounted for 97% of total variation in storage root dry weight at final harvest (Y = 6·0 + 0·04 SRGR during 90–120 DAP + 0·07 SRGR during 180–210 DAP + 13·16 LAI at 210 DAP – 13·4 SLA at 210 DAP). The combination of LGR during 180–210 DAP and LAI at 210 DAP had the highest correlations to storage root dry weight at final harvest of three cassava genotypes grown at a rate of 133·2 kg N/ha (accounted for 95%; Y = 11·2 + 0·30 LGR during 180–210 DAP + 3·55 LAI at 210 DAP).
DISCUSSION
The larger values in growth rate during 180–210 DAP and LAI at 210 DAP (the late growth period) for the 2014/15 season were probably due to higher rainfall and temperature during the late growth stages. Optimum temperature for cassava photosynthesis varies between 30 and 40 °C for hot-climate genotypes (El-Sharkawy et al. Reference El-Sharkawy, de Tafur and Cadavid1992b ). In field experiments, Keating et al. (Reference Keating, Evenson and Fukai1982a , Reference Keating, Evenson and Fukai b ) demonstrated that average temperatures above 24 °C are associated with high CGRs and storage root accumulation. In contrast, temperatures below 20 °C lead to decreased photosynthesis capacity, growth and storage root weight (El-Sharkawy Reference El-Sharkawy2012). However, in the current study results for the 2014/15 growing period stand in contrast to the results obtained during the 2015/16 growing period. Based on previous studies, higher temperatures (Keating et al. Reference Keating, Evenson and Fukai1982a , Reference Keating, Evenson and Fukai b ; El-Sharkawy et al. Reference El-Sharkawy, de Tafur and Cadavid1992b ; El-Sharkawy Reference El-Sharkawy2012) and higher amounts of rainfall during the early growth period positively impact photosynthetic potential and growth in cassava. The negative values of LGR during 180–210 DAP in the 2015/16 season were due to leaf abscission (Fageria et al. Reference Fageria, Baligar and Jones1991) resulting from drought and low temperatures.
Higher N fertilizer rates resulted in higher values for most crop traits in both the 2014/15 and 2015/16 growing seasons, indicating a positive effect of N fertilizer application on crop growth with both linear and quadratic functions. This result is similar to the report from Kaweewong et al. (Reference Kaweewong, Tawornpruek, Yampracha, Yost, Kongton and Kongkaew2013a , Reference Kaweewong, Kongkeaw, Tawornprek, Yampracha and Yost b ), who indicated that N fertilizer influences cassava growth in certain production areas in Thailand and that increasing N fertilizer up to 250 kg/ha can increase above-ground biomass and storage root dry weights. Cruz et al. (Reference Cruz, Mosquim, Pelacani, Araujo and DaMatta2003) reported that cassava grown under higher N-treatments (12 mM NO3 –) had higher photosynthetic capacities and SLA values than cassava grown under lower N-treatments (3 mM NO3 –).
The combined ANOVA results showed non-significant differences for N fertilizer (both linear and quadratic parts) × genotypes in SGR during 90–120 DAP, SLA at 120 DAP and starch content. This indicates that the responses of the three genotypes to different rates of N fertilizer for those crop traits are not linear and quadratic functions. Significant differences for years × genotypes in most crop traits indicate that the performances for those crop traits of the three genotypes vary with years or growing seasons. Comparison of the results from individual growing season analysis among the three cassava genotypes, however, showed that Kasetsart 50 had the highest performance for most crop traits in both the 2014/15 and 2015/16 growing seasons. Therefore, this genotype is particularly recommended for cassava production with additional N fertilizer applications. It is also suitable as a parental source for improving cassava in order to maximize storage root dry weight under N-limiting conditions.
The experiment in 2014/15 produced more values with statistical significance in total and storage root dry weights when compared with the experiment in 2015/16. Higher total amounts of rainfall (789·0 mm) and solar radiation (5731·0 MJ/m2/day) during the 2014/15 growing period compared with 2015/16 (540·4 mm for total rain fall and 5511·7 MJ/m2/day for solar radiation) can probably explain this result (Fukai et al. Reference Fukai, Alcoy, Llamelo and Patterson1984; Banterng et al. Reference Banterng, Hoogenboom, Patanothai, Singh, Wani, Pathak, Tongpoonpol, Atichart, Srihaban, Buranaviriyakul, Jintrawet and Nguyen2010; El-Sharkawy Reference El-Sharkawy2012; Vilayvong et al. Reference Vilayvong, Banterng, Patanothai and Pannangpetch2015). There was a significant difference in HI between the two growing seasons (data not shown), with the 2014/15 season having lower values than 2015/16. High amounts of rainfall in the 2014/15 season (especially during the late growing period) supported above-ground growth rather than growth of storage root. El-Sharkawy et al. (Reference El-Sharkawy, Hernandez and Hershey1992a ) reported that growth of leaves and stems was restricted under water stress conditions, but storage root yields were increased or remained unaffected.
The close relationship between storage root dry weight at final harvest and single growth rate trait during 180–210 DAP regarding SGR, SRGR and CGR for all three different rates of N fertilizer application indicates that an increase of storage root dry weight might be accompanied by an increase of these three physiological traits in the late growth period (6–7 months after planting). It seemed that LAI in the early growth stage (at 120 DAP) was also able to explain storage root dry weight at harvest. High storage root biomass at final harvest was associated with high mean LAI in both wet and stressed environments (El-Sharkawy et al. Reference El-Sharkawy, Hernandez and Hershey1992a ). Storage root yield, shoot and total biomass were significantly correlated with seasonal average LAI under rain-fed conditions (El-Sharkawy & de Tafur Reference El-Sharkawy and de Tafur2010). Considering the performance of the three cassava genotypes, the current results clearly demonstrate that Kasetsart 50 is superior in terms of storage root dry weight at final harvest, which is also related to high values of growth rates during 180–210 DAP with regard to SGR, SRGR and CGR as well as LAI at 120 DAP. Therefore, improving storage root yield of cassava under different N fertilizer applications should also aim to increase the values of these four physiological traits.
Based on the results from multiple regression analyses using data from two experimental years and three cassava genotypes, it is noteworthy that LAI at 210 DAP is a component of physiological determinants of storage root yield under high N fertilizer. The physiological traits that relate to leaf growth during the late growth period (LGR during 180–210 DAP and LAI at 210 DAP) are also able to explain storage root yield of cassava grown under the highest rate of N fertilizer (133·2 kg N/ha). More leaf growth and high LAI values of cassava were related to high rates of N fertilizer applications (Sangakkara & Wijesinghe Reference Sangakkara and Wijesinghe2014) and associated with higher crop photosynthesis, growth and final storage root yield (El-Sharkawy et al. Reference El-Sharkawy, Hernandez and Hershey1992a ; El-Sharkawy & de Tafur Reference El-Sharkawy and de Tafur2010). In addition, the results from multiple regression analysis also indicated that SLA at 210 DAP is a component of physiological determinants of storage root yield for cassava grown under N fertilizer at rates of 46·9 and 90·0 kg N/ha. However, when compared with the results of simple regression, single physiological traits of SLA could not be able to describe the variation of storage root dry weight at final harvest. This crop trait would be more useful as a component of physiological combinations.
In order to improve storage root yield of cassava and to better understand the responses of different cassava cultivars to N fertilizer, the current results suggest that SGR, SRGR and CGR during 180–210 DAP as well as LAI at 120 DAP are useful selection criteria to help select desirable cassava genotypes under N-limitation. The physiological combinations proposed from the current study would also be an alternative option to support decision-making in identifying suitable cassava genotypes under N-limitation. Selection of the best crop genotypes under different growing conditions based on only final yield is inefficient and analysis on physiological determinants of yield can provide useful information on how particular genotypes perform within given environments (Banterng et al. Reference Banterng, Patanothai, Pannangpetch, Jogloy and Hoogenboom2003; Arunyanark et al. Reference Arunyanark, Jogloy, Wongkaew, Akkasaeng, Vorasoot, Wright, Rachaputi and Patanothai2009; Puangbut et al. Reference Puangbut, Jogloy, Toomsan, Vorasoot, Akkasaeng, Kesmala, Rachaputi, Wright and Patanothai2010; Ruttanaprasert et al. Reference Ruttanaprasert, Banterng, Jogloy, Vorasoot, Kesmala and Patanothai2016). In addition, the current results regarding physiological determinants of storage root yield of cassava offer valuable information for further improvement of cassava modelling as a tool to help with decision-making (Jones et al. Reference Jones, Hoogenboom, Porter, Boote, Batchelor, Hunt, Wilkens, Singh, Gijsman and Ritchie2003).
CONCLUSION
The genotype Kasetsart 50 was best suited for the three different N fertilizer treatments. Stem growth rate, SRGR and CGR in the late growth period (during 180–210 DAP) and LAI at 120 DAP were identified as the best measurements associated with storage root dry weight for all three different rates of additional N fertilizer. Storage root dry weight of the three genotypes grown under N fertilizer application at a rate of 46·9 kg N/ha could be adequately described by the physiological combination of SRGR during 90–120 DAP, CGR during 180–210 DAP and SLA at 210 DAP, while at 90·0 kg N/ha could be explained by the physiological combination of SRGR during 90–120 DAP, SRGR during 180–210 DAP, LAI at 210 DAP and SLA at 210 DAP and at 133·2 kg N/ha could be illustrated by the physiological combination of LGR during 180–210 DAP and LAI at 210 DAP. Using these single traits and physiological combinations can be useful to improve the efficiency of identifying suitable cassava genotypes to grow under N-limiting conditions.
This study was supported by Khon Kaen University, Thailand. Assistances in conducting the work were also received from the Plant Breeding Research Center for Sustainable Agriculture, Khon Kaen University and from National Science and Technology Development Agency (NSTDA), Thailand. Acknowledgement is extended to the Thailand Research Fund (Project code: IRG5780003) and Faculty of Agriculture, Khon Kaen University for providing financial support for manuscript preparation.