Implications
This study revealed high genetic correlations between test days for growth and feed intake during the test periods, most pronounced for Duroc. The result indicates that the testing periods at the boar test station could possibly be reduced without loss in the genetic gain. However, it is important to ensure that the reduction of test period at the end does not affect the carcass quality. Evaluations are required to see how reduction at the beginning of the test period will affect genetic gain on feed intake. Further, the indication that the weight of the animal at the end of the test is more closely genetically correlated to feed intake of earlier periods compared with later periods of growth, stress the need for a change of the breeding goal from average feed conversion ratio in the test period to more emphasis on the shape of the feed intake curves, possibly by dividing feed intake in the whole period into separately weighted periods.
Introduction
Growth is an economically important trait for livestock species, and is associated with other economically important traits such as feed intake and feed efficiency. What classifies these traits is that they change with the age of the animals. The breeding organization Norsvin has for several years recorded BW and feed consumption on boars on a daily basis. However, in the present breeding goal, growth is defined as days from 25 to 100 kg, and feed consumption is recorded as the total amount of feed consumed in the test period (25 to 100 kg). Valuable information from the daily records is therefore not fully utilized in the breeding program. More detailed information on growth and feed consumption during the test period gives the possibility to estimate curves for growth and feed intake in addition to genetic (co)variance components for weight and feed consumption at different ages. This information may be used to select for a higher feed efficiency, and to evaluate the possibility of preselection based on growth in the early period, and testing shorter periods.
Several studies have associated the changes in pattern of growth or feed intake with genetic factors using random regressions (Veerkamp and Thompson, Reference Veerkamp and Thompson1999; Schnyder et al., Reference Schnyder, Hofer, Labroue and Kunzi2001; Huisman et al., Reference Huisman, Veerkamp and Van Arendonk2002). In pigs, Schulze et al. (Reference Schulze, Roehe, Lorenzo Bermejo, Looft and Kalm2002) estimated genetic correlations between growth and feed intake using a multiple trait animal model. Rather than modeling weight against feed intake, a random regression model run as a bivariate model including both weight and feed measured longitudinally over time would be a preferred way to study feed efficiency and its relation to weight. A bivariate random regression model may simultaneously account for changes in genetic and residual variance in each of the two traits over time, and further allow genetic and environmental correlations between the two traits to vary over time. The aim of this study was to simultaneously model growth and feed intake curves for growing pigs and estimate the parameters of this model.
Material and methods
Currently, the pig breeding in Norway includes two breeds: the Landrace and the Duroc. At the boar test station, boars have free access to feed, and feed intake is automatically recorded (FIRE; Osborne Industries Inc., Osborne, KS, USA) each time a boar enters the feeder. The boars are kept in test from approximately 25 to 100 kg, and are given the same type of feed throughout the whole test period. The analyses are based on the total feed consumption for each boar on all test days. Weights are recorded as median weights of each boar for each test day. Consequently, the analysis utilizes a single record of feed intake and BW per boar per day in the test. The data were provided by Norsvin (www.norsvin.com), and contained information on boars in test born between May 2004 and August 2006. For further details on animals and data, see Haraldsen et al. (Reference Haraldsen, Odegard, Olsen, Vangen, Ranberg and Meuwissen2009).
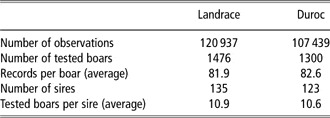
The original data included 121 801 observations on 1477 Landrace boars and 108 313 observations on 1300 Duroc boars. To remove erroneous observations, data were filtered and restrictions on plausible records of feed intake and weight were set. Limits for how much a boar can eat depended on the weight of the boars. The minimum feed intake was 0 and the maximum limit was set equal to two times the Norwegian feeding norm (Øverland, Reference Øverland1997). Weight observations that were most likely erroneous were deleted on the basis of previous and following observations. In detail, this means that the maximum weight increase from one day to another was set to 5 kg. The data set contained 120 937 observations on 1476 Landrace boars and 107 439 observations on 1300 Duroc boars, where each observation consists of a weight and feed intake record. More details on the structure of the data are given in Table 1.
The structure of the data for the Landrace and the Duroc

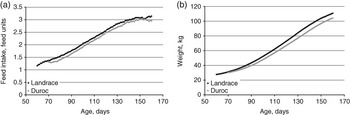
Figure 1 gives the average feed intake and BWs for the Landrace and the Duroc. The figure reveals that the Landrace has the fastest growth, and also the highest feed intake. As the Landrace grows faster than the Duroc, the Landrace starts the test at a younger age than the Duroc.
Mean feed intake (a) and mean BW (b) per day, for the Landrace and the Duroc.

The statistical models
All statistical analyses were performed using the ASREML package (Gilmour et al., Reference Gilmour, Gogel, Cullis and Thompson2006). On the basis of an earlier study of weight data (Haraldsen et al., Reference Haraldsen, Odegard, Olsen, Vangen, Ranberg and Meuwissen2009), a sire model was chosen for the parameter estimation. Multi-trait models for analyses of weight and feed consumption were run. As in Haraldsen et al. (Reference Haraldsen, Odegard, Olsen, Vangen, Ranberg and Meuwissen2009), random regression on the Legendre polynomials (of age) up to the second order were fitted for BW. However, in a bivariate model with BW and feed intake, a model with second-order random regressions of feed intake did not converge. Therefore, the statistical analyses were based on a sire model where feed intake were analyzed with first-order random regressions, whereas BW was analyzed with up to the second-order random regressions. Cross-fostering was utilized; however, to compensate for possible drawbacks of coming from a litter with many piglets, litter size was included in the model.
The model for growth was

The model for feed intake was

The fixed effects are (superscripts denote trait, i.e. w for weight and f for feed intake):
•
 = regression on the Legendre polynomial of order q, t = age in days, ranging from 54 to 180 in the Landrace and 63 to 180 in the Duroc;
•
= parity number (if larger than three it was set to three) in j classes, j ranging from 1 to 3;•
= regression on the Legendre polynomial of order q, k = number of piglets born in litter, ranging from 2 to 21 in the Landrace and 1 to 17 in the Duroc;•
= herd-year (at birth) classes, 98 in the Landrace and 29 in the Duroc;•
= month m at birth, 12 classes;•
= regression on the Legendre polynomial for age of order q, models the effect of pen z at age t. z is the interaction of pen number by station number (having 126 classes in the Landrace and 112 in the Duroc).
 = regression on the Legendre polynomial of order q, t = age in days, ranging from 54 to 180 in the Landrace and 63 to 180 in the Duroc;
 = parity number (if larger than three it was set to three) in j classes, j ranging from 1 to 3;
 = regression on the Legendre polynomial of order q, k = number of piglets born in litter, ranging from 2 to 21 in the Landrace and 1 to 17 in the Duroc;
 = herd-year (at birth) classes, 98 in the Landrace and 29 in the Duroc;
 = month m at birth, 12 classes;
 = regression on the Legendre polynomial for age of order q, models the effect of pen z at age t. z is the interaction of pen number by station number (having 126 classes in the Landrace and 112 in the Duroc).
The random effects are (superscripts denote trait, i.e. w for weight and f for feed intake):
•
= regression on the Legendre polynomial for age of order q, models the effect of sire s at age t, sr is the effect of the sire r of animal o; ∼MVN(0, G ⊗ A), where G is a matrix of (co)variances between the additive genetic sire random regression coefficients and A is the relationship matrix of the sires;•
= permanent environmental effect, the Legendre polynomial for age of order q for animal o at age i, poq is the permanent environmental effect of animal o, ∼MVN (0, P ⊗ I), where P is the matrix of (co)variances between the permanent environmental random regression coefficients;• e w/f = residual with [e we f]∼MVN(0,R), where R is a 2 × 2 (co)variance matrix of residual effects, which differs for different weeks of age. The residual (co)variances were assumed heterogeneous across age classes (weeks), and were divided into 18 age groups for the Landrace and 17 age groups for the Duroc.
 = regression on the Legendre polynomial for age of order q, models the effect of sire s at age t, sr is the effect of the sire r of animal o;
 ∼MVN(0, G ⊗ A), where G is a matrix of (co)variances between the additive genetic sire random regression coefficients and A is the relationship matrix of the sires;
 = permanent environmental effect, the Legendre polynomial for age of order q for animal o at age i, poq is the permanent environmental effect of animal o,
 ∼MVN (0, P ⊗ I), where P is the matrix of (co)variances between the permanent environmental random regression coefficients;
Results
Heritability and genetic correlation
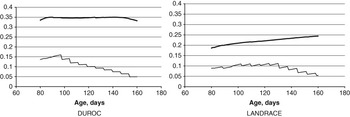
Estimated heritabilities for weight and feed intake at different ages for the Landrace and the Duroc are shown in Figure 2. In general, heritabilities for BW were higher than for feed intake for both the breeds. Average heritability of BW was higher for the Duroc (0.35) than for the Landrace (0.22). Average heritability for feed intake was similar in both the breeds after day 120, but was higher in the Duroc than in the Landrace in the earlier phase.
Heritabilities over days for the traits BW (thick line) and feed intake (dashed line) for the Duroc (left) and the Landrace (right).

For both breeds and traits, the genetic variance and permanent environmental variances increased over time (result not shown). For growth, the residual variances were small and increased only slightly with age. For feed intake, the residual variance increased much more over time than the permanent environmental variance for both the breeds.
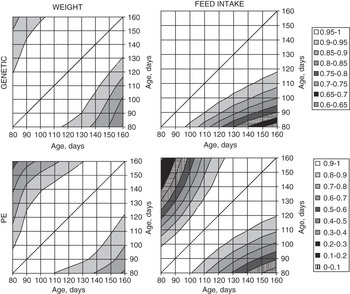
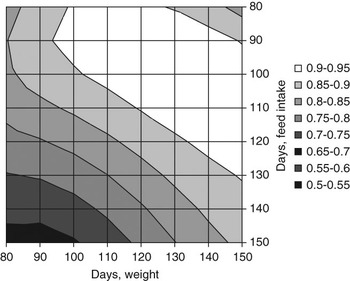
Figure 3 gives the genetic and permanent environmental correlations for BW and feed intake at different ages in the Landrace and the Duroc. The genetic correlations between the BWs in early and late period of growth are generally high in both the breeds, not being below 0.8 at any time. For the Duroc, the genetic correlations between feed intakes on different days in test were close to unity, and feed intake was thus seemingly a stable trait over time. This is different from the results for the Landrace, where the genetic correlation between feed intake in early and late period of the test are as low as 0.6.
Genetic and permanent environmental correlations between test days for the two traits: weight (left side) and feed intake (right side). The Duroc is shown above the diagonal, and the Landrace below the diagonal.

As can be seen from Figure 3, the estimated correlations between permanent environmental effects for weights early and late in test are in the range of 0.7 to 0.8 and 0.5 to 0.6 for the Duroc and the Landrace, respectively. For the trait feed intake, the estimated correlations between permanent environmental effects early and late in the test are even lower, ranging from 0.3 to 0.4 in the Landrace and from 0.1 to 0.2 in the Duroc.
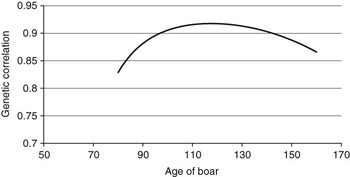
Figure 4 gives the genetic correlation between BW and feed intake over days in test for the Landrace. As can be seen from the figure, BW at the end of the test period is more correlated to feed intake earlier in the test than at the end of the test. At the end of the test period, BW is more correlated to feed intake at day 110 (genetic correlation of 0.93) than to feed intake at day 150 (genetic correlation of 0.86).
Genetic correlations between growth and feed intake on different days in test for the Landrace.

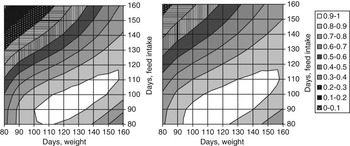
Figure 5 gives the genetic correlation between weight and feed intake on different days of growth for the Duroc. The plot is given in two dimensions, because the genetic correlation between feed intakes on different days of the test are all close to unity in the Duroc. As for Landrace, the genetic correlations between BW and feed intake are the largest in the middle part of the testing period, around 115 days of age.
Genetic correlations between BW and feed intake at different ages for the Duroc.

Figure 6 gives the correlations between permanent environmental effects for feed intake and BW in the Landrace and the Duroc, indicating that the permanent environmental effects of BW are more closely correlated with feed intake in the early test period.
Correlations between permanent environmental effects of feed intake and growth for the Duroc (left) and the Landrace (right).

Discussion
The results from this study reveal that the genetic correlations between weight in early and late periods of the test are high for both the Landrace and the Duroc. Further, feed intake in the Duroc was found to be affected largely by the same genes through the growth period. This is not the case for the Landrace, where genetic correlations decrease with increasing distance in age, which indicates that (partly) different genes are responsible for early v. late feed intake. This is not an artifact of the statistical models being used, as the same model was used for both the breeds.
As expected for a test-day model, heritability for daily feed intake was found to be substantially lower than the heritability for average daily feed intakes (as reported by Schulze et al. (Reference Schulze, Roehe, Lorenzo Bermejo, Looft and Kalm2002; 0.39) and Mrode and Kennedy (Reference Mrode and Kennedy1993; 0.45). The reason for the reduced heritability in the test-day models is that the residual variance is not reduced by averaging the observations over a time period. Lorenzo Bermejo et al. (Reference Lorenzo Bermejo, Roehe, Schulze, Rave, Looft and Kalm2003) reported heritabilities for daily feed intake using random regressions in the range of 0.02 to 0.06 during their test period, which is slightly lower than the estimates found in our study.
From the (co)variances of the models used in this study, heritabilities for average feed intake was derived to be 0.29 in the Landrace and 0.36 in the Duroc. For the Landrace, the estimated heritability for average feed intake is seemingly lower than the results of Schulze et al. (Reference Schulze, Roehe, Lorenzo Bermejo, Looft and Kalm2002; 0.39) and Mrode and Kennedy (Reference Mrode and Kennedy1993).
Although heritabilities are expected to increase when analyzing accumulated feed intake, the accuracies of the feed intake estimated breeding values (EBV) will not increase, as the same information is behind the analyses. The accuracy of the feed intake EBV will depend on how feed intake is exactly defined in the breeding goal, for example, the feeding period, which is given economic value in the breeding goal. Whether feed intake data are analyzed directly or as a cumulative trait does not affect the aforementioned EBV. However, it may be noted that, if cumulative feed intake is analyzed, the order of the Legendre polynomial function should be increased by 1, because the integration of the feed intake function over time increases the degree of the function by 1. It is therefore preferable to analyze the observed daily feed intake compared with the estimation of the accumulated variable.
For BW, the heritability estimated for the Duroc of 0.35 is higher than the estimated heritability of 0.2 to 0.25 in the Landrace. The heritabilities are, for both the breeds, lower (although more clear for Landrace) than the heritabilities reported by Gjerlaug-Enger et al. (Reference Gjerlaug-Enger, Kongsro, Ødegård, Aass and Vangen2011) on the same populations. They reported heritabilities for average daily gain from 25 to 100 kg using an animal model in the range of 0.41 to 0.42 for both the breeds. The differences between breeds are more apparent in this study compared with the results of Gjerlaug-Enger et al. (Reference Gjerlaug-Enger, Kongsro, Ødegård, Aass and Vangen2011). A possible explanation is that the genetic correlation between test days is generally lower for the Landrace than for the Duroc, which makes that, for the Duroc, the heritability at a particular test day is closer to the overall heritability across the entire test. The results on heritabilities for the Landrace are slightly higher than heritabilities of 0.17 to 0.20 reported by Huisman et al. (Reference Huisman, Veerkamp and Van Arendonk2002), estimated by random regression on weight recordings measured at three different ages.
As can be seen from Figure 2, the estimated heritability for growth in the Duroc decrease toward the ends. The number of observations at the end of the period tend to decrease, especially because only the slowest growing animals reached the highest ages. The data in the tails therefore only represent a subset of the genetics compared with all the animals represented in the middle of the growth period, which may be a possible explanation for the decreasing heritability at the tails.
For the genetic correlation between BW and feed intake, we found that the correlations are the largest early in the test period for both the breeds. Therefore, a high genetic growth capacity is seemingly closely related to a high feed intake during the early growth period (days 95 to 140). Our results support the results of Schulze et al. (Reference Schulze, Roehe, Lorenzo Bermejo, Looft and Kalm2002), who reported genetic correlations between feed intake in different periods of growth and average daily gain using a multiple trait model, and found the largest genetic correlations between feed intake and growth to be in weeks 3 to 5 of a total 9-week-test period.
Owing to convergence problems, feed intake was analyzed with a first-order Legendre polynomial. Other models, such as splines (Huisman et al., Reference Huisman, Veerkamp and Van Arendonk2002), fitting other mathematical functions or using Gibbs sampling for the estimation of parameters (Schnyder et al., Reference Schnyder, Hofer, Labroue and Kunzi2001) could have been tested; however, we did not expect the low order of fit for feed intake to affect the genetic correlations.
One advantage of random regression compared with multivariate analyses is that random regressions allow the (co)variances on every day of test to change continuously over time, without running an over-parameterized multi-trait model. The model used in this study also allows the residual variance to change over time. The estimated residual variance for BW was relatively stable over time, whereas the genetic and permanent environmental variances increased over time for both the breeds. In the Duroc, the permanent environmental variance increased more over time than it did in the Landrace. This causes the heritability for BW to be stable over time in the Duroc, whereas it increases over time in the Landrace (Figure 2). The changes in variances over time found for BW are showing the same pattern as a study published by Huisman et al. (Reference Huisman, Veerkamp and Van Arendonk2002). For feed intake, residual variance increased more over time than the genetic and permanent environmental variances. The explanation for the observed difference in the pattern of change of the variances for the two traits over time could possibly lie in the nature of the traits. BW is actually the cumulative growth of an animal, and variance of genetic and permanent environmental effects are thus expected to increase with age. Furthermore, residual variation, that is, temporal variation from day-to-day in BW is expected to explain a relatively small fraction of the variance toward the end of the testing period. However, feed intake is not recorded as an accumulative trait over time. As a consequence, variances of genetic and permanent environmental effects do not necessarily increase with age, and daily feed intakes may have a proportionally larger temporal variation from day-to-day. The decrease in heritability for feed intake over time for both the breeds presented in Figure 2 is, however, probably caused by more error variance in the data toward the end of the test period. The extra error variance may be because of the general higher level of feed intake, causing a higher variability in its recording, or the accurate feed intake recording of larger animals may be genuinely more difficult, alternatively the larger animals may show more variability in feed intake from one day to the next.
In the current breeding programs of both the Landrace and the Duroc, selection on growth and feed intake are based on the period between 25 and 100 kg. Feed consumption is recorded as the total amount of feed consumed in the test period.
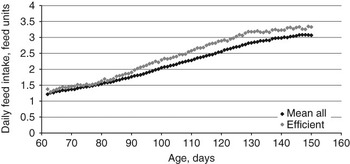
Figure 7 gives the average daily feed intake for the 10% best growing animals in the data with the Landrace as an example. The figure reveals that the animals with the largest daily gain had a steeper increase in daily feed intake compared with the mean of all the animals in the same period. This is especially visible after day 90 of growth (Figure 7). Using information on earlier periods of feed intake combined with information on growth therefore seems to be a possible way of reducing the test periods. On the basis of the genetic correlations in Figure 3, reducing the test periods would be most relevant for the Duroc, but should also be evaluated for the Landrace. Reducing the test period without loss in the accuracy of the breeding values would lead to increased genetic gain, because of the possibility of testing more animals in the same period.
Average daily feed intake for the 10% most efficient Landrace boars for growth v. the mean of all boars.

As many breeding programs also include carcass quality traits such as lean meat percentage, it is important to ensure that a reduced test period does not reduce the accuracy of recording of the traits in a negative way. Gjerlaug-Enger et al. (Reference Gjerlaug-Enger, Kongsro, Ødegård, Aass and Vangen2011) reported genetic correlations between average daily growth from 25 to 100 kg and lean meat percentage on the same population as in this study, but on different animals. They reported an unfavorable genetic correlation between the two traits of −0.75 in the Landrace and −0.57 in the Duroc. Rather than reducing the test period at the end of the test, one possibility of reducing the test period would therefore be to start the test at increased weights. A consequence would then be the loss of information on daily feed intake in the earlier test period when the heritabilities are higher. Starting the test at a later stage may not save much costs, as the pigs need to be kept during the earlier stages anyway. Changes of the test periods should therefore be carefully adjusted to the breeding program at hand.
Average daily feed intake is considered to be negatively correlated to the leanness of the meat, and selection on increased leanness of the pigs may therefore lead to a decrease in the feed intake capacity of the animals. In a follow-up study, we will investigate the relationships between the growth and feed intake curves and other traits, such as leanness. This will reveal effects of selection for particular growth and feed intake curves on these other traits, which may be economically important or important for the functioning of the animal.
Acknowledgment
The helpful comments of two anonymous reviewers are gratefully acknowledged.