





1. Introduction
User understanding is an important aspect of the design process (Sanders Reference Sanders2002). This extends beyond simply understanding what the user is saying or doing to encompass more implicit components, such as understanding the user’s experiences, feelings and thoughts. The goal of empathic design is to gain user understanding (Sanders Reference Sanders2002; Surma-Aho & Hölttä-Otto Reference Surma-Aho and Hölttä-Otto2022). Kouprie & Visser (Reference Kouprie and Visser2009) describe it as getting close to the user’s lived experiences to ensure the product or service meets the user’s needs. Engineering design aims to properly formulate a problem to create an appropriate solution. However, the design process begins with an ambiguously defined problem (Cross Reference Cross1994). In the beginning, it is important to correctly understand the problem. Strong user focus is essential in this phase. A product’s success or failure can be determined by the early stages of the design process. Therefore, user understanding is the first step in defining the design problem (Otto & Wood Reference Otto and Wood2001). The development of empathy in the design process is crucial for accurately understanding users.
1.1. Empathy and design research
Empathy is a complex concept. It has been described as multidimensional without a universally agreed-upon definition or concept (Chang-Arana et al. Reference Chang-Arana, Surma-Aho, Hölttä-Otto and Sams2022). The concept of empathy has been studied for over a century in various disciplines. Specifically, disciplines like psychology (Hogan Reference Hogan1969), psychotherapy (Rogers Reference Rogers1957) and neuroscience (Decety & Jackson Reference Decety and Jackson2004; Singer et al. Reference Singer, Seymour, O’doherty, Kaube, Dolan and Frith2004) have investigated the concept and its significance. Several researchers have presented perspectives and frameworks to understand the formation of empathy. This includes empathy as a shared representation between others and self (Decety & Sommerville Reference Decety and Sommerville2004). This perspective describes empathy as the perception of an action automatically activating the perceiver’s own mental representation of the same (Jeannerod Reference Jeannerod1999; Decety & Sommerville Reference Decety and Sommerville2004; Singer et al. Reference Singer, Seymour, O’doherty, Kaube, Dolan and Frith2004).
The level of subjectivity and ambiguity associated with the term ‘empathy’ has led researchers to describe it as an ‘umbrella term’ (Chang-Arana et al. Reference Chang-Arana, Surma-Aho, Hölttä-Otto and Sams2022). Empathy research has resulted in variations of definitions for empathy, including understanding another person’s internal state (Wispé Reference Wispé1986; Ickes Reference Ickes1993; Preston & De Waal Reference Preston and De Waal2002), matching the observed neural response (Meltzoff & Moore Reference Meltzoff and Moore1997; Dimberg, Thunberg, & Elmehed Reference Dimberg, Thunberg and Elmehed2000; Hoffman, Reference Hoffman2012), feeling the same emotions (Damasio Reference Damasio2003; Decety & Chaminade Reference Decety and Chaminade2003) and imagining how another person is thinking or feeling (Ruby & Decety Reference Ruby and Decety2004). The definition of empathy has taken various forms (Preston & De Waal Reference Preston and De Waal2002), and there are as many definitions as there are researchers on empathy (Sora-Domenjó Reference Sora-Domenjó2022). This highlights the complexity connected with conceptualising empathy. To summarise the diverse concepts, previous literature classified empathy broadly into two concepts: cognitive and affective (Cuff et al. Reference Cuff, Brown, Taylor and Howat2016). However, researchers still believe that these sub-classifications of empathy are interwoven and interconnected, making a clear-cut distinction difficult (Gonzalez-Liencres, Shamay-Tsoory, & Brüne Reference Gonzalez-Liencres, Shamay-Tsoory and Brüne2013). The attempt to conceptualise empathy based on a streamlined design focus and user understanding, has been employed in several design areas, including design education (Hess & Fila Reference Hess and Fila2016), product development (Kouprie & Visser Reference Kouprie and Visser2009) and empathic design (Dong, Donglong, & Yuan Reference Dong, Donglong, Yuan and Baldwin2018; Chang-Arana et al. Reference Chang-Arana, Surma-Aho, Hölttä-Otto and Sams2022; Surma-Aho & Hölttä-Otto Reference Surma-Aho and Hölttä-Otto2022). To better understand empathy and its relationships, Surma-Aho & Hölttä-Otto (Reference Surma-Aho and Hölttä-Otto2022) presented different constructs of empathy, their conceptualisation and operationalisation. They presented five major constructs. This includes external empathic knowledge constructs (empathic design action [construct i] and research [construct ii]) and internal constructs (empathic mental processes [construct iii] and empathic orientation [construct iv]). They both lead to empathic understanding [EU; construct v]. Figure 1 shows the relationship between the constructs, highlighting those used in this study with their operationalisation in white text. Therefore, in this study, we define empathy as EU. That is, the degree of insight accuracy (understanding of experiences, feelings and thoughts) the designer gains during a user interview.
Different constructs of empathy with specific highlights (their operationalisation in white text) on those used in this study.

Figure 1. Long description
The diagram is divided into three vertical sections.
Top Section: Internal constructs.
A large cloud contains two grey boxes. The left box, with a solid border, is labeled Empathic Mental Processes and includes bullet points for Non-verbal mimicry and Verbal mimicry in white text. The right box, with a dashed border, is labeled Empathic Orientation.
Middle Section: Interaction.
Below the cloud, two profile icons face each other. On the left is a black silhouette labeled User. On the right is a white outline labeled Designer. Both have circuit-like patterns in their heads. A double-headed blue dashed arrow connects the cloud above to a central grey box below the profiles. This central box, with a solid border, is labeled Empathic Understanding and includes bullet points for Understanding mental contents and Perceived Empathic Understanding in white text.
Bottom Section: External constructs.
Two grey boxes with dashed borders sit at the base, each connected to the central Empathic Understanding box by a vertical double-headed blue dashed arrow. The left box is labeled Empathic Design Action. The right box is labeled Empathic Design Research.
Similar to other areas of design research, there are arguments as to which is more important: theory development (Cash Reference Cash2018) or pragmatic (Koskinen et al. Reference Koskinen, Zimmerman, Binder, Redstrom and Wensveen2013) research. Consequently, there is no single agreed-upon theory of empathy in design research. However, empathy in design research has been focused on understanding the user to inform the development of a product or service (Surma-Aho & Hölttä-Otto Reference Surma-Aho and Hölttä-Otto2022). The importance of empathy in design practice and research has been shown in case studies (Postma et al. Reference Postma, Zwartkruis-Pelgrim, Daemen and Du2012; Drouet, Visser, & Lallemand Reference Drouet, Visser and Lallemand2023), and it has been implemented as a tool in design research via various approaches, including empathic design (Mcdonagh Reference Mcdonagh2004; Van Rijn et al. Reference Van Rijn, Visser, Stappers and Özakar2011; Mcdonagh, Woodcock, & Iqbal Reference Mcdonagh, Woodcock and Iqbal2018), user participation (Smeenk, Sturm, & Eggen Reference Smeenk, Sturm and Eggen2018) and user simulation (Raviselvam, Hölttä-Otto, & Wood Reference Raviselvam, Hölttä-Otto and Wood2016). Furthermore, researchers have investigated how the different constructs relate to each other (Chang-Arana et al. Reference Chang-Arana, Piispanen, Himberg, Surma-Aho, Alho, Sams and Hölttä-Otto2020a; Salmi, Li, & Holtta-Otto Reference Salmi, Li and Holtta-Otto2023; Fabunmi, Halgamuge, & Holtta-Otto Reference Fabunmi, Halgamuge and Holtta-Otto2025). Specifically, how external and internal constructs relate to EU, and how empathy can be measured in design research or practice.
Research shows empathy is important to design research and practice. However, it remains unclear which empathy construct is most important for gaining accurate user understanding (EU). There is therefore a need to empirically validate the relationships among empathy constructs such as empathic mental processes, empathic orientation and EU.
1.2. Relationship between empathic mental processes and empathic understanding
Research has explored empathic mental processes and EU constructs to investigate both automatic means to measure of empathy and the relationships among the empathy constructs. Empathic mental processes focus on what goes on inside the observer’s mind when understanding another person’s experience, feelings or thoughts (Surma-Aho & Hölttä-Otto Reference Surma-Aho and Hölttä-Otto2022). This has been widely explored in neuroscience, psychology and psychotherapy to explain empathy and its processes. Several theories have been presented, such as psycholinguistic theories like the communication accommodation theory (Giles & Ogay Reference Giles, Ogay, Whaley and Samter2007; Dragojevic, Gasiorek, & Giles Reference Dragojevic, Gasiorek, Giles and Giles2016) and shared representation theories (Decety & Sommerville Reference Decety and Sommerville2004; Singer et al. Reference Singer, Seymour, O’doherty, Kaube, Dolan and Frith2004) like the perception and action model theory (De Waal & Preston Reference De Waal and Preston2017) and theory of the mind (Premack & Woodruff Reference Premack and Woodruff1978).
Design research on empathic mental processes (Chang-Arana et al. Reference Chang-Arana, Piispanen, Himberg, Surma-Aho, Alho, Sams and Hölttä-Otto2020a; Salmi et al. Reference Salmi, Li and Holtta-Otto2023; Fabunmi et al. Reference Fabunmi, Halgamuge and Holtta-Otto2025) has investigated its relationship with EU, operationalising mental processes as either non-verbal or verbal mimicry, or synchrony. Non-verbal mimicry or synchrony can be related to shared representation (De Waal & Preston Reference De Waal and Preston2017), while verbal mimicry is related to psycholinguistic theory (Dragojevic et al. Reference Dragojevic, Gasiorek, Giles and Giles2016). Non-verbal mimicry is more commonly employed in design research, using measures such as skin conductance, electromyography and facial mimicry. For example, Chang-Arana et al. (Reference Chang-Arana, Piispanen, Himberg, Surma-Aho, Alho, Sams and Hölttä-Otto2020a) investigated the relationship between physiological synchrony (skin conductance) between the designer and the user during a user interview and the designer’s EU, measured as empathic accuracy (EA; Ickes Reference Ickes1993). Also, to implement a less instrument-heavy empathic mental process measure, Salmi et al. (Reference Salmi, Li and Holtta-Otto2023) used automatic facial mimicry, a measure of non-verbal mimicry, to study the relationship between empathic mental processes and EU (EA).
Investigating verbal mimicry as an operationalisation of empathic mental processes was also explored by Fabunmi et al. (Reference Fabunmi, Halgamuge and Holtta-Otto2025). They employed verbal mimicry, measured as language style matching (LSM), to evaluate empathic mental processes and their relationship to EU (specifically, EA). LSM is related to shared feelings, a measure of empathic mental processes (Surma-Aho & Hölttä-Otto Reference Surma-Aho and Hölttä-Otto2022). As such, it provides insight into the degree of synchrony between speakers’ psychological states. In the growing body of research, LSM is used as an approach to interpersonal coordination of language styles (Müller-Frommeyer & Kauffeld Reference Müller-Frommeyer and Kauffeld2022). It is a dyadic construct grounded in the fact that people who align in their language styles exhibit psychological harmony (Niederhoffer & Pennebaker Reference Niederhoffer and Pennebaker2002; Ireland et al. Reference Ireland, Slatcher, Eastwick, Scissors, Finkel and Pennebaker2011). Prior research also suggests that the similarity in the use of function words indicates the state of the relationship between people (Niederhoffer & Pennebaker Reference Niederhoffer and Pennebaker2002; Ireland & Henderson Reference Ireland and Henderson2014; Kovacs & Kleinbaum Reference Kovacs and Kleinbaum2020).
These studies assumed that the constructs of empathy are related but they did not find a significant correlation between empathic mental processes (verbal or nonverbal mimicry or synchrony) and EU. Previous literature from other disciplines has reported that empathic mental processes play a role in empathy formation (Kleinbub Reference Kleinbub2017) and may be related to understanding. Koole and Koole & Tschacher (Reference Koole and Tschacher2016) posit that movement synchrony between the therapist and patient may improve shared emotional experience and common understanding. Several researchers have also reported a relationship between skin concordance synchrony and patients’ perceived empathic understanding (PEU; Marci & Orr Reference Marci and Orr2006; Marci et al. Reference Marci, Ham, Moran and Orr2007; Messina et al. Reference Messina, Palmieri, Sambin, Kleinbub, Voci and Calvo2013). It is important to note that the measures used in these studies differ from those in design research. However, the concept of empathy impacting dyad interaction outcomes is relatable to design research.
1.3. The focus of empathy in design research: designer vs user focus
Design research on empathy has predominantly focused on the designer. Previous studies (Heylighen & Dong Reference Heylighen and Dong2019; Chang-Arana et al. Reference Chang-Arana, Surma-Aho, Hölttä-Otto and Sams2022) have addressed the user only within the context of ethics. Focusing on the designer is essential in design, as empathic design aims to improve the designer’s skill and understanding for better design outcomes (Kouprie & Visser Reference Kouprie and Visser2009). Interestingly, even though the user’s perspective is shown to be important in user-centred and participatory design (Steen, Manschot, & De Koning Reference Steen, Manschot and De Koning2011; Trischler et al. Reference Trischler, Pervan, Kelly and Scott2018), it has been seldom investigated as part of empathy research. Specifically, how much empathy does the user perceive the designer has towards them, and how that perception impacts the designer’s EU during the interview.
1.3.1. User’s perceived empathy
User’s perceived empathy has not been directly studied in design, but studies in psychotherapy (Watson Reference Watson2002; Marci et al. Reference Marci, Ham, Moran and Orr2007; Elliott et al. Reference Elliott, Bohart, Watson and Greenberg2011) have explored the user’s perception in the context of studying therapist empathy and its relation to therapeutic outcomes (Olson Reference Olson1995). Specifically, they investigated the client’s or patient’s perception as ‘perceived empathy’. This is defined as how well the patient or client perceives the interviewer or therapist to understand them during the discussion. Previous research has investigated how perceived empathy relates to actual or expressed empathy. For example, studies (Olson Reference Olson1995; Olson & Hanchett Reference Olson and Hanchett1997) found a relationship between patients’ perceived empathy and the nurse’s expressed empathy. Chui, Li, & Luk (Reference Chui, Li and Luk2022) also found a relationship between perceived empathy and therapist-client emotional congruence. Additionally, previous research (Chu & Tseng Reference Chu and Tseng2013) found that high perceived empathy improves the patient’s efficiency of understanding preoperative information. Perceived empathy has been investigated in relation to other patient-interaction outcomes, beyond empathy or understanding, in several studies (Elliott et al. Reference Elliott, Bohart, Watson and Murphy2018).
Several instruments have been developed to measure perceived empathy in psychotherapy, including Barrett-Lennard Relationship Inventory (BLRI) (Barrett-Lennard Reference Barrett-Lennard1962), Jefferson Scale of Patient Perceptions of Physician Empathy (Kane et al. Reference Kane, Gotto, Mangione, West and Hojat2007) and Therapist Bond Scale (Saunders, Howard, & Orlinsky Reference Saunders, Howard and Orlinsky1989). The BLRI scale is the most used for clients’ perceived empathy. This instrument was specifically designed for interpersonal relationships based on Rogers’ theory that a client’s psychological adjustment depends on the extent to which the person has had a relationship with another person who is seen as being unconditionally positive, empathic and congruent (Rogers Reference Rogers1957).
The above theoretical foundation for investigating PEU can be adapted to design research. Even though it was developed for therapeutic settings, the conditions are adaptable to design research, where the designer’s ability to perceive the user’s internal frame of reference (thoughts, feelings and experiences) is key to identifying latent needs (Chang-Arana et al. Reference Chang-Arana, Surma-Aho, Li, Yang and Hölttä-Otto2020b). Also, the user’s perception of the designer is essential to the user’s disposition during the interview. Despite studies showing that the client’s PEU plays a role in the therapist’s or interviewer’s empathy and in the outcomes of interviews or interactions, the user’s perceived empathy (PEU) has not been investigated in design research or practice.
1.3.2. Designer’s empathic understanding
For the designer-focused empathy measures, previous studies have quantified empathy (EU) using both EA (the designer’s accuracy in guessing the user’s thoughts and feelings) (Ickes Reference Ickes1993; Salmi et al. Reference Salmi, Li and Holtta-Otto2023; Fabunmi et al. Reference Fabunmi, Halgamuge and Holtta-Otto2025) and portions of the empathy map (the user-evaluated designer’s insight gained during the user interview) (Gray, Brown, & Macanufo Reference Gray, Brown and Macanufo2010; Chang-Arana et al. Reference Chang-Arana, Piispanen, Himberg, Surma-Aho, Alho, Sams and Hölttä-Otto2020a).
EA is a behavioural empathy measure that addresses the subjective bias inherent in most empathy measures by changing how empathy is assessed. It quantifies the designer’s empathy as their performance on empathic tasks (for example, inferring thoughts and feelings). This operationalisation limits its application in research and practice (Fabunmi et al. Reference Fabunmi, Halgamuge, Daniel and Holtta-Otto2024a). Importantly, EA has equipped design research to understand what affects the designer’s EU (Chang-Arana et al. Reference Chang-Arana, Piispanen, Himberg, Surma-Aho, Alho, Sams and Hölttä-Otto2020a; Li et al. Reference Li, Surma-Aho, Chang-Arana and Hölttä-Otto2021). However, the time required, the human labour involved and operationalisation limitations in practice and research are current shortcomings of the measures.
In contrast, the empathy map is a tool that helps quickly understand targets (users). It helps to easily develop concepts specific to the target (Gray et al. Reference Gray, Brown and Macanufo2010), which is an essential initial stage in new product development (Sinansari et al. Reference Sinansari, Salsabila, Hanoum, Lopatka and Wlodarski2023). Bratsberg (Reference Bratsberg2012) described empathy map as a user-centric approach that focuses on understanding a person by looking at the world or situation through their eyes. The instrument contains the see, hear, say-and-do and think-and-feel elements. The think-and-feel components specifically map onto the empathy-measure concepts in psychology and psychotherapy. This dimension is similar to Ickes (Reference Ickes1993) EA measure, which employs the user’s or client’s thoughts and feelings. However, the subjective bias that accompanies the evaluation of the empathy map (user-assessed) in design research presents its own limitations.
It is important to explore what we can learn by studying the user’s PEU, since we have elsewhere learned that it plays a role in empathy formation and outcomes.
1.4. Research questions
In this study, we explore the previously found lack of relationship between the two constructs of empathy, empathic mental processes and EU, by investigating three components: empathic mental processes, PEU and actual EU. Specifically, we examine whether empathic mental processes and EU are distinct but interconnected. The former may not directly correlate with the latter, but could play a crucial role in attaining it. Furthermore, building on prior psychotherapeutic studies on perceived empathy and its relationship to outcomes, we believe it would be beneficial to investigate empathy from the user’s perspective, including what empathic mental processes entail and their role in achieving actual EU.
Additionally, the investigation of the user’s perceived empathy and the designer’s actual EU during the user interview has not been studied. We hypothesise that the user’s perceived empathy during the interview will be related to the designer’s actual EU of the user’s experiences, thoughts and feelings. We also hypothesise that empathic mental processes, measured as mimicry between the designer and the user during an interview, will affect the designer’s understanding of the user. Additionally, building on the lack of a relationship reported in previous research on empathic mental processes and EU, we hypothesise that empathic mental processes may play a crucial role in the designer’s ability to attain accurate EU, even though previous studies have shown no relationship between them.
To investigate the relationship between perceived and actual EU, and the role of empathic mental processes, such as mimicry, in such relationships, this study aims to answer the following research questions:
RQ1: Does the user’s perceived empathic understanding (PEU) during the interview relate to the designer’s actual empathic understanding (EU)?
RQ2: What do empathic mental processes indicate during a user interview?
RQ3: Do empathic mental processes, measured as verbal mimicry, correlate with empathic understanding (user’s perceived and designer’s actual understanding)?
RQ4: Do empathic mental processes mediate or moderate empathic understanding during user interviews?
2. Methodology
2.1. Experimental design
The data used in this study were obtained from a semi-structured user interview focused on designing an easily repairable cooking device to improve the cooking experience. We added repairability functionalities to the device’s specifications. This is because we are also keen on understanding the user’s experience with repairing products and how this can inform our design decisions. While data on specific user needs were collected during the interviews, they are outside the scope of the present analysis. The current study focuses exclusively on the relationships among empathy constructs between the designer and the user. The user-needs data were collected to support a separate, longitudinal investigation into how empathy translates into better design outcomes. A cooking device was chosen as our focus due to the complexity and differences that arise from various cooking styles, cultures and personalities. Therefore, designing a product for such a complex scenario requires the designer to understand the user’s experience beyond the obvious (that is, what the user says or does). This scenario exemplifies a problem where empathic design is a good fit. This is a typical scenario for most design problems in the real world. As designers, we are expected to create a single product that caters for a diverse group of customers with varied experiences, cultures, personalities and needs.
Figure 2 shows the data analysis process carried out in this study. The data collected from the various measures administered following the interview were preprocessed prior to analysis. This is discussed in further detail in this chapter.
Data analysis flow chart used in the current study.

Figure 2. Long description
The flowchart is divided into three horizontal panels connected by downward-pointing arrows.
1. Data Collection (Top Panel):
- Left: A checklist icon above a box labeled User’s Perceived Empathic Understanding.
- Center: A checklist icon above a black box labeled Designer’s Empathic Understanding, which points down to a box labeled User’s Rating, accompanied by another checklist icon.
- Right: An icon of a person at a computer above a box labeled User Interview, which points down to a Transcript document icon.
2. Data Preprocessing (Middle Panel):
- Left: A box labeled User’s P E U Rescale 0 - 6.
- Center: A box labeled Designer’s E U Rating Rescale 0 - 6.
- Right: A Transcript Split icon showing a document being divided into segments numbered 1, 2, through n.
3. Data Analysis (Bottom Panel):
- Left: A box containing the summation from i equals 1 to n of User’s P E U.
- Center: A box containing the summation from i equals 1 to n of Des. E U.
- Right: A box labeled L I W C Software L S M Analysis points down to a box containing the summation from i equals 1 to n of L S M {j}.
- Bottom: All three analysis streams point to a final central box labeled Statistical Analysis.
2.1.1. Participants
A dyadic research design was employed, with 88 user interviews conducted by four designers. Participants were required to be at least 18 years old and possess a basic level of English fluency. Aside from this, there were no other restrictions relating to gender or nationality. The participant group includes 50 females and 38 males. The study included 31 Nigerians,14 Chinese, 13 Indonesians and 7 Indian individuals, while the remaining participants were from Australia, Vietnam, Hong Kong, Singapore, Sri Lanka and other nationalities. Participants resided in Australia (67) or Nigeria (21) at the time of this study. The demographic characteristics of the participants are shown in Table 1. The reason for the difference in user base was to account for extreme variations in culture and user context in our study. The procedures followed for this study were approved by the University of Melbourne ethics committee. Each participant was also compensated for their time.
Demographic characteristics of participants (N = 88)

Table 1. Long description
The table is organized into three columns: Demographics, Groups, and n (%).
* Age: 18 to 24 years includes 31 participants (35.2%); 25 to 31 years includes 39 participants (44.3%); Above 32 years includes 18 participants (20.5%).
* Gender: Female includes 50 participants (56.8%); Male includes 38 participants (43.2%).
* Nationality: Nigeria (31, 35.2%), Chinese (14, 15.9%), Indonesia (13, 14.8%), India (7, 8.0%), Australian (4, 4.5%), Vietnam (4, 4.5%), Hong Kong (3, 3.4%), and Others (12, 13.7%).
* Current Location: Australia includes 67 participants (76.1%); Nigeria includes 21 participants (23.9%).
A note specifies that ‘Others’ includes participants from Bangladesh, Brunei Darussalam, Ethiopia, Finland, India, Iran, Malaysia, Philippines, Singapore, and Sri Lanka.
Note. ‘Others’ include participants from Bangladesh, Brunei Darussalam, Ethiopia, Finland, India, Iran, Malaysia, Philippines, Singapore and Sri Lanka.
2.1.2. Interview
Users were interviewed via Zoom to ensure consistency in the meeting platform, given the geographic differences among participants. Each user interview lasted about 20–30 minutes. The session began with general discussions about cooking, followed by three cooking scenarios to help the designer understand the user’s experience when cooking alone, cooking with someone and using a cooking device. Finally, repair-related questions were asked to help designers understand the user’s repair experiences and challenges (see Appendix A).
Immediately after the interview, as shown in Figure 2, the users were given a user-PEU questionnaire (see Section 2.2.1) to complete, evaluating their perception of the designer’s EU during the interview. The designer was also given an EU task to record the thoughts and feelings quadrant of the empathy map, listing the thoughts and feelings they perceived the user had during the interview. The filled ‘think-and-feel’ sub-task of the empathy map was then returned to the user as a survey to evaluate how accurate each thought and feeling was about them during the interview.
2.2. Data analysis
Three participants were removed from the analysis because they did not complete the empathy map (think-and-feel) evaluation tasks. This study examined how users’ PEU during the interview relates to the designer’s EU after participating in the interview. We also investigated the empathic mental process construct of empathy, examining not only its relationship but also its role during a user interview. Investigating this will provide a broader perspective on factors that influence the designer’s EU of the user, extending beyond a designer-centred view.
To answer RQ1, two different metrics were used to measure the EU during the interview. The user’s PEU BLRI EU Sub-scale) and the designer’s EU (empathy map (think-and-feel) sub-scale).
2.2.1. Perceived empathic understanding (Barrett-Lennard Relationship Inventory (BLRI) Empathic Understanding Sub-scale)
The user’s PEU was measured with the person-centred empathy measure approach using the BLRI EU Sub-scale (Barrett-Lennard Reference Barrett-Lennard1962). BLRI is a 64-question four-themed self-report questionnaire used to measure the client’s experience or perception of the relationship during therapy. The four sub-scales are, namely, Empathic Understanding, which is the therapist’s ability to understand the client’s experiences and feelings at the moment. The Unconditionality and Level of Regard were derived from Rogers’ idea of unconditional positive regard, and Congruence, which is the therapist’s genuineness, openness and authenticity during the interactions. This instrument is widely used in psychotherapy research due to several advantages, including being client-centred, easy to use and cheap to implement (Simmons et al. Reference Simmons, Roberge, Kendrick and Richards1995; Chu & Tseng Reference Chu and Tseng2013). The BLRI scale has good validity and reliability (r = .64 to .92), and shows good agreement between experts and non-experts, construct validity and predictive validity (Barrett-Lennard Reference Barrett-Lennard1962; Yu & Kirk Reference Yu and Kirk2009). Studies have also shown that the measure has a very good internal consistency (0.84) for empathy (Gurman Reference Gurman1977; Barrett-Lennard Reference Barrett-Lennard2015). In addition to the advantages of this measure, despite the shortcomings of self-report metrics, we used the EU sub-scale in this study because its definition closely aligns with the design-specific conceptualisation of EU by Surma-Aho & Hölttä-Otto (Reference Surma-Aho and Hölttä-Otto2022). They described EU as ‘a comprehensive understanding of others’ experience’, therefore giving it a design-specific theoretical background. In this study, the sub-scale is used to assess the user’s PEU during an interview session. This is the user’s subjective experience of the interaction.
This approach has been used in previous studies to measure clients’ perceived empathy (Kurtz and Kurtz & Grummon Reference Kurtz and Grummon1972, Marci & Orr Reference Marci and Orr2006, Mallonee, Petros, & Solomon Reference Mallonee, Petros and Solomon2022, Elliott et al. Reference Elliott, Bohart, Watson and Murphy2018, Olson & Hanchett Reference Olson and Hanchett1997) and investigate the relationship with other empathy constructs (synchrony and expressed empathy) and with outcomes. The questions were rephrased with reference to the interviewer during the user interview, similar to the study by Marci & Orr (Reference Marci and Orr2006) investigating the impact of emotional distance on psychophysiological concordance between the dyads and patients’ perceived empathy and Mallonee et al. (Reference Mallonee, Petros and Solomon2022), who investigated how clients’ perceived therapeutic alliance, empathy and coercion relate to engagement. This 16-item EU sub-scale is employed to measure the user’s perception of the designer’s understanding of their experiences, thoughts and feelings (see Appendix B). This is described as PEU in this study.
After the interview, the user’s PEU questionnaire was administered (as shown in Figure 2). Each question was accompanied by a Likert scale ranging from +3 (strong agreement) to −3 (strong disagreement), capturing the valence and intensity of users’ perceptions. The original BLRI EU sub-scale employs a forced-choice format that excludes a neutral midpoint (i.e., −3 to +3 without 0). In the present study, this scale was adapted to include a midpoint (0), resulting in a 7-point Likert scale. This modification was motivated by the contextual differences between psychotherapeutic and design research studies. The former involves longer, longitudinal interviews that are more person-centred and always personalised. While the latter involves shorter interviews (between 20 and 30 minutes), it is more problem-focused and may not be personalised. Therefore, we used a full Likert scale rather than forcing the user to choose between ‘yes’ and ‘no’. There is also a high chance that the interview duration and topic discussed (product-centred) might not be sufficient for the user to answer some of the questions genuinely. Under such conditions, participants may reasonably hold neutral or uncertain perceptions and forcing a positive or negative response could introduce measurement bias.
Importantly, prior studies have adapted the BLRI response format to suit different research contexts without compromising reliability. For example, Mallonee et al. (Reference Mallonee, Petros and Solomon2022) employed a 6-point Likert scale, while Chu & Tseng (Reference Chu and Tseng2013) used a 5-point Likert scale including a neutral midpoint. These adaptations suggest that the BLRI EU sub-scale is flexible and can be contextually modified while preserving its measurement properties. To ensure that the inclusion of a neutral midpoint did not compromise reliability, internal consistency was assessed using Cronbach’s alpha. The PEU measured by the BLRI EU sub-scale demonstrated an acceptable reliability (α = 0.75). Additionally, analysis of response patterns showed that the midpoint was selected in a relatively small proportion of responses (approximately 13%), indicating that participants did not disproportionately rely on the neutral option. Responses remained distributed across the scale, suggesting that the inclusion of the midpoint did not introduce central tendency bias. Additionally, sensitivity analysis was conducted by removing the data with at least one midpoint entry, and the internal consistency did not improve. This shows that the midpoint entries were not random or noisy but rather represent meaningful user evaluations.
While prior studies in psychotherapeutic contexts report higher reliability values (0.80–0.91) (Gurman Reference Gurman1977; Mallonee et al. Reference Mallonee, Petros and Solomon2022), such settings typically involve longer, more personalised and longitudinal interaction designs that create opportunities for relationship dynamics to grow and mature, thereby leading to more consistent responses. In contrast, the present study reflects a shorter, task-oriented context in which greater response variability is expected. Furthermore, the study design allows the questionnaire to capture immediate and state-level relational dynamics rather than trait-level dynamics that develop over the course of enduring relationships. This difference in design structure may account for the lower reliability score relative to the longitudinal therapeutic literature. However, it accurately mirrors the ideal nature of real-world interactions between a designer and a user. Overall, these findings indicate that the modified scale maintains acceptable reliability and remains appropriate for measuring PEU in design research settings.
For analysis, the ratings for each of the 16 questions were averaged to obtain the user’s PEU score. For the questions with expected positive scores, the responses were not rescaled before averaging. In contrast, for those with expected negative scores, the responses were rescaled to −3 to +3; a lower score means a higher perceived empathy. For example, question 6, ‘Sometimes, the interviewer thinks that I feel a certain way because they feel that way’. The designer is supposed to understand the user’s feelings and not project their own. Therefore, the lower the score for this question, the better the user perceives the designer’s EU towards them. It is essential to note that this rescaling was performed solely for the purpose of analysis. It is also important to note that, to avoid any misconception, we converted the scale to a non-negative scale for analysis only. The −3 to +3 scale was mapped to a 0–6 scale, and vice versa, for all analysis and calculations in this study.
2.2.2. Designer’s empathic understanding (empathy map)
We measure the designer’s understanding as the insight gained into the user’s experiences, feelings and thoughts regarding the easily repairable cooking device. EA (Ickes Reference Ickes1993) research in design research has found that designers have a higher EA score when inferring design-related entries Chang-Arana et al. (Reference Chang-Arana, Surma-Aho, Li, Yang and Hölttä-Otto2020b) rather than any thoughts or feelings. This hints that focusing on design-related thoughts and feelings could be effective in design research. We therefore build on that as it links to empathy map. Rather than requiring designers to implicitly infer user states at specific time points, empathy map directs attention to specific aspects of user behaviour, such as what they are thinking or feeling, which matches well with the idea behind EA.
Designers were required to fill the empathy map quadrants (using only the think-and-feel quadrants) with the user insight obtained during the interview. A similar approach was employed by Chang-Arana et al. (Reference Chang-Arana, Piispanen, Himberg, Surma-Aho, Alho, Sams and Hölttä-Otto2020a) in their study on using physiological measures for empathy measurement. They used the empathy map’s think-and-feel sub-scale to evaluate the designer’s user insight gained during the interview. Designers completed a survey containing the empathy map think-and-feel sub-sections after each user interview, using the corresponding prompts ‘The user thinks’ and ‘The user feels’, as shown in Table 2. The full instructional prompt provided was:
Please complete the empathy map with how well you understand the user. Using the prompt, write down the thoughts and feelings you perceive the user had during the interview.
Example of the designer’s empathic user understanding task
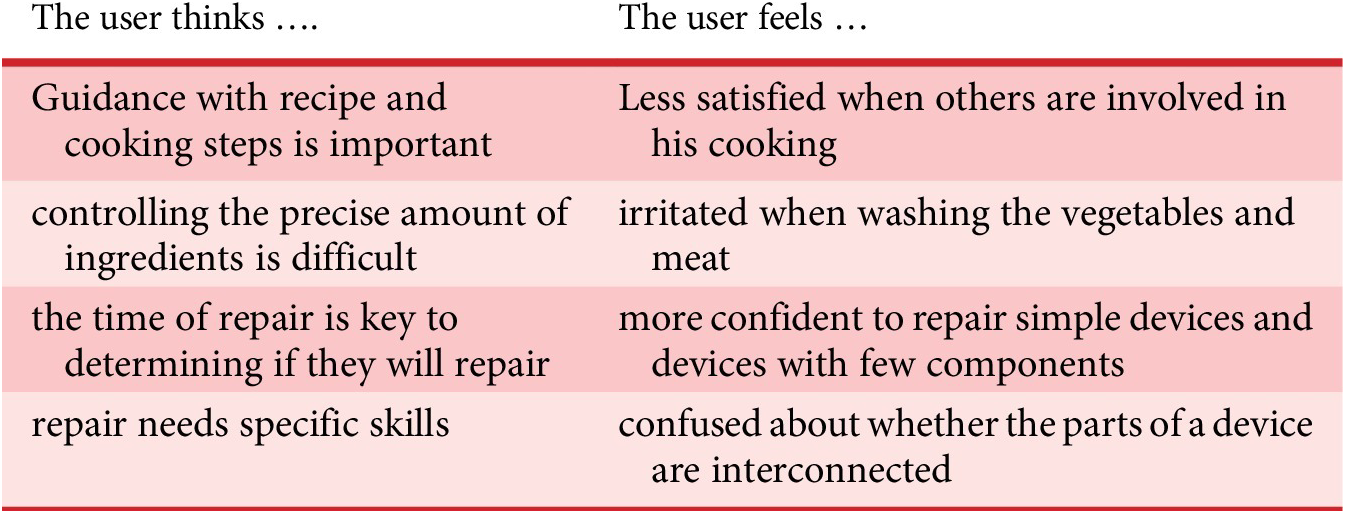
Table 2. Long description
The table consists of two headers. The left column is titled ‘The user thinks ....’ and the right column is titled ‘The user feels ...’.
* Row 1. The user thinks guidance with recipe and cooking steps is important. The user feels less satisfied when others are involved in his cooking.
* Row 2. The user thinks controlling the precise amount of ingredients is difficult. The user feels irritated when washing the vegetables and meat.
* Row 3. The user thinks the time of repair is key to determining if they will repair. The user feels more confident to repair simple devices and devices with few components.
* Row 4. The user thinks repair needs specific skills. The user feels confused about whether the parts of a device are interconnected.
Subsequently, the designer’s responses were sent to the user for evaluation (as shown in Figure 2). Users rated the accuracy of the mapped thoughts and feelings in relation to their experiences and challenges when cooking in the kitchen and repairing devices. While involving the user in evaluating the gathered insights may introduce subjective bias, this approach aligns with the foundational tenets of user-centred design, where the user serves as the judge of design success and as the focus when gathering insights for the design requirements (Sanders & Dandavate Reference Sanders and Dandavate1999; Koskinen, Battarbee, & Mattelmeaki Reference Koskinen, Battarbee and Mattelmeaki2003). Consequently, EU within the design research cannot be treated as an isolated, purely cognitive state. Because the ultimate goal of empathic design is to gain accurate user insights, the user remains the final judge of whether the designer has truly comprehended their lived experiences. Operationalising actual EU through user evaluation is not just an opinion-based approach. It presents a co-constructed validation of alignment between the designer’s guess and the user’s actual experience. Therefore, to minimise individual bias, we used the following prompt to guide the user to perform a reflective rating task on the synthesised thoughts and feelings:
Please rate how well this statement reflects your thoughts and feelings during the interview. The range from + 3 (strongly agree) to − 3 (strongly disagree) is how strongly you feel the statements are correct about your thoughts and feelings or how strongly they are incorrect.
This prompt was intentionally framed to guide users to reflect on their internal states (thoughts and feelings) during the interview and make comparative judgments, rather than focusing on external behaviours or evaluating the quality of the designer. The evaluation was conducted using a rating scale ranging from +3 (strong agreement) to −3 (strong disagreement). This scale was chosen to maintain consistency with the Likert scale range used in all the questionnaires in this study. For analysis, the user’s ratings for each designer’s mapped think-and-feel quadrants were rescaled to a 0–6 scale and then averaged.
2.2.3. Language style matching (LSM)
To answer RQ 2, we employed LSM to measure verbal mimicry between the designer and user. Unlike approaches that focus on content words, this method focuses on function words. These are described by Ireland & Henderson (Reference Ireland and Henderson2014) as ‘place holders’ whose meaning is unique to the dyads in conversation, and understanding the meaning of the same requires shared knowledge between the dyads. Although function words constitute a relatively small portion of the vocabulary, they account for more than half of the words used in everyday communication (Chung & Pennebaker Reference Chung and Pennebaker2011).
We refined the LSM metric. In previous design-related studies (Fabunmi et al. Reference Fabunmi, Halgamuge and Hölttä-Otto2024b, Reference Fabunmi, Halgamuge and Holtta-Otto2025), they used the overall LSM method by Ireland & Pennebaker (Reference Ireland and Pennebaker2010), which is most used in psychology and psychotherapy research (Rains Reference Rains2016; Cannava & Bodie Reference Cannava and Bodie2017). This is shown in Eqs. (1) and (2). The following function words are used in this equation: preposition (prep), article, auxiliary verb (auxverb), adverb, conjunction (conj), personal pronoun (ppron), impersonal pronoun (ipron) and negation (negate) words. Equation (1) shows how the LSM for each function word is calculated using the LSM for preposition (LSMprep) as an example. The LSM is then averaged as shown in Eq. (2). However, this approach measures verbal mimicry throughout the entire interview. This method may overlook important nuances and limit the study of dynamic changes in verbal mimicry, potentially obscuring insights into its role in fostering EU during the interview. To mitigate the shortcomings of overall LSM, the reciprocal Language Style Matching (rLSM), a turn-by-turn approach, was introduced by Müller-Frommeyer & Kauffeld (Reference Müller-Frommeyer and Kauffeld2022). Although this has been used to study who leads the conversation and fine-grained mimicry within interviews, it can be limited by low word count, particularly in design-based interviews.


Additionally, we do not know if a single pair of utterances used in rLSM (Müller-Frommeyer & Kauffeld Reference Müller-Frommeyer and Kauffeld2022) is sufficient to study verbal mimicry. To address this limitation, we combined the criteria presented by Ireland & Pennebaker (Reference Ireland and Pennebaker2010) with the fine-grained, turn-by-turn analytical advantages of rLSM. We chose to split the transcript into sections. Previous research in therapeutic contexts has examined LSM over time windows, such as entire sessions or 5-minute segments (Aafjes-Van Doorn & Müller-Frommeyer Reference Aafjes-Van Doorn and Müller-Frommeyer2020). However, such approaches are designed for longitudinal interactions and may not be directly applicable to design research interviews, which are typically shorter. Furthermore, considering that we are using only the transcripts for this study, the 5-minute interval is not a suitable fit.
To determine the most appropriate splitting approach, we evaluated six configurations consisting of 3, 4, 5, 6, 7 and 8 utterance pairs per split. In each configuration, the transcript was segmented into consecutive units, where each unit (split) contained j designer–user utterance pairs (See Figure 2). For example, in the 3-pair configuration, each split consisted of three consecutive designer–user pairs. The overall LSM score for a transcript was then computed by averaging the LSM values across all splits, as shown in Eq. (3).

where
$ LS{M}_j $
 is calculated using Eqs. (1) and (2), and
$ \mathrm{n} $
 is the total number of splits.
The choice of split size was guided by three criteria:
-
(a) Number of data points (split-size):
For the data points, we investigated the data size of the different split approaches. For example, if the transcript is split using the 3-split-size approach (that is, each split should have three designer-user pairs), the data point is the total number of splits.
-
(b) Word count per split
Prior work suggests that LSM requires a minimum of approximately 50 words per segment to produce reliable estimates (Pennebaker, Mehl, & Niederhoffer Reference Pennebaker, Mehl and Niederhoffer2003; Tausczik & Pennebaker Reference Tausczik and Pennebaker2010; Kory-Westlund & Breazeal Reference Kory-Westlund and Breazeal2019). This is added to our selection criteria.
-
(c) Association with established LSM measures:
To assess the validity of each splitting approach, we examined the correlation between split-based LSM scores and two established LSM measures: the LSM formula for the whole transcript (Ireland & Pennebaker Reference Ireland and Pennebaker2010) as used in a previous study (Fabunmi et al. Reference Fabunmi, Halgamuge and Holtta-Otto2025) and the rLSM (Müller-Frommeyer & Kauffeld Reference Müller-Frommeyer and Kauffeld2022), which is an utterance-level adaptation of LSM.
These criteria introduce a trade-off: a smaller split size increases the number of observations but may fail to meet the minimum word count requirement, while a larger split size is more likely to satisfy the word count constraint but reduces the number of data points. Therefore, the optimal split size is the one that balances these competing constraints and correlates with the established LSM measures across the different transcripts.
To ensure robustness, this evaluation was conducted on two distinct datasets: a cooking-focused interview dataset (current study) and a driving-focused dataset Salmi et al. (Reference Salmi, Li and Holtta-Otto2023). Although the datasets differ in domain, participants and context, both were collected via Zoom, allowing for a consistent conversation condition.
Across both datasets, Figure 3 shows that smaller split sizes (e.g., 3-split-size) yielded more segments (e.g., 9–29 splits for the cooking dataset), enabling finer-grained analysis. In contrast, larger split sizes (e.g., 8-split-size) resulted in fewer segments (e.g., 3–11 splits) but higher word counts per segment. Importantly, the 4-split and 5-split size configurations provided the most balance between sufficient word count and adequate data points across both datasets. These configurations were also the smallest split sizes that consistently met the minimum word count requirement.
Cooking dataset splitting exploration: (a) Word count and (b) No. of data points (Splits).

Figure 3. Long description
Section a contains six histograms arranged in two rows of three. Each graph plots Frequency on the y-axis from 0 to 25 and No. of data points on the x-axis. The titles are 3-Split Size, 4-Split Size, 5-Split Size, 6-Split Size, 7-Split Size, and 8-Split Size. As the split size increases, the x-axis range narrows from 0 to 30 down to 0 to 15, and the distributions show multiple peaks between 5 and 25.
Section b contains six histograms arranged in three rows of two. Each graph plots Frequency on the y-axis from 0 to 200 and Word Count on the x-axis. The titles are 3-Split, 6-Split, 4-Split, 7-Split, 5-Split, and 8-Split.
* 3-Split shows a right-skewed distribution peaking around 150 words.
* 4-Split peaks around 200 words.
* 5-Split peaks around 250 words.
* 6-Split peaks around 300 words.
* 7-Split peaks around 400 words.
* 8-Split peaks around 400 words.
As the split number increases, the distributions become flatter and the x-axis range extends from 0 to 700 up to 0 to 1700 words.
Further correlational analysis revealed that the 4-split-size approach (denoted as LSM_4 in Figure 4) exhibits higher average correlations with both LSM and rLSM for the cooking and driving transcripts than the 5-split-size approach (LSM_5). Additionally, considering the intercorrelation among all split-size approaches, as shown in Figure 4 and the column chart in Figure 5, the 4-split-size approach appears to have the highest correlation and the smallest differences across interview transcripts.
Correlation analysis.

Figure 4. Long description
Two side-by-side triangular correlation matrices labeled a and b. Both use a color scale from negative 0.75 in blue to 1.00 in dark red. The y-axis lists L S M, r L S M, and L S M sub 3 through L S M sub 7. The x-axis lists r L S M and L S M sub 3 through L S M sub 8.
Panel a, Cooking Dataset. The correlations are represented by circles of varying sizes and red intensities. The highest correlation is 0.87 between L S M sub 4 and L S M sub 5. The lowest value shown is 0.12 between L S M and r L S M. Values generally increase toward the bottom-right of the triangle.
Panel b, Driving Dataset. This matrix shows generally higher and more uniform correlations compared to panel a. The highest correlation is 0.86 between L S M sub 3 and L S M sub 4. The lowest value is 0.30 between L S M and L S M sub 5. Most values in the lower half of the triangle range between 0.70 and 0.85, indicated by large, dark red circles.
Average correlation comparison between the split size approaches.

Figure 5. Long description
The Y-axis is labeled Average Correlation and ranges from 0.66 to 0.82 with increments of 0.02. The X-axis is labeled Transcript Split and contains discrete values from 3 to 8. A legend at the bottom identifies dark gray bars as the Cooking dataset and light gray bars as the Driving dataset.
* At split 3, Cooking is at 0.72 and Driving is higher at approximately 0.775.
* At split 4, Cooking rises to 0.802 and Driving rises to 0.788.
* At split 5, Cooking reaches its peak at 0.808 while Driving drops to 0.774.
* At split 6, Cooking remains high at 0.806 and Driving rises slightly to 0.777.
* At split 7, Cooking drops significantly to 0.74 while Driving is higher at 0.77.
* At split 8, Cooking is at 0.754 and Driving is slightly lower at 0.752.
Overall, the Cooking dataset shows a parabolic trend peaking at split 5, while the Driving dataset remains relatively stable between 0.75 and 0.79.
Therefore, in this study, we employed the 4-split-size approach and Eq. (3) to compute the overall LSM score. It is also important to note that we explored the use of overlapping splits during transcript segmentation. However, no significant differences were observed between the overlapping and non-overlapping approaches; as such, the non-overlapping method was retained for simplicity and consistency.
2.2.4. User’s reported openness
In this study, we also operationalised user’s expressiveness as their reported openness. Specifically, their self-reported willingness to engage with the designer or to express themselves during the interview. The users rated their openness on a Likert scale ranging from 0 to 10, in response to the prompt: ‘On a scale of 0 to 10, could you rate how well you expressed yourself in the interview?’
2.2.5. Statistical analysis
For the statistical analysis in this study, Spearman’s correlation analysis was used because the data were non-parametric. The generalised linear model (GLM) with the gamma function and a log link was used for the moderation analysis, as the data were non-parametric, skewed, continuous and positive. The bootstrapping method was used to evaluate the mediation analysis because the data is non-parametric. Krippendorff’s alpha was used to calculate the inter-rater reliability (IRR).
3. Results
3.1. User’s perceived empathic understanding (PEU) correlates with the designer’s empathic understanding (EU)
In RQ1, we investigated whether there is a relationship between the user’s PEU of the designer (PEU) (M = 4.266, SD = 0.709) and the designer’s actual EU (EU) of the user (M = 5.105, SD = 0.708). The user’s PEU scores were parametric (S-W test; p = .178), whereas the designer’s EU scores were non-parametric (S-W test; p < .001).
There was a weak, positive and significant correlation (r = 0.292, p = 0.007) between the user’s PEU and the designer’s EU (Figure 6). While this relationship is statistically significant, the coefficient of determination (r2 = .085) indicates that the user’s PEU accounts for only 8.5% of the variance in the designer’s actual EU. This suggests that while there is a relationship between the variables, the user’s perception is a limited predictor of the designer’s EU. It indicates that a designer’s actual EU is also influenced by unobserved factors. Furthermore, we employed the Linear Mixed-Effects Model (LMM) to examine the relationship between the two measures of EU while controlling for individual differences across designers. The analysis showed that the designer group effect has a low intraclass correlation coefficient (14.2%), and a significant positive correlation still exists between perceived and actual EU (r = 0.240, p = 0.027) after controlling for individual differences. This suggests that the observed relationship is not a secondary effect of designer-specific traits but is interaction-driven.
Scatterplot of the user’s PEU and the designer’s EU (empathy map (think and feel)). Confidence interval = .95.

Figure 6. Long description
The horizontal X axis is labeled User’s Perceived Empathic Understanding with values ranging from 3.0 to 5.5. The vertical Y axis is labeled Designer’s Empathic Understanding with values ranging from 3.0 to 6.0. At the top center, the text reads Spearman’s r equals 0.292.
Data points are scattered across the plot with a high concentration between 3.5 and 5.0 on the X axis and 4.0 to 6.0 on the Y axis. A solid blue linear regression line ascends from left to right, starting at approximately Y equals 4.6 and ending at Y equals 5.5. This line is surrounded by a light blue shaded area representing the 0.95 confidence interval, which widens slightly at the far left and right ends of the data range.
3.2. Empathic mental processes (verbal mimicry) indicate the user’s expressiveness
To investigate what verbal mimicry indicates during the user interview, we analysed the transcripts and their LSM scores for the different splits during the user interview. Figure 7 shows a user interview with both high and low LSM (verbal mimicry) scores during the discussion.
Example of LSM (verbal mimicry) pattern during a user interview.

To better interpret the LSM results across different sections of the interview, we examined the sections for conversational differences. We observed that segments with higher LSM scores appear to be associated with more conversational exchanges, where both dyad members contribute actively to the discussion. Specifically, when the LSM score is high, the users are more engaged during the discussion. In these instances, users tend to provide more elaborate responses, and the interaction reflects a more extended back-and-forth dialogue. In contrast, segments with lower LSM scores tend to be characterised by brief question–answer patterns with limited elaboration.
In this context, expressiveness refers to the extent to which the user provides detailed or personalised responses. These patterns are consistent with prior work suggesting that LSM reflects alignment within a dyad’s psychological world (Niederhoffer & Pennebaker Reference Niederhoffer and Pennebaker2002), although the present analysis does not directly measure psychological states or engagement. We expect that if there is harmony between the designer’s and the user’s psychological world, then the user ought to be elaborate (share personal experiences), the discussion will be highly conversational, and there is expected to be reflection on each other’s utterances (responding to a previous utterance to gain deeper insight).
To assess the generalizability of the coding scheme, a randomly selected subset comprising 5% of the overall dataset (N = 60) was independently coded by a second rater. The indicators for high and low expressiveness, along with an example of each, were provided to the raters as a guide. Transcripts were classified as high or low expressiveness based on predefined criteria, including the user’s elaboration (how well the user shares personal experiences, even without specific prompting during the interview), as well as the degree of conversational engagement (how much the user contributes to the discussion) and reflection (how well they respond to the other’s previous statement to gain more depth). IRR was assessed using Krippendorff’s alpha (nominal), yielding a value of α = 0.86, indicating strong agreement. An illustrative example is presented in Figure 8, with additional examples provided in Appendix C.
Verbal mimicry investigation using the cooking dataset transcript.

Figure 8. Long description
The figure consists of five main components.
At the center is a line graph titled L S M score on the y-axis, ranging from 0.0 to 1.0, and Split on the x-axis, ranging from 2 to 12. The blue line shows fluctuations in linguistic style matching, with peaks near split 4 and 8, and a sharp dip at split 9. Red dashed lines and circles highlight specific inflection points that correspond to the surrounding tables.
Panel a, bottom-left: A table showing a dialogue where the Designer asks about cooking habits. The User confirms they cook everyday and enjoy it, mentioning they last cooked yesterday.
Panel b, top-left: A table where the User describes preparing Oha soup using Cocoyam and Oha leaves. The User explains the process of pounding, boiling, and seasoning. The Designer asks what they enjoy most, and the User mentions Jollof rice.
Panel c, top-right: A table discussing trust in technology. The User explains they would trust a machine to signal when rice is done but not to fry tomatoes or onions, as mistakes there affect the whole meal. The Designer probes into why this part is considered the most difficult.
Panel d, bottom-right: A table where the Designer proposes a hypothetical scenario about a device that helps with all cooking tasks but breaks after a year. The User states they would not be able to repair the device.
In splits with a lower LSM score (Figure 8a and d), the interview section consists solely of questions and answers. For instance, in Figure 8a, although the designer asked exploratory questions that could have led to better user understanding (for example, how often the user cooks and whether they enjoy cooking), the user’s responses were just brief answers with little or no expressiveness. Similarly, in Figure 8d, a communication disruption (e.g., due to network issues) coincides with low LSM. The low LSM in such an event is expected because the user is unlikely to be expressive in that situation. This further supports the authenticity of the mimicry measure in revealing the dyads’ mentalisation distance (harmony or disharmony) during the user interview.
In contrast, in splits with higher LSM scores (Figure 8b and c), the user was more engaged and expressive. The user shares personalised experiences, and the section is conversational. In addition, the designer reflects on the user’s statements to engage the user more deeply, gain a deeper understanding of the experience and potentially better comprehend it. For example, in Figure 8b, the user, while describing oha (a traditional Nigerian soup), expresses themselves in detail. We also see that when the designer asks the user whether they enjoy cooking, the user responds, ‘Everything about cooking is thrilling…’, then goes on to describe the phases of cooking and explains why they enjoy it. This highlights the user’s interest in the topic and expressiveness, as they provide more details about cooking that relate to their emotions. In Figure 8c, the designer asks ‘why the user will not trust the device to fry onions and tomatoes’, following up on the previous statement of the user on trusting the cooking device when it comes to cooking rice, but not frying onions and tomatoes. We also see the designer prompting the user to use their imagination, further demonstrating a deeper level of harmony. The designer also reflects on the user’s statements, asking a follow up question in the last utterance pair, ‘So are you saying that the frying of the onions, tomatoes and preparing that, will I call it, that well textured part of your cooking is the most difficult part of your cooking because you said that if the machine can do that, then cooking will be the simplest thing. So, is that the most difficult?’
From the examples, we can see a clear difference between the discussions in different splits in the same interview. This was also shown in the LSM scores (a measure of verbal mimicry and harmony in the dyads’ psychological world) and was repeated across other interview samples.
Additionally, we investigated the correlation between LSM and the users’ reported openness and freedom to express themselves during the interview. The user’s reported openness (M = 8.233, SD = 1.155) was not normally distributed (S-W test; p < 0.001); therefore, Spearman’s correlation was used. In this analysis, the user’s reported expressiveness is treated as ordinal data. There was a weak positive correlation between the user’s reported openness and LSM (r = .285, p = .009).
3.3. Empathic mental processes, measured as verbal mimicry, do not correlate with empathic understanding
In RQ3, we further investigated whether there is a relationship between empathic mental processes, measured by verbal mimicry and EU. Specifically, the relationship between the LSM, a measure of the user’s expressiveness during the interview and the user’s PEU, as well as the designer’s actual EU, was investigated. There was neither a correlation between LSM and EU, measured as the ‘think’ and ‘feel’ sections of the empathy map (p = 0.338), nor between LSM and the user’s PEU (p = 0.353).
3.4. Empathic mental processes may moderate empathic understanding during the user interview, but not mediate
In RQ4, we investigated whether empathic mental processes (measured via verbal mimicry) play a role in the development of EU during user interviews. We employed an extreme groups design (EGD) based on LSM scores. The interviews were grouped into two: high mimicry (top 40th percentile, M = 0.781, SD = 0.022) and Low mimicry (bottom 40th percentile, M = 0.714, SD = 0.029), with an experimental effect size of Cohen’s d = 2.65. This 40% threshold was selected to maximise the contrast between the mimicry extremes while ensuring a robust sample size (n = 34 per group) for group comparisons. By excluding the middle 20% of the distribution (the centre scores), we reduced the noise inherent in moderate mimicry levels, thereby increasing the sensitivity of our analysis. Post hoc power analysis with an alpha of 0.05 indicates that the sample size provides a statistical power of 90.2% to detect a large effect (Cohen’s d = .80).
We compared the correlation between the user’s PEU and the actual designer’s EU when the mimicry is low and high. We found a significant, medium positive correlation (r = 0.44, p = 0.008) for the high mimicry group compared to the low mimicry group, which was weakly correlated but not significant (r = 0.29, p = 0.094). This is also shown in the scatter plot in Figure 9. The red circles are for the high mimicry, while the blue crosses are for the low mimicry. The correlation for the high mimicry group is stronger than that of the overall transcripts. This highlights the possible role of mental processes (mimicry) in fostering EU.
Scatter plot showing the correlation between the user’s PEU and designer’s EU between the verbal mimicry groups (High and Low LSM).

Figure 9. Long description
The x-axis represents User’s Perceived Empathic Understanding (P E U) ranging from 3.0 to 5.5. The y-axis represents Designer’s Empathic Understanding (E U) ranging from 3.5 to 6.0.
A legend in the bottom left identifies two groups:
* Group High L S M: Represented by red solid circles and a red regression line.
* Group Low L S M: Represented by blue x-shaped markers and a blue regression line.
Both groups show a positive linear correlation. The red regression line for High L S M is slightly higher and steeper than the blue line for Low L S M. Both lines are surrounded by shaded confidence interval bands.
Statistical annotations are placed near the respective trends:
* A blue label reads r = 0.29 asterisk.
* A red label reads r = 0.44.
The data points are scattered across the plot area, with a higher density of points between 4.0 and 5.5 on the x-axis.
Based on previous studies and our findings on the correlation between users’ PEU and the designer’s actual EU, we expect that a higher perception of empathy during the interview leads to greater understanding by the designer. Accordingly, we examined this expectation across the verbal mimicry groups (High LSM and Low LSM). As shown in Figure 10, we found that high mimicry was associated with about 60% (21/35) of interviews in which both variables exceeded the mean – that is, when the user’s PEU surpasses the overall user mean, the designer’s actual EU is also above its mean. Additionally, 20% (7/35) of interviews had both variables below their respective means – that is, when the user’s PEU is below the overall user mean, the designer’s actual EU is also below its mean. The remaining 20% (7/35) represented cases of non-alignment – that is, when the user’s PEU is above the mean, but the designer’s actual EU is below the mean, or vice versa.
LSM group analysis with high, low and conflicting user’s PEU and designer’s EU values.

Figure 10. Long description
The y-axis is labeled Count and ranges from 0 to 35. The x-axis contains three categories. A legend at the top right identifies blue bars as Low L S M and red bars as High L S M. Each bar is set against a light gray background extending to the top of the chart.
* Conflicting E U and User’s P E U: The Low L S M blue bar has a count of 15 with a yellow 9 in parentheses. The High L S M red bar has a count of 7 with a yellow 6 in parentheses.
* Low E U and User’s P E U: The Low L S M blue bar has a count of 10. The High L S M red bar has a count of 7.
* High E U and User’s P E U: The Low L S M blue bar has a count of 10. The High L S M red bar has a count of 21.
However, in the low mimicry group, there are more conflicting scores – about 42% (15/35). We observe more interviews in which the user PEU as high, but the actual understanding was low, or vice versa. These findings further support the idea that mimicry may influence empathy, particularly in how the user’s PEU relates to actual EU, or how the designer gains empathic insight during the user interview. It is also worth noting that there were more interviews with high users’ PEU and actual designers’ understanding in the high LSM group compared to the low LSM group. This further indicates that mental processes measured as mimicry (user’s expressiveness) may play a role in how the user perceives the designer’s empathic ability, which correlates with the actual designer’s understanding gained.
We found that a large percentage of the conflicting variables are interviews with low user’s PEU and high actual designer’s EU (See the yellow text in Figure 10). This suggests that there are other factors contributing to the high actual designer’s EU beyond the user’s PEU. When the designer has a low understanding, the user’s PEU is also mostly low, meaning that high perception will almost always lead to high EU, especially in high mimicry interviews. However, for a low user’s PEU, it may not be the case. This does not mean the designer has not gained understanding. Uncertainties like this are what design research aims to eliminate, helping to identify clear and more certain user insights.
To further investigate the role of empathic mental processes (measured as mimicry) in gaining EU during user interviews, we conducted both mediation and moderation analyses. This was to determine whether mental processes (measured as mimicry) mediate or moderate the relationship between the user’s PEU and the actual designer’s EU.
The mediation analysis is described in Table 3. For the high mimicry group, the predictor, the user’s PEU, has a significant direct effect on the outcome (the designer’s EU). However, the mediated path (indirect) using verbal mimicry (LSM) is not significant. For the low mimicry group, none of the paths is significant. This suggests that the mediation effect does not vary significantly across the groups; only the association between the variables is observed.
Mediation analysis of user’s PEU and designer’s EU using LSM across the high and low groups

Table 3. Long description
The table consists of five columns: Group, Effect type, beta (Estimate), 95% C I, and p-value.
High L S M Group:
* Total Effect: beta 0.410, 95% C I [0.160, 0.660], p-value .001.
* Direct Effect: beta 0.400, 95% C I [0.150, 0.650], p-value .002.
* Indirect Effect: beta 0.009, 95% C I [-0.024, 0.109], p-value .748.
Low L S M Group:
* Total Effect: beta 0.330, 95% C I [-0.030, 0.610], p-value .098.
* Direct Effect: beta 0.320, 95% C I [-0.040, 0.690], p-value .082.
* Indirect Effect: beta 0.011, 95% C I [-0.021, 0.145], p-value .708.
For the moderation analysis, the GLM showed a significant main effect (β = 0.0802, SE = 0.029, z = 2.81, p = .024), indicating that the user’s PEU is a predictor of the designer’s EU. This confirms that a higher user’s PEU is associated with a greater designer’s EU. However, the interaction between the user’s PEU and the group (high and low mimicry) (β = −0.0103, SE = 0.045, z = −0.23, p = .818) was not statistically significant, but it had a negative slope. This indicates that the slope in the low mimicry group is slightly weaker than that of the high mimicry group; however, the difference was not statistically significant.
Although we previously noted potential patterns in the data, it must be emphasised that the interaction term was non-significant; thus, we cannot establish a definitive moderation effect. However, a descriptive comparison shows a marginal difference in the influence of the user’s PDE on the designer’s EU for low mimicry groups (β = −0.0103, representing a 1.02% decrease). While this trend is directionally interesting, it remains statistically inconclusive. This suggests that while mimicry is a relevant factor, designers’ EU is likely influenced by a complex interplay of variables not examined in this study.
4. Discussion
In this study, we examined the correlation between a user’s perception of the designer’s EU and the designer’s EU gained through user interviews. Our findings suggest that the user’s PEU can affect the designer’s EU of the user’s thoughts and feelings during the interview. Also, empathic mental processes are a potential indicator of the user’s expressiveness during the interview, which, in turn, can help determine the likelihood that interactions will lead to EU. Figure 11 summarises the findings, with solid arrows indicating the explored constructs and dashed arrows indicating the unexplored constructs.
Summary of the study’s findings.

Figure 11. Long description
The diagram is divided into three vertical sections.
At the top, a large cloud labeled Internal constructs contains two grey boxes. The left box is Empathic Mental Processes with bullet points for Non-verbal mimicry and Verbal mimicry. The right box is Empathic Orientation.
In the middle section, a black silhouette of a User and a white silhouette of a Designer face each other. The User has a speech bubble and a circuit-pattern brain. The Designer has a speech bubble and a similar circuit-pattern brain. A vertical blue arrow points down from Empathic Mental Processes to the User side. A dashed double-headed vertical arrow connects the Internal constructs cloud to the Designer side. To the left, orange text reads Interaction Clarity (High = Certain / Low = Uncertain).
Below the silhouettes is a horizontal grey bar containing two boxes connected by a double-headed blue arrow labeled Positive but weak correlation. The left box is Empathic Understanding with a bullet for Perceived Empathic Understanding. The right box is Empathic Understanding with a bullet for Understanding the user’s thoughts and feelings.
At the bottom, under the heading External constructs, two dashed grey boxes are connected to the central bar by dashed vertical arrows. These are labeled Empathic Design Action on the left and Empathic Design Research on the right.
4.1. The user’s perception of the designer’s empathy is related to the designer’s empathic understanding of the user’s thoughts and feelings
Our study shows a statistically significant but weak relationship between PEU and the actual designer’s EU. The weak relationship and low explanatory power suggest that some relationships exist between the user’s subjective feeling of being understood during the interview and the designer’s empathy measured as EU, which is the goal of empathy in design research and practice. However, there are most likely other variables that mediate or moderate the relationship.
Our findings are similar to previous studies in other fields that show the relationship between PEU and other measures of empathy, such as physiological measures (Marci & Orr Reference Marci and Orr2006) or trait measures (Olson Reference Olson1995). Extending this to the design research, this study confirms that the user’s PEU is not an isolated subjective experience but relates to the designer’s actual understanding in some way.
However, the weak correlation warrants critical investigation. This weak correlation is similar to previous findings on perceived empathy and therapy outcomes (Watson Reference Watson2002; Elliott et al. Reference Elliott, Bohart, Watson and Greenberg2011). Elliott et al. (Reference Elliott, Bohart, Watson and Greenberg2011) explain that this weak correlation likely arises because the metrics capture different aspects of the multidimensional concept of empathy that are also related. Furthermore, this may be due to several factors, such as the complexity of human behaviour, where multiple factors, including personality, environment and culture, interact with human behaviour and vary across populations and contexts. Consequently, our findings suggest that while the user’s PEU is a valuable indicator in a design interview, it is an insufficient proxy for the designer’s actual understanding. This underscores the need to investigate unobserved moderators.
4.2. Empathic mental processes (verbal mimicry) point to the user’s expressiveness during the interview
Our findings suggest that empathic mental processes, measured as verbal mimicry (specifically, LSM), serve as an indicator of the user’s expressiveness during an interview. By analysing mimicry in the use of function words, we show that higher LSM is associated with the user’s expressiveness during the interview, and vice versa. The correlation between LSM and the user’s reported openness and freedom to express themselves further supports this relationship.
This aligns with the description of LSM by Niederhoffer & Pennebaker (Reference Niederhoffer and Pennebaker2002). They described LSM as a phenomenon in which people matching in their language styles indicate harmony in their psychological worlds. The conversation between the dyads can indicate the degree of harmony in their mental processes. Specifically, in design research, the state of the conversation is closely tied to how much of their experiences the user shares during the interview. This further corroborates Babcock, Ta, & Ickes (Reference Babcock, Ta and Ickes2014) and Niederhoffer & Pennebaker (Reference Niederhoffer and Pennebaker2002) description of LSM as an ‘engagement index’ which might occur when dyads are in ‘grip of strong emotions, rather than a direct measure of rapport’.
Within the design research context, this finding corroborates studies that describe mental processes as a proxy of an engaging conversation during the interview; however, mimicry was used to measure the dyads’ mentalisation. For example, Chang-Arana et al. (Reference Chang-Arana, Piispanen, Himberg, Surma-Aho, Alho, Sams and Hölttä-Otto2020a) reported this in their study on measuring EA in design using physiological measures. They found that when the user and the designer shared similar arousal states during the interview session (either they were relaxed or aroused together or almost together), the conversation between the user and the designer was very engaging.
These results support the early claim by Pennebaker & King (Reference Pennebaker and King1999) that ‘mimicking someone’s linguistic style shows a momentary adoption of the person’s way of thinking’. Consequently, we argue that LSM does not directly measure the rapport between the designer and the user, but rather the user’s expressiveness, how much of personal experiences the user shares during the interview, which, by extension, can affect how attuned the designer is to the user’s cognitive frame.
4.3 Empathic mental processes measured as verbal mimicry (LSM) do not correlate with any measure of empathy during the user interview
We did not find a correlation between empathic mental processes measured as verbal mimicry (LSM) and either measure of EU (perceived or actual). This lack of a relationship suggests that while verbal mimicry may relate to the user’s expressiveness, it does not serve as a direct indicator of EU.
This finding mirrors the debate over whether mental processes lead to EU, as found in previous studies investigating the relationship between empathic mental processes, such as mimicry, and EU. While studies in therapy found relationships between empathic mental processes measured as mimicry and PEU (Marci & Orr Reference Marci and Orr2006; Marci et al. Reference Marci, Ham, Moran and Orr2007), a few studies have also reported the lack of such relationships Messina et al. (Reference Messina, Palmieri, Sambin, Kleinbub, Voci and Calvo2013). Our findings align more closely with the latter, as well as with recent design research studies (Chang-Arana et al. Reference Chang-Arana, Piispanen, Himberg, Surma-Aho, Alho, Sams and Hölttä-Otto2020a; Salmi et al. Reference Salmi, Li and Holtta-Otto2023), which found no relationship between non-verbal mimicry (such as electromyographs and facial mimicry) and EA. Furthermore, our findings are consistent with studies (Fabunmi et al. Reference Fabunmi, Halgamuge and Hölttä-Otto2024b, Reference Fabunmi, Halgamuge and Holtta-Otto2025), which also showed no relationship between verbal mimicry (measured as LSM) and EA.
We posit that this discrepancy in findings could be attributed to differences in the interaction design. The studies that found a significant correlation involved real therapist-client interaction and a well-established therapeutic relationship (after 10 therapy sessions). But the study by Messina et al. (Reference Messina, Palmieri, Sambin, Kleinbub, Voci and Calvo2013), which reported no relationship, used pseudo-patients and was based on a 20-minute interview. Similarly, our study and others in design research employed brief (20- to 30-minute), one-off interactions with no prior relationship. Variations in the experimental design may have led to differences in the results. This suggests that a relationship may exist between empathic mental processes (an indicator for user expressiveness and reported openness or freedom to express themselves during an interview) and EU (specifically, PEU) following several interaction sessions. Previous studies in psychotherapy (Karvonen Reference Karvonen2017) and design research (Fabunmi et al. Reference Fabunmi, Halgamuge and Holtta-Otto2025) have also shown that mental processes increase through sections of interaction between dyads. This suggests that empathic processes may only begin to correlate with outcomes once a certain threshold is surpassed. This peak could be worth investigating in future research.
4.4 Empathic mental processes do not mediate or moderate empathic understanding during the user interview
Mentalisation has been described in neuroscience as a crucial part of empathy building. Also, studies have highlighted that empathic mental processes like synchrony and mimicry have an important role in empathy development (Marci & Orr Reference Marci and Orr2006; Kleinbub Reference Kleinbub2017). However, the role they play is not clear. In answering RQ3, we found that empathic mental processes, operationalised as verbal mimicry (LSM), do not mediate the relationship between perceived and actual EU. Furthermore, the interaction term evaluating the moderation was not significant, indicating that empathic mental processes cannot be empirically established as a moderator either. However, the directionally consistent patterns observed in the study suggest that when verbal mimicry is high, the correlation between the user’s PEU and the designer’s actual understanding is stronger. Conversely, as shown in Figure 10, lower verbal mimicry was associated with more uncertainty and conflicted relationships.
Previous studies on mental processes and empathy have also highlighted mechanisms such as synchrony and mimicry to promote harmony and connection between dyads, thereby influencing likeness, empathy and social interaction. Van Baaren et al. (Reference Van Baaren, Holland, Kawakami and Van Knippenberg2004) showed that people who were mimicked were more helpful to others compared to those who were not. They report that mimicry is not merely a consequence of likeness; rather, it results from prosocial behaviour. That is the willingness to engage in activities that benefit others. This suggests that when there is high mimicry, the user is more likely to engage with the designer during the interview, resulting in the designer better understanding the user. The expressiveness of the user will make it easier for the designer to be empathic, and this will impact how the user perceives the designer’s empathy, leading to higher user’s perception of EU and actual EU. Koole and Koole & Tschacher (Reference Koole and Tschacher2016) highlighted that patient-therapist synchrony might enhance mutual understanding and emotional experience sharing. These findings in previous literature emphasise the role of empathic mental processes as a potential indicator of the user’s expressiveness, engagement during the interview and empathic interactions.
Consequently, we see pointers suggesting that, even though empathic mental processes, operationalised as verbal mimicry, do not significantly mediate or moderate EU, our work suggests that it remains a valuable indicator and is critical for design research. The slight difference observed between the low and high mimicry interviews could be noticeable when deciding which customer insight the designer should use to make design decisions, and whether the design process will lead to a successful or unsuccessful outcome.
5. Conclusion
This study investigates the complex interplay between EU (user perception and designer understanding) and empathic mental processes, operationalised as verbal mimicry (LSM). Our findings showed a positive but weak correlation between how well the user feels they are understood and how well they are actually understood during the interview. Design research can explore the user’s PEU beyond social outcomes and treat it as a proxy for the reliability of the insights being gathered.
This study presents LSM as a metric for the user’s expressiveness during an interview. While LSM did not directly correlate with empathy measures, we found that, even though verbal mimicry does not mediate or moderate the relationship between the user’s PEU and the designer’s EU, when it is high, the relationship is stronger, with more certain high perceived and actual EU, and vice versa. Therefore, empathic mental processes (such as verbal mimicry) should be considered a baseline for empathy measures. In high-mimicry interviews, the precursor to empathy is clearer, reducing uncertainty.
For design research and practice, these findings provide additional insight into the role that empathic mental processes play in attaining EU during user interviews. Furthermore, the understanding that users’ expressiveness may facilitate EU could help designers better evaluate the likelihood of accurately gathering insights during a user interview, using the transcripts.
6. Limitations and future study
This study investigated the EU gained during a user interview, based solely on the user’s perception. Considering the multidimensional nature of empathy, it is certain that a single measure is not sufficient to measure understanding. It will be more insightful to explore a combination of methods in measuring the designer’s EU.
Also, this study investigated the correlation between verbal mimicry, measured as LSM and EU (perceived and actual). However, the study was based on a 20- to 30-minute interview, which might have affected the relationship between mimicry and EU, given findings from psychotherapy research. Future studies should investigate a longitudinal experimental design to examine its impact on empathic mental processes and EU.
Also, the study included four designers, with both designers and users from diverse cultural backgrounds. Given that each designer conducted multiple interviews, the observations possess an inherent dependency structure. While our results show that the designer-specific characteristics have a low effect in this study, the small number of designers and the varying interview counts per designer may be a limitation. Future research could investigate how designer or cultural differences affect the findings with more designers and an equal number of interviews per designer.
Furthermore, the measure of the user’s perception used in this study is questionnaire-based and may be subjective. The approach may also introduce the risk of agreement bias. Although it has been widely used for similar purposes in other disciplines, such as psychotherapy, a structured prompt was also employed to ensure objective reflection. Future research could incorporate objective outcome-based metrics to cross-verify the user’s self-reported validation. Future research could also investigate empathic mental processes by combining both verbal and non-verbal unconscious mimicry. This approach will help further prevent the inherent subjectivity in textual analysis and complement any limitations in each dimension (verbal or non-verbal).
Acknowledgements
This study would not be possible without the graduate research funding from the University of Melbourne, Australia. We would also like to thank the participating designers for their support during the data collection.
Appendix A: Interview template
(Expected Duration: 20–30 mins)
-
➢ Introduction
-
○ Hello, how are you?
-
-
➢ Discussion about cooking (warm-up discussion)
-
○ Do you cook?
-
○ How often do you cook?
-
○ What is the last food you cooked?
-
○ What kind of food do you enjoy cooking the most?
-
○ What food will you most likely cook if you are tired and hungry?
-
○ What food will you most likely cook if you are cooking for friends and family?
-
-
➢ Scenario 1 (Pain point)
-
○ Imagine you are cooking yourself in these situations, what part of cooking would you like help with?
-
○ What would you like help with the most?
-
-
➢ Scenario 2 (Human help)
-
○ Imagine you can get the help of another person while cooking, how would you like the person to help you?
-
-
➢ Scenario 3 (cooking device help)
-
○ Imagine there is a device in your kitchen that can help you while cooking, how would you like the device to help you?
-
○ What else would you like from the device apart from the help you mentioned earlier? (referring to scenario 1)
-
-
➢ Scenario 4 (How the device can be repairable)
-
○ Let us imagine you used the device for a year, and it always helped you cook tasty meals without any disappointments. Now, imagine one day the device stops working. Do you think you will repair it?
-
▪ If No, why (barriers)
-
• What would make it easy for you to repair it? (enablers)
-
-
▪ If yes, why (enablers)
-
• What will make it difficult for you to repair it? (barriers)
-
-
-
-
➢ Any other needs for the device
Thank you.
End
(Comment: The template above is a guideline for the semi-structured interview. This will help ensure that all the interviews follow the same guide, but the discussion in the interviews is not restricted to this, as the designer can follow the direction of the user’s conversation, but all interviews will remain in the scope described above.)
Appendix B: User’s perceived empathic understanding (PEU) questionnaire
Thank you for your time. This phase of the study is the EU phase. This is the first of the two tasks in this section.
Kindly rate how you feel about the following statements. The options range from +3 (strong agreement) to −3 (strong disagreement), signifying a strong feeling of agreement to a strong feeling of disagreement.
-
1. The interviewer tries to see things through my eyes.
-
2. The interviewer understands my words but not the way I feel.
-
3. The interviewer is interested in knowing what my experiences mean to me.
-
4. The interviewer nearly always knows exactly what I mean.
-
5. At times, the interviewer jumps to the conclusion that I feel more strongly or more concerned about something than I actually do.
-
6. Sometimes, the interviewer thinks that I feel a certain way because they feel that way.
-
7. The interviewer understands me.
-
8. The interviewer’s attitude towards some of the things I say or do stops the interviewer from really understanding me.
-
9. The interviewer understands what I say from a detached, objective point of view.
-
10. The interviewer appreciates what my experiences feel like to me.
-
11. The interviewer does not realise how strongly I feel about some of the things we discuss.
-
12. The interviewer responds to me mechanically.
-
13. The interviewer usually understands all of what I say.
-
14. Even when I do not clearly state what I mean, the interviewer still understands me.
-
15. The interviewer tries to understand me from their own point of view.
-
16. The interviewer can be deeply and fully aware of my most painful feelings without being distressed or burdened by them.
Appendix C: Other illustrative examples of user’s expressiveness in low and high LSM scores
Verbal mimicry investigation (Additional Example 1).

Figure C1. Long description
The figure consists of five components.
At the center is a line graph titled L S M score on the y-axis (ranging from 0.00 to 1.00) and Split on the x-axis (ranging from 0 to 16). The blue line fluctuates across the splits, with specific peaks and troughs highlighted by orange circles.
Panel a (top-left): A dialogue table where the Designer asks about Okro soup and the User explains learning to cook it to change their diet. A dashed orange arrow points from this table to a peak at Split 2 on the graph.
Panel b (bottom-left): A dialogue table regarding quick meals. The User mentions cooking noodles because they are fast. A dashed orange arrow points from this table to a trough at Split 4 on the graph.
Panel c (top-right): A dialogue table discussing cooking processes for beef, chicken, and vegetables. The User mentions washing with salt and vinegar. A dashed orange arrow points from this table to a peak at Split 10 on the graph.
Panel d (bottom-right): A dialogue table about repairing products. The User describes fixing a pot handle and a blender knot with a screwdriver. A dashed orange arrow points from this table to a trough at Split 16 on the graph.
Verbal mimicry investigation (Additional Example 2).

Figure C2. Long description
The figure consists of four dialogue panels labeled a through d and a central line graph.
Panel a (Top-Left): A transcript where the Designer asks about kitchen help. The User expresses a desire for someone to ‘gist’ with them to make cooking fun. Dashed arrows point from this panel to the first peak on the graph.
Panel b (Bottom-Left): The Designer asks if the User would use a device when not tired. The User declines, even for making melon soup. Dashed arrows link this to a trough in the graph.
Central Graph: A line graph titled Split on the x-axis (ranging 0 to 16) and L S M score on the y-axis (ranging 0.00 to 1.00). The blue line fluctuates between 0.50 and 0.90. Red circles highlight specific inflection points corresponding to the dialogue panels.
Panel c (Top-Right): A long transcript discussing trust in a cooking device. The User mentions they do not trust the device to handle proportions or stir soup without supervision. Dashed arrows connect this to the highest peak and a subsequent dip on the graph.
Panel d (Bottom-Right): The Designer asks about the motivation for using the device, mentioning heat and steam. The User agrees these are factors. A dashed arrow points to the final data point on the graph.
Verbal mimicry investigation (Additional Example 3).

Figure C3. Long description
The figure consists of five main components.
At the center is a line graph with a y-axis labeled L S M score ranging from 0.00 to 1.00 and an x-axis labeled Split ranging from 0 to 18. The blue line shows a fluctuating trend with several peaks and troughs. Four specific points on the graph are circled in red and connected by dashed red arrows to surrounding text boxes.
Panel a (Top-Left): A dialogue between a Designer and a User discussing cooking hot pot and food preferences during weekdays versus weekends.
Panel b (Bottom-Left): A dialogue where the Designer asks about quick meals when tired, and the User mentions instant noodles, vegetables, and traditional Chinese food like hot pot.
Panel c (Top-Right): A dialogue focused on device repairability. The Designer asks how a device could be made easier to repair, and the User discusses adjusting buttons or removing obstructions like oil.
Panel d (Bottom-Right): A dialogue regarding a kitchen device that helps with pre-processing. The User suggests a device that could translate your tongue rather than following a recipe.




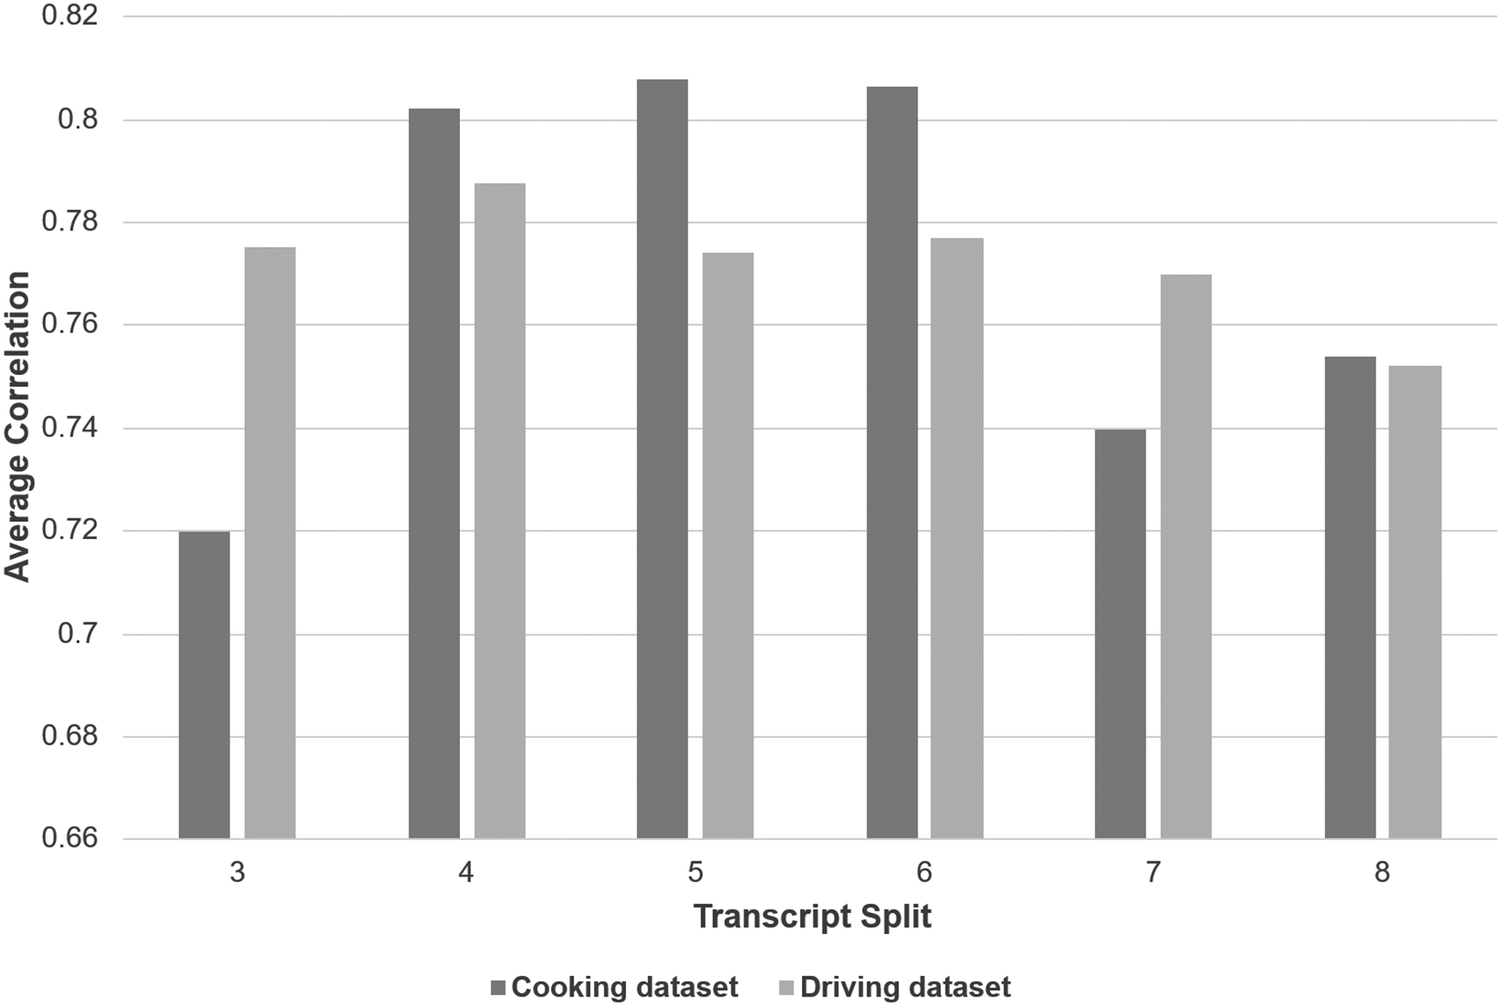

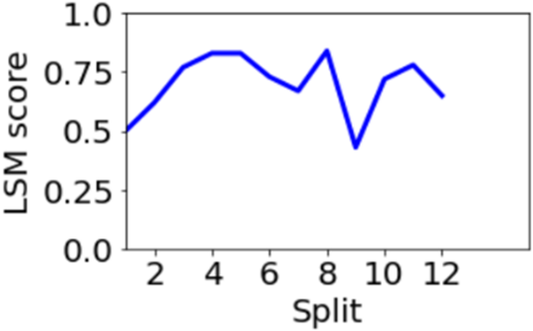


 Open access

