Introduction
Angiostrongylus costaricensis is a parasitic nematode of rodents, and terrestrial molluscs are its intermediate hosts. Sigmodon hispidus in Central America (Morera, Reference Morera1973) and Oligoryzomys nigripes in southern Brazil are considered to be the main definitive hosts of A. costaricensis (Graeff-Teixeira et al., Reference Graeff-Teixeira, Ávila-Pires, Machado, Camillo-Coura and Lenzi1990). There have been accidental infections of humans by A. costaricensis (Quirós et al., Reference Quirós, Jiménez, Bonilla, Arce, Hernández and Jiménez2011), while other types of mammals have only rarely been infected, including coati (Monge et al., Reference Monge, Arroyo and Solano1978), marmosets (Brack & Schröpel, Reference Brack and Schröpel1995) and dogs (Alfaro-Alarcón et al., Reference Alfaro-Alarcón, Veneziano and Galiero2015). The contributions of a given host to a parasite's survival represent critical information for understanding transmission dynamics, particularly prophylactic strategies for parasitosis.
Adaptation in host–parasite interactions has classically been evaluated based on indicators of morbidity or mortality. Reduced host mortality is generally assumed to be an indicator of improved adaptation, thereby reflecting either a host of low responsiveness and/or low virulence of a parasite (Ashby & Boots, Reference Ashby and Boots2015). Transmissibility of a pathogen is crucial for its maintenance in nature. A parasite must achieve a balance between virulence and infection, with death or high morbidity of a host leading to reduced dispersion (Lipsitch et al., Reference Lipsitch, Herre and Nowak1995). Garnick (Reference Garnick1992) proposed a mathematical model to evaluate the co-adaptation status of a given host–parasite system, based on daily measurements of parasitic forms that are released and that can lead to transmission (Garnick, Reference Garnick1992). In this model, the size of the area in the plot, A0, represents the sum of the transmission forms of a parasite versus time from an initial infection (Garnick, Reference Garnick1992).
Here, we applied this titre–time curve model to experimental models of A. costaricensis infections of Swiss mice, Wistar Rattus norvegicus, wild O. nigripes and a local strain of Mus musculus, in order to examine A. costaricensis–rodent interactions and their adaptations.
Materials and methods
Larvae from A. costaricensis
The ‘Santa Rosa’ strain of A. costaricensis has been maintained since 1992 by using Swiss mice and the veronicelid slug Phyllocaulis soleiformis. To obtain third-stage larvae (L3) for this study, eviscerated bodies of P. soleiformis were minced and incubated for 2 h at 37°C in a 30% pepsin (1:2500; Sigma P-7125; Sigma, St Louis, Missouri, USA)/0.7% hydrochloric acid solution. These preparations were left in Baermann funnels for 2 h and the L3 recovered were counted under a stereomicroscope and used for rodent infection.
Rodent models
Two strains of common laboratory animals were used as definitive hosts, M. musculus (Swiss mice) and R. norvegicus (Wistar rats). The O. nigripes colony, also referred to as the ‘Macegal’ strain, was established in 1987 and is maintained with eventual partial renewal of matrices from the same original site, under authorization of IBAMA (CTF 60412, Instituto Brasileiro do Meio Ambiente e dos Recursos Naturais Renováveis) (Graeff-Teixeira et al., Reference Graeff-Teixeira, Ávila-Pires, Machado, Camillo-Coura and Lenzi1990). A wild strain of M. musculus was also established in our laboratory from matrices captured in several urban areas in the southernmost Brazilian State, Rio Grande do Sul, and it is referred to as RGS. All of these animals were maintained under the same environmental conditions and received rodent food and water ad libitum.
Inoculation and collection of faeces
Groups of Swiss mice (SW), the Wistar strain of R. norvegicus (RN), O. nigripes (ON) and RGS mice (n = 11/group) were inoculated per os with 0.06 L3/g inoculum, ranging in total dose from 13 to 16 L3 (SW), 79–157 L3 (RN), 12–24 L3 (RGS) and 15 L3 (ON). For collection of faeces, rodents were kept in individual cages every morning for 2 h with a moistened paper positioned over the cage to maintain a humid environment for larvae. Faeces were subsequently transferred from each cage into Baermann funnels according to Willcox & Coura (Reference Willcox and Coura1989). Briefly, after 2 h, recovered first-stage larvae (L1) were counted under a stereomicroscope. These examinations were conducted each morning for 40 days. A0 was calculated based on the sum of L1 larvae counted from each animal during the daily observation period.
Calculation of yield ratio (YR)
YR was calculated based on the number of worms recovered at post-mortem examination divided by the dose of each L3 inoculum. Surviving animals were euthanized by carbon dioxide inhalation after 41 days, except for the ON group, which was maintained up to 565 days post-infection (pi) to examine long-term mortality. During each post-mortem examination, the aorta, heart, pulmonary arteries and mesenteric vascular system, including hepatic and splenic vessels, were examined for the presence of adult worms.
Evaluation of dispersion
To identify dispersion, a Shapiro–Wilk test of normality was applied with the shapiro.test function in the Stats package for R environment (R Core Team, 2016). To compare differences in L1 recovery among the experimental hosts, a Kruskal–Wallis multiple comparison test was applied with the kruskal.test function in the Stats package for R environment. To detect statistical differences among the groups, the dunnTest function from the FSA package (Ogle, Reference Ogle2016) for R environment was used. All of the graphics presented in the figures were created with the ggplot function in the ggplot2 package (Wickham, Reference Wickham2009) for R environment. The Local Polynomial Regression Fitting (loess) method (R Core Team, 2016) was used to fit polynomial curves to the L1 recovery data.
Results
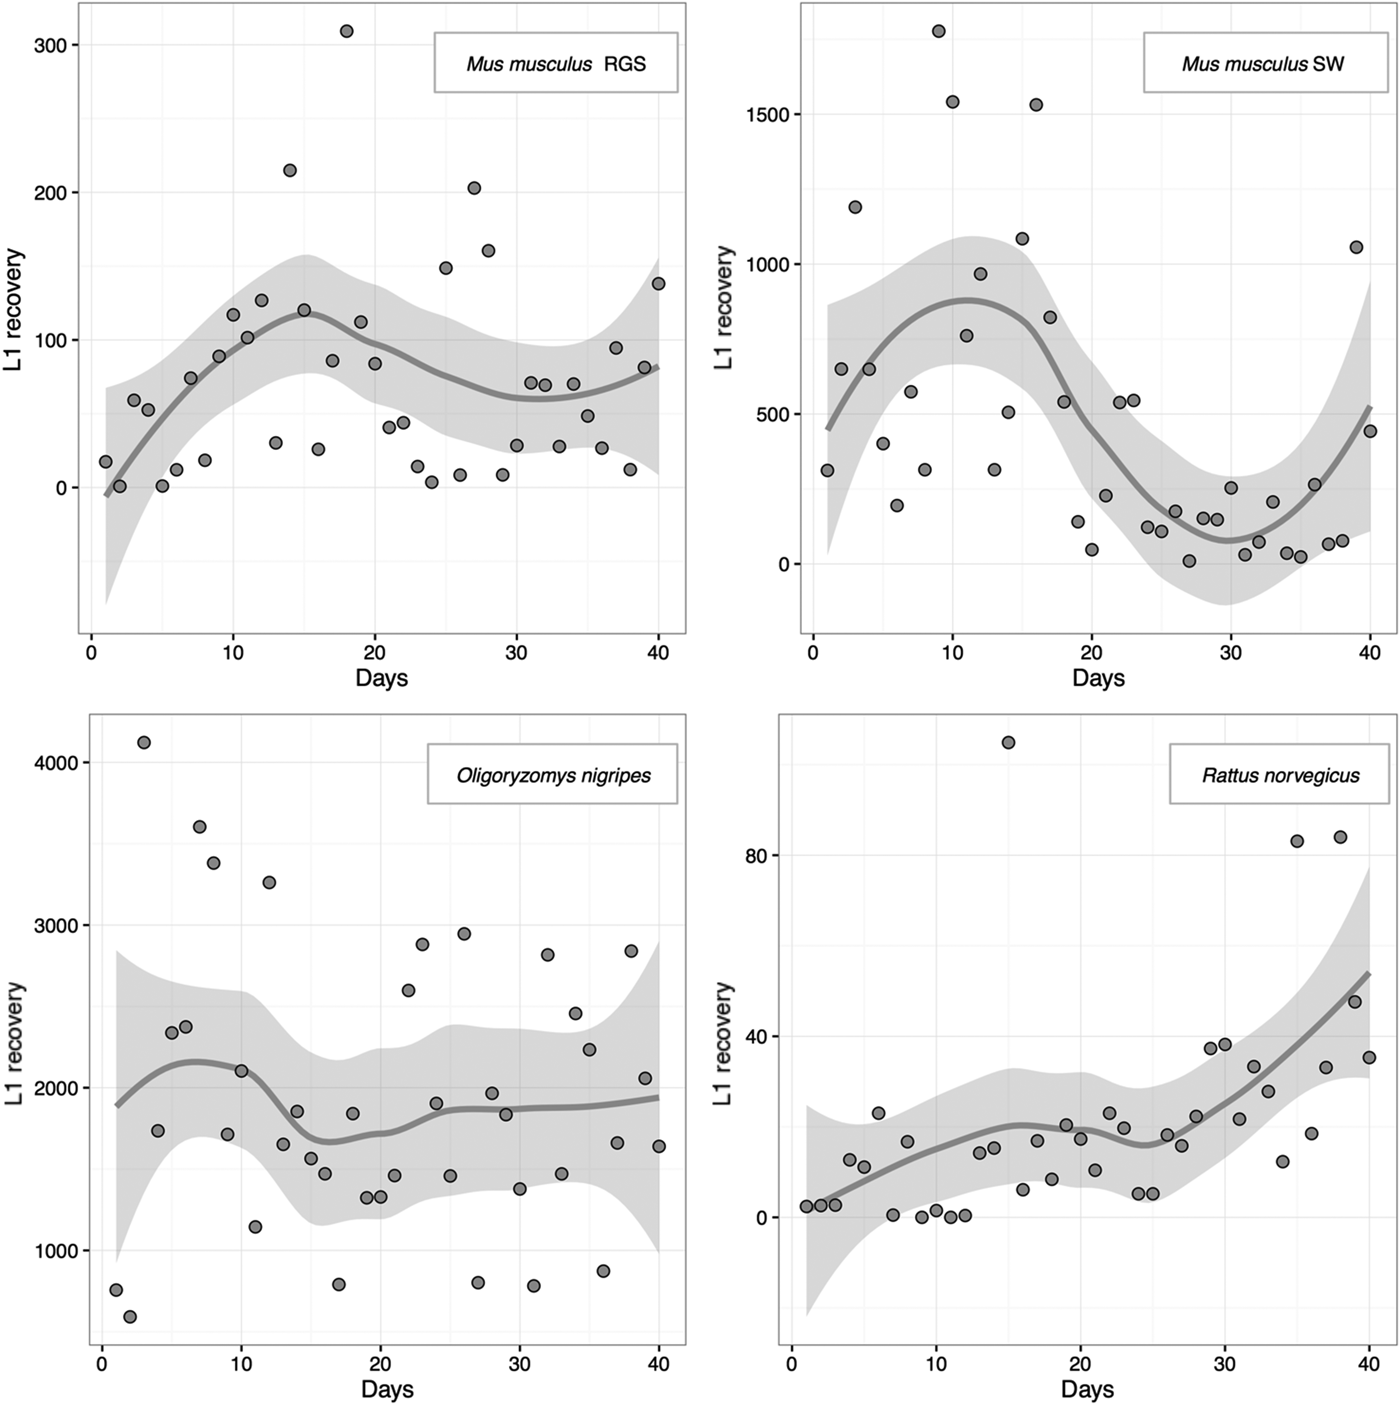
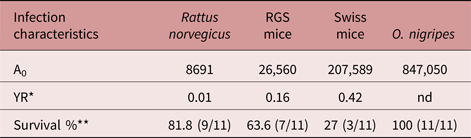
Survival data were identical for the SW, RN and ON groups up to 20 days pi. At 40 days pi, a marked decrease in survival was observed for the SW group (58%), followed by the RN group (81%). In contrast, all of the O. nigripes were alive at the end of the 40-day pi period. However, at 500 days pi (16 months), 50% of the ON group had died, while one animal (10%) survived to 595 days pi (20 months). In the RGS group, survival began to decrease at day 14 pi (91%), between day 16 and day 39 survival was stable at 79%, and then at day 40 pi the survival rate decreased to 75%. The number of L1 that were eliminated from the individual members of each group greatly varied, as demonstrated by the different curve shapes shown in fig. 1. The A0 index value for each group was 207,589 (SW), 8691 (RN), 847,050 (ON) and 26,560 (RGS).
Number of L1 eliminated from the individual members of each group against time.

The number of worms recovered from each group (expressed as YR) was 0.42 (SW), 0.01 (RN) and 0.16 (RGS) (table 1). A YR for the ON group was not calculated since the animals were not sacrificed at the end of the 40-day pi experimental period.
Experimental infection of four different hosts with A. costaricensis.

* Worms recovered at necropsy/L3 in inocula.
** Surviving animals/total number of animals in group.
nd, Not determined.
Discussion
Survival of a parasite species is achieved when a parasite is able to co-evolve with its hosts, and this depends on several variables. A key variable is the ability of a host to survive for a sufficient period of time following infection in order for a parasite to undergo reproduction and propagation of its infective forms to infect new hosts (Gandon et al., Reference Gandon, Buckling, Decaestecker and Day2008; Poulin, Reference Poulin2011). In the present study, quantification of transmission forms was used as an indicator of the co-adaptation status of A. costaricensis–rodent interactions. In this quantitative model, mortality was assessed indirectly, since a dead animal does not produce transmission forms. Conversely, a host species with a high survival rate is not necessarily ideal, since other factors may interfere with transmission of a parasite. For example, greater resistance to a parasite by a host can prevent the establishment of an infection, while a strong inflammatory response may trap transmission forms (Graeff-Teixeira et al., Reference Graeff-Teixeira, Camilo-Coura and Lenzi1991).
The present data indicate that the Wistar strain of R. norvegicus is not a well-adapted host for A. costaricensis. For example, the survival rate of the RN group was high (81%) and the transmission rate (A0 8.691) and parasite burden YR (0.01) were low (table 1). The latter two factors are crucial elements for parasite dispersion and maintenance of a species, respectively. Interestingly, however, R. norvegicus is the most important host for another medically important Angiostrongylus species, A. cantonensis, the causative agent of cerebral angiostrongyliasis (Wang et al., Reference Wang, Lai, Zhu, Chen and Lun2008). The synanthropic behaviour of R. norvegicus is probably a contributing factor to the geographic dispersion of A. cantonensis, especially given the opportunity for R. norvegicus to travel on cargo ships (Graeff-Teixeira, Reference Graeff-Teixeira2007). Similarly, the recent introduction of R. norvegicus to South America has mainly affected coastal areas in Brazil (Morassutti et al., Reference Morassutti, Thiengo, Fernandez, Sawanyawisuth and Graeff-Teixeira2014). It is possible that the low permissiveness of R. norvegicus that was observed in our A. costaricensis experimental infections is compensated by the long-term survival that was observed for the infected rats (table 1), which may contribute to the transmission of A. costaricensis in urban areas. On the Caribbean island of Guadeloupe, A. costaricensis adult worms were only detected in 14.9% of 562 rats, with an average of 4.5 worms found per rodent (Juminer et al., Reference Juminer, Borel, Mauleon, Durett-Desset, Raccurt, Roudier, Nicolas and Perez1993). In contrast with the synanthropic character of R. norvegicus, O. nigripes and S. hispidus are restricted to forests and rural areas, corresponding with the restricted occurrence observed for A. costaricensis in forest or peri-urban areas (Graeff-Teixeira et al., Reference Graeff-Teixeira, Ávila-Pires, Machado, Camillo-Coura and Lenzi1990).
A high mortality rate has been observed for M. musculus in various experimental infection models (Ishii & Sano, Reference Ishii and Sano1989; Santos et al., Reference Santos, Pinto and Graeff-Teixeira1996; Geiger et al., Reference Geiger, Graeff-Teixeira, Soboslay and Schulz-Key1999), and this rate may explain the absence of A. costaricensis in natural populations of mice. However, it has also been proposed that records of frequency and abundance of Angiostrongylus spp. should be considered in relation to the sampling effort and/or the distribution of definitive and intermediate hosts (Robles et al., Reference Robles, Kinsella, Galliari and Navone2016). In the present study, both the SW and RGS groups exhibited high rates of mortality between 18 and 21 days pi, unlike the RN and ON groups. In addition, the SW and RGS mice exhibited a sharp increase in antibody production and elimination of L1 larva in faeces at 3 weeks pi (Geiger et al., Reference Geiger, Graeff-Teixeira, Soboslay and Schulz-Key1999), which is also the time period during which worms achieve sexual maturity (Bender et al., Reference Bender, Maurer, Silva, Ben, Terraciano, Silva and Graeff-Teixeira2003). Differences in morbidity and the degree of inflammation that were observed for the various hosts examined indicate a specificity of A. costaricensis for ON, and this may be explained by factors other than genetic variation in rodent strains or humoral immune reactivity. For example, it has been shown that microbiota modifications associated with A. costaricensis infections may predispose a host to mucosal damage and septicaemia (Nobre et al., Reference Nobre, Serufo and Carvalho Odos2004).
It was observed that the daily L1 output for the species that were infected in the present study varied greatly (fig. 1), and the data were consistent with those published previously for M. musculus infections (Canali et al., Reference Canali, Goulart and Graeff-Teixeira1998). Both the SW and RGS groups had intermediate values of YR and A0, although the RGS strain had a lower number of L3 that established infection (0.16 for RGS and 0.42 for SW) and a lower sum of L1 elimination in faeces (26,560 for RGS and 207,589 for SW). In contrast, O. nigripes presented a greater adaptation to A. costaricensis, based on the large amount of L1 (A0) released in its faeces and its survival rate of 100% pi. These two factors potentially play important roles in host specificity and maintenance of this parasite in the Rio Grande do Sul State. These data also suggest that wild populations of local M. musculus are not important hosts for A. costaricensis. Rather, synanthropic rodents potentially contribute to a peridomiciliary cycle, where anthropogenic modifications favour increased populations of well-adapted intermediate hosts (e.g. veronicellid and limacid slugs) (Rambo et al., Reference Rambo, Agostini and Graeff-Teixeira1997). The present results and those reported by Juminer et al. (Reference Juminer, Borel, Mauleon, Durett-Desset, Raccurt, Roudier, Nicolas and Perez1993) also highlight the potential for humans to be infected by A. costaricensis as a result of it being sustained in urban areas.
In conclusion, the present data support the use of the titre-curve model proposed by Garnick (Reference Garnick1992). Moreover, this model provides a simple and straightforward tool for describing the co-adaptation status of hosts and parasites.
Acknowledgements
We thank Eva Medeiros for her technical support during these studies.
Financial support
Financial support was provided by the Conselho Nacional de Pesquisa e Desenvolvimento Tecnológico do Brasil (CNPq, 401904/2013-0), CAPES (Coordenação de Aperfeiçoamento de Pessoal de Nível Superior) ‘Edital 32/2010’. C.G.-T. received a CNPq PQ 1D fellowship and grants 307005/2014-3.
Conflict of interest
None.
Ethical standards
The authors assert that all procedures contributing to this work complied with the ethical standards of the relevant national and institutional guides on the care and use of laboratory animals. The animals were handled according to regulations established by the Colégio Brasileiro de Experimentação Animal (COBEA-Decree MSCNS196/96) and the protocol for this study was approved by the University Ethics Committee (CEP-PUCRS, Process number 01/96).