1. Introduction
The investigation of skin-friction generation in supersonic turbulent boundary layers holds significant importance for drag reduction control and aerodynamic performance enhancement of high-speed vehicles (Kametani Reference Kametani2017; Yao & Hussain Reference Yao and Hussain2019; Liu et al. Reference Liu, Luo, Tu, Deng, Cheng and Zhang2021a
,
Reference Liu, Luo, Wang, Tu, Deng and Zhoub
, Reference Liu, Luo, Zhou, Xie and Dong2023). Unlike laminar flow, the turbulent boundary layer exhibits regions of high/low skin friction. Extensive studies have demonstrated that coherent structures, particularly Reynolds stress ejection (Q2) and sweep (Q4) structures, serve as the direct cause of high/low skin-friction regions (Lozano-Durán et al. Reference Lozano-Durán, Flores and Jiménez2012; Jiménez Reference Jiménez2018). The Reynolds shear stress, conventionally defined as
 $-(\rho u)'v'$
in compressible flow, is typically categorised into four quadrants (Wallace Reference Wallace2015): Q1
 $({{(\rho u)}^{\prime }}\gt 0,\ {v}'\gt 0)$
, Q2
 $({{(\rho u)}^{\prime }}\lt 0,\ {v}'\gt 0)$
, Q3
 $({{(\rho u)}^{\prime }}\lt 0,\ {v}'\lt 0)$
, Q4
 $({{(\rho u)}^{\prime }}\gt 0,\ {v}'\lt 0)$
. Among these, Q2 (ejection) and Q4 (sweep) events dominate the Reynolds stress contributions, playing pivotal roles in momentum transport and turbulent kinetic energy production.
1.1. The RSS and extreme wall shear stress
In early studies (Alfredsson et al. Reference Alfredsson, Johansson, Haritonidis and Eckelmann1988; Wietrzak & Lueptow Reference Wietrzak and Lueptow1994; Brucker Reference Brucker2008), instruments such as hot-wire and hot-film sensors were commonly used to measure near-wall velocity and wall shear stress (WSS). Correlation analyses between shear stress and velocity revealed that inclined structures are associated with low-frequency signals, while yawed structures correlate with high-frequency signals (Wietrzak & Lueptow Reference Wietrzak and Lueptow1994). Subsequent research employing direct numerical simulations (DNS) performed correlation analyses in both temporal and spatial dimensions, obtaining the convection velocity of WSS fluctuations for the most energetic structures (Jeon et al. Reference Jeon, Choi, Yoo and Moin1999). Abe, Kawamura & Choi (Reference Abe, Kawamura and Choi2004) investigated the influence of large-scale and very-large-scale structures on WSS, demonstrating the effect of outer-layer structures on the inner layer.
Recent advancements have extended this single-point analysis to three-dimensional coherent structures. Through structure identification techniques such as
 $\lambda _2$
-identification (Jeong & Hussain Reference Jeong and Hussain1995) and clustering methods (Moisy & Jiménez Reference Moisy and Jiménez2004), researchers can now identify three-dimensional RSS for more systematic investigations. Specifically, ejection structures (Q2) correlate with low skin friction or extremely negative WSS (EN), and sweep structures (Q4) associate with high skin friction or extremely positive WSS (EP), and both are generated from streamwise vortices. Numerous researchers have demonstrated this classic process: Solbakken & Andersson (Reference Solbakken and Andersson2004) observed that the sweeping motion of streamwise vortices induces localised high-friction regions near their trailing tips. Through conditional averaging, Hutchins et al. (Reference Hutchins, Monty, Ganapathisubramani, Ng and Marusic2011) demonstrated that low- and high-friction events are associated with forward-inclined low- and high-speed structures, respectively, accompanied by symmetric reverse-motion patterns. Sheng, Malkiel & Katz (Reference Sheng, Malkiel and Katz2009) identified two distinct drag-inducing structures: (i) elongated structures in streamwise-normal planes evolving into counter-rotating vortex pairs associated with EN events during ejection, and (ii) single streamwise vortices generating alternating EP and EN events. Lenaers et al. (Reference Lenaers, Li, Brethouwer, Schlatter and Örlü2012) employed DNS to investigate rare backflow events and the associated negative WSS in channel flow, revealing that this phenomenon results from the presence of an intensely inclined vortex. Subsequent studies (Jiménez Reference Jiménez2018) established connections between streamwise vortices and velocity streaks, revealing multiple vortices per streak with EN events corresponding to low-speed streak interactions. Cardesa et al. (Reference Cardesa, Monty, Soria and Chong2019) differentiated EP generation by quasi-streamwise vortices from EN production via inclined vortex pairs.
Scale decomposition approaches, such as quasi-bivariate variational mode decomposition employed by Pan & Kwon (Reference Pan and Kwon2018), demonstrated EP events’ predominance and their association with large-scale Q4 motions. Hwang (Reference Hwang2013) achieved scale decomposition through a numerical experiment in which structures with
 $l_z^+ \gt 100$
were artificially removed, revealing that the influence of the removed outer structures becomes increasingly significant with increasing Reynolds number. Deck et al. (Reference Deck, Renard, Laraufie and Weiss2014) employed a spectral analysis of weighted Reynolds stresses based on wall distance and wavelength, combined with a friction decomposition method, and found that structures with streamwise wavelengths
 $\lambda _x \gt \delta$
contribute more than 60 % of the skin friction. Giovanetti, Hwang & Choi (Reference Giovanetti, Hwang and Choi2016) employ the confinement of the spanwise computational domain to isolate attached eddies of varying spanwise scales, and systematically examine their contributions to skin friction. Fei et al. (Reference Fei, Wang, Lai, Wang and Xu2024) employed conditional spatio-temporal decomposition to delineate three distinct evolutionary phases of extreme events. In addition to numerical simulation, experimental validation by Gomit (Reference Gomit2018) using combined particle image velocimetry and WSS measurements revealed enhanced Reynolds shear stress above EN events compared to EP regions. And Baidya et al. (Reference Baidya2019) experimentally confirmed logarithmic-layer coherence WSS correlations.
A series of theoretical models have been proposed to explain this phenomenon. The momentum cascade perspective proposed by Yang & Lozano-Durán (Reference Yang and Lozano-Durán2017) suggests that WSS fluctuations originate from large-scale vortices dissipating at the wall. Diaz-Daniel, Laizet & Vassilicos (Reference Diaz-Daniel, Laizet and Vassilicos2017) further linked extreme WSS to coherent structures through the Townsend–Perry attached eddy hypothesis (Perry & Chong Reference Perry and Chong1982), demonstrating correlations between filtered WSS fluctuations and velocity structure functions. Cheng et al. (Reference Cheng, Li, Lozano-Durán and Liu2020) employ a two-dimensional clustering method revealing EP–EN asymmetry in spatial organisation and dissipation rates, with logarithmic-layer vortices predominantly influencing large-scale EN events. Their subsequent work (Cheng & Fu Reference Cheng and Fu2022) established model consistency between the attached-eddy model and the inner–outer interaction model for high-Reynolds-number WSS characterisation.
In addition, Hu, Morfey & Sandham (Reference Hu, Morfey and Sandham2006) investigated the Reynolds number effect on WSS using spectral methods, revealing that its root mean square value increases with Reynolds number. Geurts, Nottebrock & Schroeder (Reference Geurts, Nottebrock and Schroeder2014) studied a turbulent boundary layer under an adverse pressure gradient, observing a reduction in both the population and intensity of near-wall high-speed streaks. While most studies focus on incompressible flows, compressible WSS research has gained momentum recently (Yu et al. Reference Yu, Dong, Guo, Tang, Yuan and Xu2024a , Reference Yu, Dong, Yuan and Xub ; Zhang et al. Reference Zhang, Song and Xia2024a ). Dong et al. (Reference Dong, Tong, Yu, Chen, Yuan and Wang2022a ) identified wall cooling effects on the scale of WSS, while Tong et al. (Reference Tong, Dong, Lai, Yuan and Li2022) quantified modal contributions to drag generation through empirical mode decomposition in supersonic turbulent boundary layers. Subsequent work (Tong Reference Tong2023) extended these analyses to supersonic curved-wall configurations. Research by Dong et al. (Reference Dong, Tong, Yu, Chen, Yuan and Wang2022b ) attributed WSS spatial distributions to streak meandering, whereas Yu et al. (Reference Yu, Liu, Fu, Tang and Yuan2022a ,Reference Yu, Liu, Fu, Tang and Yuan b ) systematically characterised compressible turbulent boundary layer fluctuations across multiple statistical metrics. Notably, Zhang et al. (Reference Zhang, Wan, Dong, Liu, Sun and Lu2023) revealed Mach-number-dependent mechanisms, with alternating positive–negative structures replacing hairpin vortices as primary WSS drivers at hypersonic conditions. Li, Fu & Xu (Reference Li, Fu and Xu2025) investigated both velocity and temperature structures in compressible turbulent channel flows, explaining the correlations between streamwise velocity and temperature fluctuations from the perspective of coherent structures.
1.2. Methodology and goals of this study
These studies collectively address a fundamental question: how to establish connections between coherent structures in the flow field and extreme wall events. Early research primarily relied on single-point statistics (e.g. quadrant analysis). For instance, instantaneous flow fields revealed that EP events typically occur beneath streamwise vortices and sweep motions, which is also confirmed by time-averaged statistics. Recent advancements in DNS techniques have enabled detailed conditional averaging using comprehensive three-dimensional instantaneous flow field data. Therefore, conditional averaging of extreme events has emerged as a key research focus, clearly revealing RSS above extreme wall events, and establishing explicit structure–event correlations. Taking Q4 structures as an example, their positive streamwise velocity fluctuations enhance the near-wall velocity gradient (
 ${\rm d}u/{\rm d}y$
), while the negative wall-normal velocity transports high-momentum fluid towards the wall, collectively amplifying the streamwise shear stress and consequently the skin friction. This demonstrates how both streamwise and wall-normal motions of Q2/Q4 structures synergistically contribute to extreme wall-friction events.
Building upon conventional conditional averaging, this study implements conditional skin-friction decomposition to quantitatively isolate and distinguish the individual contributions of streamwise versus wall-normal motions to further clarify the relevant physical mechanisms. On the other hand, this decomposition also reveals influences including viscous effects, pressure gradients and structural evolution processes. In particular, spatially developing turbulent boundary layers are dominated by streamwise main flow, turbulent structures mainly evolve in the streamwise, the streamwise motion within Q2/Q4 structures is coupled with their streamwise evolution therefore, so do their contributions to skin friction. Therefore, to decouple these effects and study the associated mechanisms, it is necessary to track the spatio-temporal development of individual structures. Structural scale effects constitute another critical research focus. Key scientific questions include: the differential impacts of large- versus small-scale structures on skin friction; the scale-dependent variations of decomposed friction components; and the distinct evolutionary patterns across different scales. Addressing these questions requires innovative approaches combining single-structure tracking with multiscale analysis to fully decouple and elucidate the underlying physical mechanisms.
To address these challenges, the present study proposes a novel methodology combining a time-resolved clustering method and conditionally averaged skin-friction decomposition. The clustering method, initially developed by Moisy & Jiménez (Reference Moisy and Jiménez2004), enables three-dimensional identification of transient RSS and determination of absolute scales. Furthermore, this method permits precise spatial localisation, with extensive studies (Lozano-Durán et al. Reference Lozano-Durán, Flores and Jiménez2012; Dong et al. Reference Diaz-Daniel, Laizet and Vassilicos2017; Jiménez Reference Jiménez2018) revealing that wall-attached RSS (
 $y^+_{\textit{min}} \lt 20$
) account for the majority of Reynolds stress contributions and high/low skin-friction generation, thus constituting our primary focus. After identifying structures in adjacent instantaneous flow fields, those structures that exhibit spatial overlap can be considered as the same structure at different time instants. By repeating this process across continuously time-resolved flow fields, the tracking of structural development and evolution is achieved (Lozano-Durán & Jiménez Reference Lozano-Durán and Jiménez2014).
Subsequently, scale-segregated conditional averaging will be performed on wall-attached RSS of different scales, followed by application of a conditionally averaged FIK-like identity to quantitatively decompose skin-friction contributions from streamwise, wall-normal motions and other effects. The original skin-friction decomposition method, known as the FIK identity and developed by Fukagata, Iwamoto & Kasagi (Reference Fukagata, Iwamoto and Kasagi2002), establishes a quantitative relationship between turbulent flow characteristics and wall skin friction through threefold wall-normal integration of the Navier–Stokes equations. Recent advancements by Wenzel, Gibis & Kloker (Reference Wenzel, Gibis and Kloker2022) and Xu, Wang & Chen (Reference Xu, Wang and Chen2022) have introduced an improved FIK-like identity based on double integration. This modified formulation offers two significant advantages over the original: the twofold-integration FIK-like identity shows superior physical clarity compared to the threefold-integration FIK identity (Fukagata et al. Reference Fukagata, Iwamoto and Kasagi2002) as it incorporates an energy measure. Furthermore, when compared to the identity derived from energy equation integration by Renard & Deck (Reference Renard and Deck2016), the momentum-equation-based FIK-like identity more accurately represents momentum transport processes mediated by RSS. While conventional global averaging approaches (Fukagata et al. Reference Fukagata, Iwamoto and Kasagi2002; Renard & Deck Reference Renard and Deck2016; Wenzel et al. Reference Wenzel, Gibis and Kloker2022; Xu et al. Reference Xu, Wang and Chen2022) fail to capture transient structure effects, Zhang et al. (Reference Zhang, Wan, Dong, Liu, Sun and Lu2023, Reference Zhang, Liu, Wan, Sun, Lu, Chen and Dong2024b ) developed an innovative conditional averaging framework. This approach applies the FIK-like identity to conditionally averaged momentum equations, using extreme WSS events as conditional centres to obtain conditionally averaged flow parameters.
Building upon these methodological advancements, the present study develops an integrated approach combining four key elements: cluster-based identification of wall-attached RSS, scale-specific conditional averaging centred on wall-attached RSS, application of the conditionally averaged FIK-like identity, and time-resolved evolution of RSS. This combined methodology enables effective isolation of multiple contributing factors to skin friction, including streamwise and wall-normal motions, structural evolution processes, and the scale-dependent effects.
The paper is structured as follows. Section 2 details the comprehensive methodology employed in this study, including DNS of supersonic flat-plate turbulent boundary layers, implementation of the time-resolved clustering method, and development of the conditionally averaged FIK-like identity. Section 3 presents the conditionally averaged flow fields and the decomposed terms of the skin friction. Analysis of the convective terms in the three spatial directions is detailed in § 4, with a focus on explaining the critical role of the momentum transfer direction – represented by convective acceleration – in the generation of high/low skin friction. Section 5 concentrates on the unsteady term reflecting structural evolution, while also exploring its coupling with the streamwise convective terms. Section 6 discusses other terms with relatively minor contributions. The conclusions are provided in § 7.
2. Methodology
2.1. Flow conditions and numerical set-up
The present investigation employs DNS to analyse a zero-pressure-gradient supersonic turbulent boundary layer. The simulation adopts characteristic normalisation using free-stream parameters (denoted by subscript
 $\infty$
), with the Mach number and Reynolds number specified as
 $ \textit{Ma}_{\infty } = 3$
and
 $\textit{Re}_{\infty }=7490$
, with mm as units respectively. Key flow variables including velocity, density, temperature and viscosity are normalised by their respective free-stream values. The wall boundary condition maintains an isothermal temperature
 $T_w$
equal to the adiabatic recovery temperature
 $T_r$
, establishing quasi-adiabatic conditions. The recovery temperature follows the conventional definition
 $T_r = T_{\infty }[1 + r(\gamma -1)\,Ma_{\infty }^2/2]$
, where
 $r=0.89$
represents the recovery factor, and
 $T_{\infty }$
denotes the free-stream temperature.
The numerical simulation solves the compressible Navier–Stokes equations within the computational domain illustrated in figure 1. The domain boundaries consist of inflow and outflow boundaries for streamwise flow development, a no-slip isothermal wall enforcing quasi-adiabatic conditions, a non-reflecting boundary, and periodic boundaries in both spanwise directions. Initialisation begins with a two-dimensional laminar boundary layer solution, which is subsequently extended to three dimensions and prescribed as the inflow condition. The inflow profile corresponds to the streamwise position
 $x = 70$
mm, characterised by momentum thickness Reynolds number
 $\textit{Re}_{\theta ,\textit{in}}=400$
and a
 $99\,\%$
velocity-based boundary layer thickness
 $\delta _{\textit{in}}=0.61$
mm.
Sketch of the computational domain and the mesh.

The numerical simulations employ the OpenCFD program to solve the compressible Navier–Stokes equations, which is extensively validated for compressible turbulence studies (Li, Fu & Ma Reference Li, Fu and Ma2010; Zhang et al. Reference Zhang, Guo, Dang and Li2022). The convective terms utilise a split flux vector formulation with upwind differencing, implemented through an adaptive hybrid scheme. This scheme dynamically selects the discretisation method based on local pressure gradients, applying the low-dissipation seventh-order upwind scheme (UD7L) in regions with weak pressure gradients, the seventh-order weighted essentially non-oscillatory scheme (WENO7) for moderate gradients, and the fifth-order WENO scheme (WENO5) in high-gradient regions. Boundary treatment incorporates virtual grid points, with WENO5 specifically enforced in near-wall regions to maintain solution fidelity. For viscous terms, a sixth-order central differencing scheme ensures accurate resolution of diffusive processes. Temporal integration advances the solution via a three-stage, third-order Runge–Kutta method, providing both numerical stability and temporal accuracy for the unsteady simulations.
The computational domain and grid parameters are summarised in table 1. The simulation employs a three-dimensional domain with dimensions
 $L_x \times L_y \times L_z = 600 \times 36 \times 18$
mm
 $^3$
, discretised using
 $N_x \times N_y \times N_z = 4722 \times 155 \times 256$
grid points. Special grid refinement is applied in the wall-normal direction to resolve boundary layer dynamics. The streamwise direction is partitioned into three distinct regions (illustrated in figure 1). The first region spans
 $490\delta _{\textit{in}}$
with
 $N_{x1}=1000$
grid points, where bypass transition from laminar to turbulent flow is induced through random blowing and suction disturbances following Pirozzoli, Grasso & Gatski (Reference Pirozzoli, Grasso and Gatski2004). The disturbance field is applied across the streamwise range
 $50\delta _{\textit{in}}$
to
 $82\delta _{\textit{in}}$
and the entire spanwise extent. The initial flow field is uniformly initialised with incoming flow conditions. The second region extends
 $410\delta _{\textit{in}}$
with
 $N_{x2}=3000$
grid points, allowing full development of turbulent flow structures. The final region covers
 $45\delta _{\textit{in}}$
with 722 grid points to enhance numerical dissipation and prevent solution divergence. These grid resolutions are consistent with established DNS standards for compressible turbulent boundary layers (Liu et al. Reference Liu, Luo, Tu, Deng, Cheng and Zhang2021a
). For statistical analysis, we focus on the fully developed flow region
 $748.4\delta _{\textit{in}}\lt x\lt 816.5\delta _{\textit{in}}$
, with detailed boundary layer parameters at the centre location provided in table 2.
Calculation domain and grid parameters:
 $\Delta x+$
,
 $\Delta y+$
and
 $\Delta z+$
represent the grid spaces in the three directions, normalised in wall units
 ${{\delta }_{\nu }}= {{{\mu }_{w}}}/{{{u}_{\tau }}}$
.

Simulation settings:
 $ \textit{Re}_{\infty }/mm$
,
 ${Re_{\tau }}= {{{\rho }_{w}}{{u}_{\tau }}{{\delta }_{99}}}/{{{\mu }_{w}}}$
and
 ${Re_{\theta }}= {{{\rho }_{e}}{{U}_{e}}\theta }/{{{\mu }_{e}}}$
are free-stream unit Reynolds number, friction Reynolds number and momentum Reynolds number, respectively. Here,
 ${{u}_{\tau }}=\sqrt { {{{\tau }_{w}}}/{{{\rho }_{w}}}}$
is the friction velocity,
 ${\tau }_{w}$
is the streamwise shear stress at the wall,
 $\delta _{99}$
is the boundary layer thickness at the location where the streamwise velocity equals
 $99\,\%$
of the incoming velocity,
 $\theta$
is the momentum thickness,
 $\delta$
is the displacement thickness, and
 $H={\delta }/{\theta }$
is the shape factor.

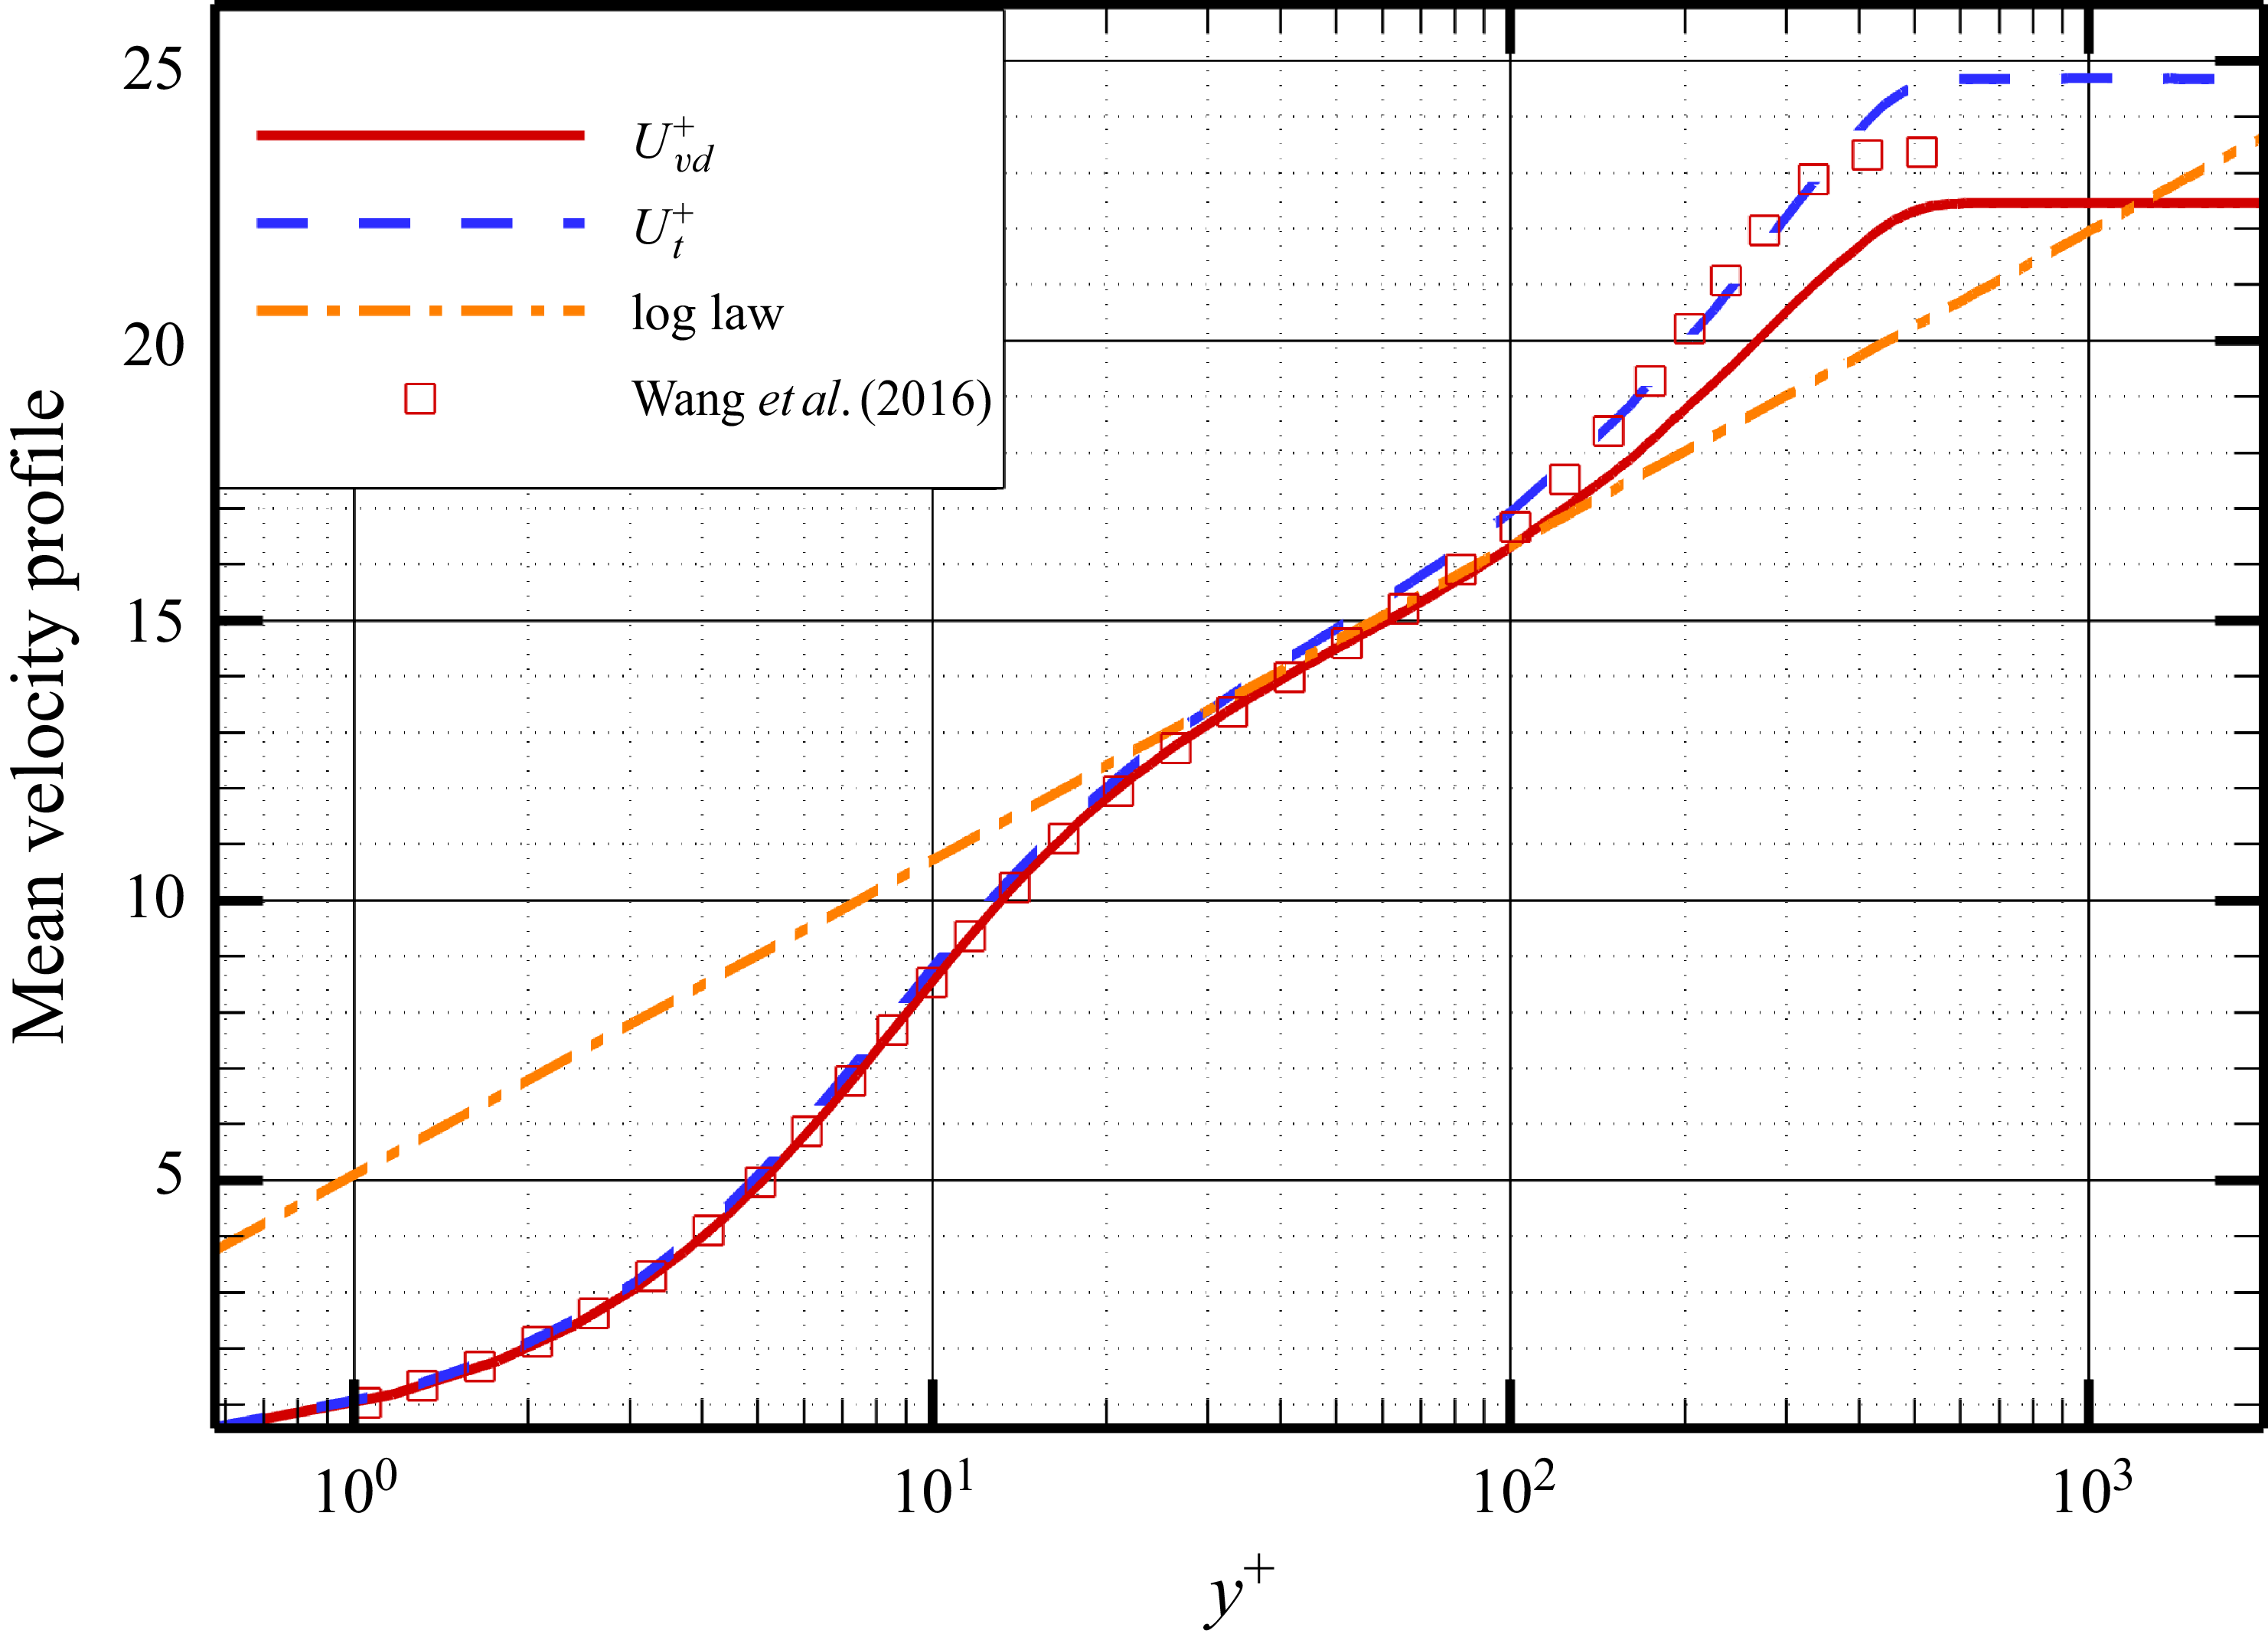
To validate the accuracy of computation, the mean velocity profile after van Driest transformation and Griffin transformation (Griffin, Fu & Moin Reference Griffin, Fu and Moin2021) is depicted in figure 2, where
 ${U}_{vd}$
is the van Driest transformation
 ${{U}_{vd}^+}=\int _{0}^{{{u}^{+}}}{(}\bar {\rho }/{{\bar {\rho }}_{w}}{{)}^{1/2}}\,\text{d}{{u}^{+}}$
, and the Griffin transformation is defined as
 \begin{align} U_{t}^{+}({{y}^{*}})=\int {S_{t}^{+}}\,{\rm d}{{y}^{*}}, \\[-28pt] \nonumber \end{align}
 \begin{align} {{y}^{*}}=\frac {y}{\nu (y)}\sqrt {\frac {{{\tau }_{w}}}{\rho (y)}}, \\[-28pt] \nonumber \end{align}
 \begin{align} S_{t}^{+}=\frac {{{\tau }^{+}}S_{\textit{eq}}^{+}}{{{\tau }^{+}}+S_{\textit{eq}}^{+}+S_{TL}^{+}}, \\[-28pt] \nonumber \end{align}
 \begin{align} S_{TL}^{+}({{y}^{*}})={{\mu }^{+}}\frac {\partial {{U}^{+}}}{\partial {{y}^{+}}}, \\[-28pt] \nonumber \end{align}
 \begin{align} S_{\textit{eq}}^{+}({{y}^{*}})=\frac {1}{{{\mu }^{+}}}\frac {\partial {{U}^{+}}}{\partial {{y}^{*}}}. \\[-2pt] \nonumber \end{align}
The mean velocity profile after van Driest transformation and Griffin transformation. The square symbols are the experimental data from Wang, Wang & Zhao (Reference Wang, Wang and Zhao2016), and the dash-dotted line is the log law
 $U_{vd}^+=\log(y^+)/0.41+5.1$
.

From figure 2, both transformations collapse well with the logarithmic law and the data from Wang et al. (Reference Wang, Wang and Zhao2016). Figure 3 shows the mean skin-friction coefficient curve, which aligns well with the theoretical formula from White (Reference White1974) in the fully developed region.
The mean skin-friction coefficient. Skin-friction coefficients are normalised by free-stream dynamic pressure, and the dashed line is the theoretical formula from White (Reference White1974).

Figure 4 shows the density-scaled turbulent intensity and Reynolds shear stress, defined as
 $ (uu )_{\textit{rms}}^+=\sqrt {\overline {\rho }/\overline {\rho }_w}\,\sqrt {\overline {u^{\prime 2}}}/u_\tau$
,
 $ (vv )_{\textit{rms}}^+=\sqrt {\overline {\rho }/\overline {\rho }_w}\,\sqrt {\overline {v^{\prime 2}}}/u_\tau$
,
 $ (ww )_{\textit{rms}}^+=\sqrt {\overline {\rho }/\overline {\rho }_w}\,\sqrt {\overline {w^{\prime 2}}}/u_\tau$
,
 $ (uv )_{\textit{rms}}^+=(\overline {\rho }/\overline {\rho }_w)\,\overline {uv}/u_\tau ^{\prime 2}$
, which exhibit great consistency with the data from Wang et al. (Reference Wang, Wang and Zhao2016). Figure 5 shows the spanwise premultiplied spectra
 $k_zE^+_{uu}$
. The spectra reach maximum at
 $\lambda _z^+\approx 100$
and
 $y^+\approx 10$
, which coincides with the spectra of Kametani (Reference Kametani2017) and Fan & Li (Reference Fan and Li2023).
The density-scaled turbulent intensity and Reynolds shear stress.

The spanwise premultiplied spectra
 $k_zE^+_{uu}$
, where
 $\lambda _z^+$
and
 $y^+$
use logarithmic coordinates.

2.2. Clustering method
The clustering method, originally developed by Moisy & Jiménez (Reference Moisy and Jiménez2004) for vortex structure identification in three-dimensional isotropic homogeneous turbulence, has been successfully adapted for RSS analysis. Subsequent applications include the work of Lozano-Durán et al. (Reference Lozano-Durán, Flores and Jiménez2012) in incompressible channel turbulence, and Dong et al. (Reference Diaz-Daniel, Laizet and Vassilicos2017) in homogeneous shear turbulence, demonstrating the method’s versatility across different flow configurations. For compressible turbulent flows, where the Reynolds shear stress is defined as
 $\tau = -(\rho u)'v'$
, the corresponding RSS are characterised as three-dimensional connected domains satisfying the condition
 \begin{align} \left | \tau \left ( x,y,z \right ) \right |\gt H\,{{\tau }_{\textit{rms}}}\left ( y \right ), \end{align}
where
 $H$
is a constant threshold, and
 ${\tau }_{\textit{rms}}$
is the root mean square of the Reynolds shear stress fluctuations. For flat-plate turbulent boundary layers,
 $\tau _{\textit{rms}}$
demonstrates wall-normal variation and is characterised as a function of wall distance, denoted as
 $\tau _{\textit{rms}}(y^+)$
. For different quadrants of Reynolds stress, the structures can be classified into four types based on the signs of
 $u'$
and
 $v'$
: Q1
 $({{(\rho u)}^{\prime }}\gt 0,\text{ }{v}'\gt 0)$
, Q2
 $({{(\rho u)}^{\prime }}\lt 0,\text{ }{v}'\gt 0)$
, Q3
 $({{(\rho u)}^{\prime }}\lt 0,\text{ }{v}'\lt 0)$
, and Q4
 $({{(\rho u)}^{\prime }}\gt 0,\text{ }{v}'\lt 0)$
. Each type of structure will be identified independently.
Reynolds stress Q4 structure in the turbulent boundary layer of a supersonic flat plate, coloured by
 $y^+$
.

The selection of threshold
 $H$
critically affects the identification of coherent structures. Excessively high thresholds yield undersized structures, while overly low thresholds produce excessively large structures, both scenarios failing to accurately capture the intrinsic properties of coherent motions. To address this problem, Moisy & Jiménez (Reference Moisy and Jiménez2004) adapted percolation theory from disordered systems and random geometry studies (Stauffer & Bunde Reference Stauffer and Bunde1987) to objectively determine the optimal threshold. This part will be discussed in detail in Appendix A. The results indicate that the threshold for both Q2 and Q4 structures can be chosen as
 $H=1$
.
Applying the determined thresholds, the clustering method effectively isolates RSS within the flow field. Figure 6 illustrates representative Q4 structures in an instantaneous flow, coloured by
 $y^+$
. These structures exhibit topological characteristics consistent with incompressible channel turbulence observations reported by Lozano-Durán & Jiménez (Reference Lozano-Durán and Jiménez2014), demonstrating the method’s robustness across different flow regimes. The anisotropies
 $a_{\textit{xy}}=l_x^+/l_y^+$
and
 $a_{zy}=l_z^+/l_y^+$
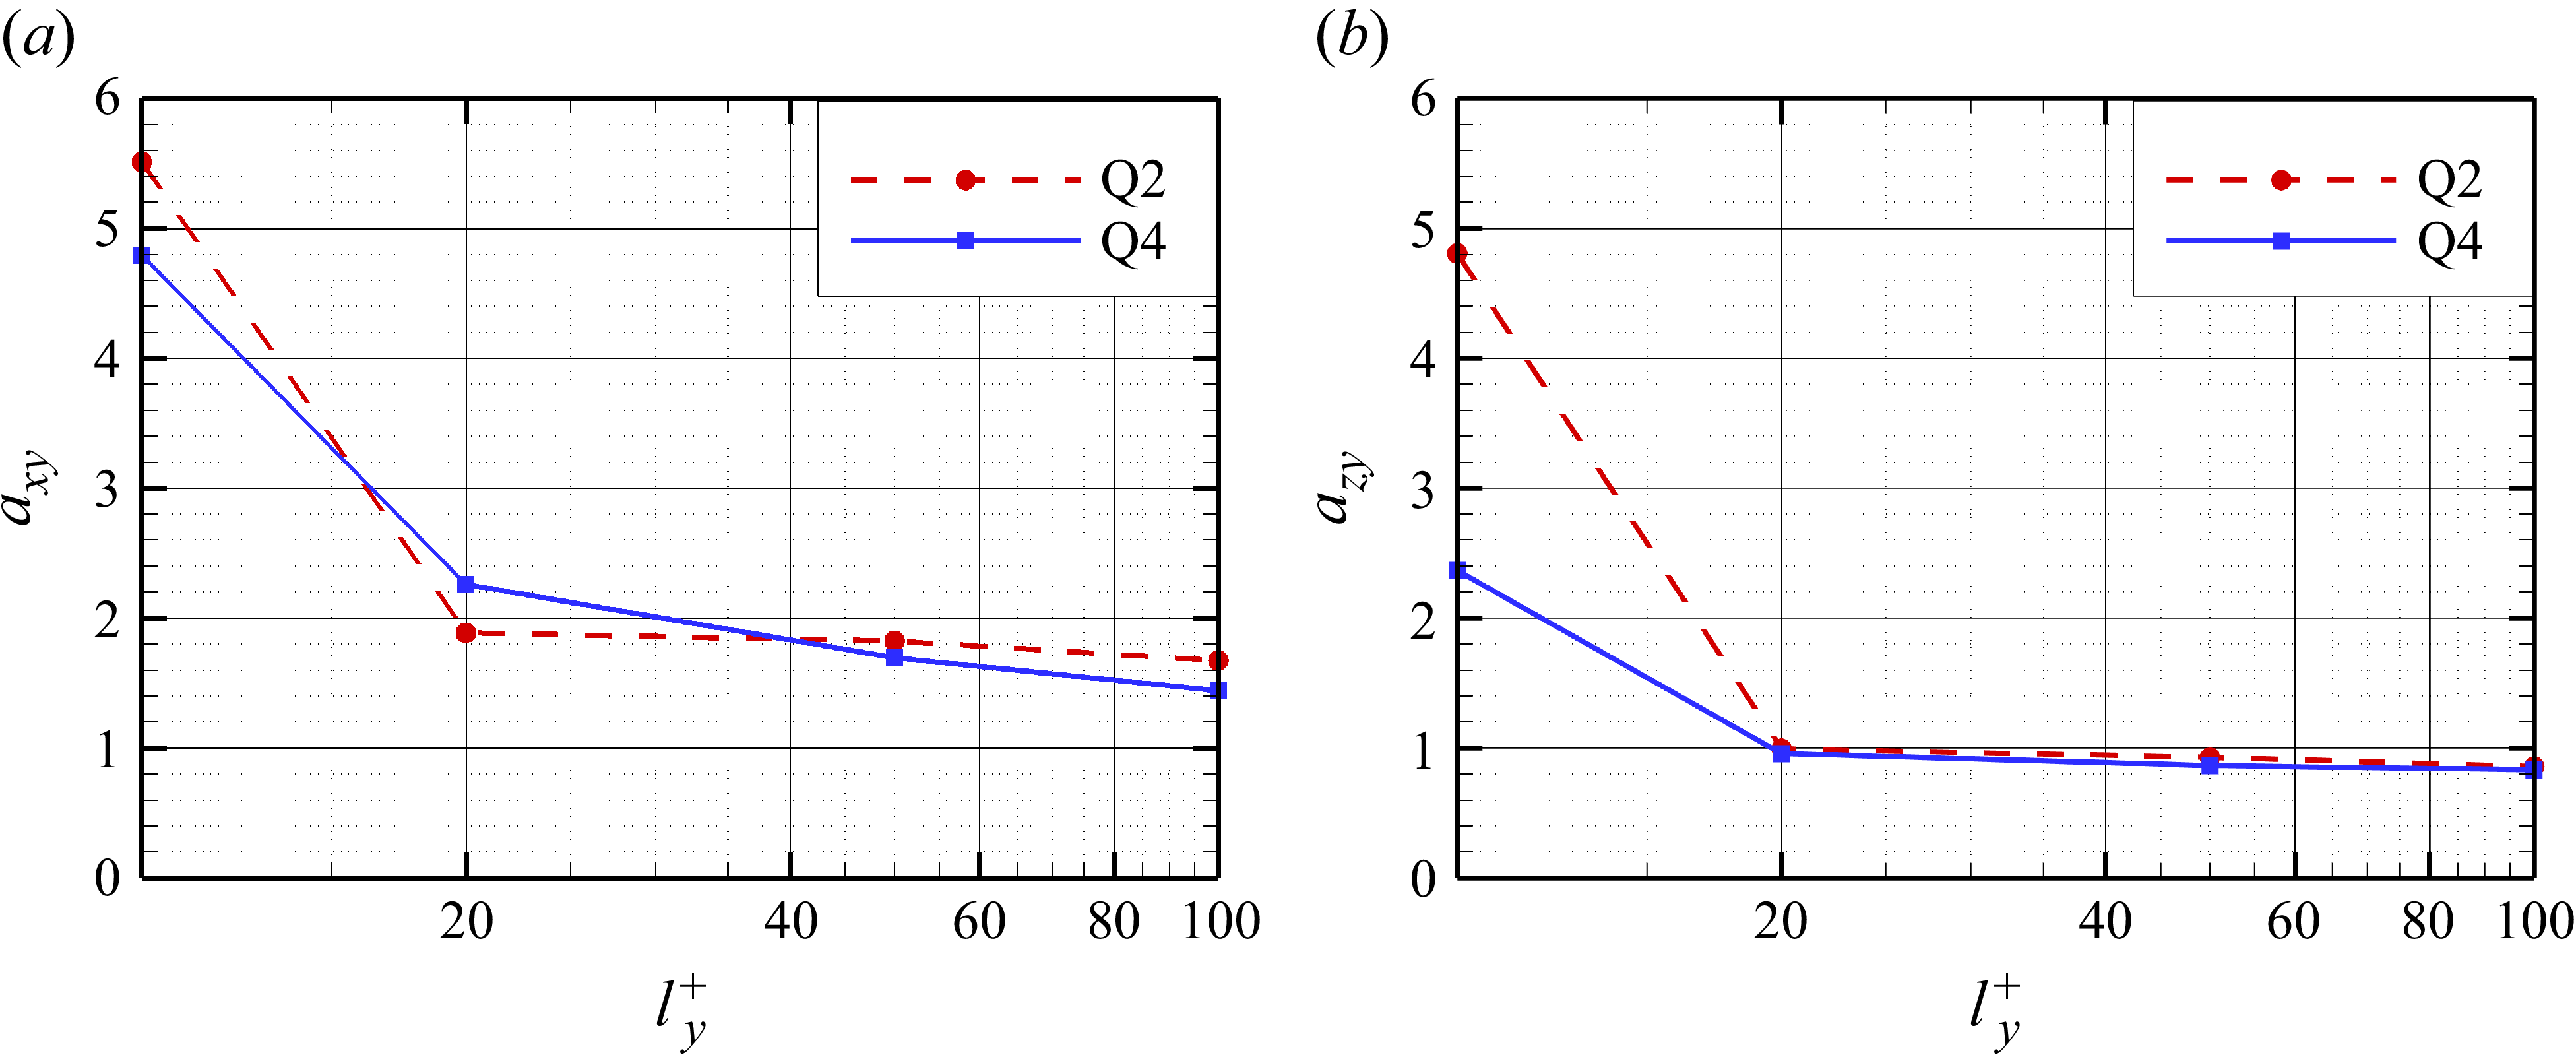
of wall-attached Q2 and Q4 with increasing wall-normal scales are shown in figure 7. For small structures near the wall, viscous effects induce pronounced streamwise elongation of Q2 and Q4 structures, forming slender shapes and larger
 $a_{\textit{xy}}$
, where
 $a_{\textit{xy}}$
gradually diminishes with increasing scales because of the weakening viscous influence and the stronger main flow. The
 $a_{\textit{xy}}$
values of the Q2 and Q4 structures are approximately identical, whereas their
 $a_{zy}$
values exhibit significant differences at small scales, with the spanwise scale of Q4 structures being smaller than that of Q2. However, as the scale increases, the
 $a_{zy}$
values of both structures converge towards unity. In the compressible channel flow studied by Li et al. (Reference Li, Fu and Xu2025), the RSS follow
 $l_x^+ \approx 25(l_y^+)^{0.7}$
and
 $l_z^+ \approx l_y^+$
. The value of
 $a_{zy}$
in the present work is consistent with theirs; however, the relationship between streamwise and wall-normal scales differs from the nonlinear correlation reported by Li et al. (Reference Li, Fu and Xu2025). This discrepancy may arise because the present study does not employ joint probability density functions to compute
 $a_{\textit{xy}}$
, relying instead on simple averaging for statistical characterisation. Nevertheless, as this is not the primary focus of our investigation, the averaged
 $a_{\textit{xy}}$
obtained here is sufficient for subsequent analysis.
Anisotropy of wall-attached Q2 and Q4 for (a)
 $a_{\textit{xy}}=l_x^+/l_y^+$
, (b)
 $a_{zy}=l_z^+/l_y^+$
, where
 $l_x^+$
,
 $l_y^+$
and
 $l_z^+$
are lengths of RSS in the streamwise, wall-normal and spanwise directions, respectively.

Following the identification of RSS in each instantaneous flow field, the overlap ratio between spatially coincident structures across consecutive time steps is computed. For a structure at time
 $t_1$
with volume
 $v_1$
, and its overlapping counterpart at
 $t_2$
with volume
 $v_2$
, the overlap ratio
 $R$
is defined as
 $R = |v_2 - v_1|/v_0$
, where
 $v_0$
represents the intersecting volume. Notably, a single structure at
 $t_1$
may overlap with multiple structures at
 $t_2$
. The minimal overlap ratio
 $R_{\textit{min}}$
identifies the primary evolutionary path, indicating structural continuity with minimal morphological change. Conversely, when multiple
 $t_1$
structures overlap with a single
 $t_2$
structure, this represents structural merging. To efficiently capture these complex evolutionary processes, we implement a directed graph (digraph) representation, where nodes represent individual turbulent structures, directed edges indicate temporal progression, node weights encode physical properties (position, scale, Reynolds stress, etc.), and edge weights store overlap ratio
 $R$
. This graph-based approach achieves significant storage compression while enabling sophisticated evolutionary analysis. For individual structure evolution studies, we focus exclusively on the primary development path corresponding to
 $R_{\textit{min}}$
, excluding splitting/merging events. Figure 8 illustrates a representative developmental sequence for a large-scale Q4 structure, revealing predominant streamwise expansion with concurrent growth in both streamwise and spanwise scales throughout its evolution.
Evolution of a large-scale Q4 structure.

2.3. Conditional skin-friction decomposition
After identification of RSS, a conditionally averaged FIK-like identity will be proposed.
Step 1. Determine the centre point and domain extent for conditional averaging. The conditional averaging procedure employs a computational domain centred on each RSS geometric centre, with dimensions selected as
 $-150\lt \Delta x^+\lt 150$
,
 $0\lt y^+\lt 250$
and
 $-80\lt \Delta z^+\lt 80$
. The wall-normal extent of the conditional averaging domain is selected such that it is greater than the logarithmic region but less than the boundary layer thickness, a height sufficient to resolve structural details. The streamwise and spanwise dimensions, on the other hand, are determined by the scale of the large-scale structures. As shown in figure 7, at
 $l_y^+ = 100$
, the
 $a_{\textit{xy}}$
and
 $a_{zy}$
values for Q2 and Q4 structures are approximately 1.5 and 0.8, respectively. This implies that their streamwise and spanwise scales are approximately 150 and 80 viscous units. To be conservative and retain more flow details, these values are multiplied by 2 to define the streamwise and spanwise lengths for conditional averaging.
Step 2. Classify the structures based on their position and scale. Based on the lowest wall-normal position
 $y^+_{\textit{min}}$
of the structure, it can generally be categorised as an attached structure (
 $y^+_{\textit{min}} \lt 20$
) or a detached structure (
 $y^+_{\textit{min}} \gt 20$
) (Lozano-Durán & Jiménez Reference Lozano-Durán and Jiménez2014; Dong et al. Reference Diaz-Daniel, Laizet and Vassilicos2017; Jiménez Reference Jiménez2018). Consistent with these prior investigations, our analysis focuses specifically on wall-attached Q2 and Q4 structures (illustrated in figure 7), but with stricter attachment criteria (
 $y^+_{\textit{min}}=0$
), as these account for the predominant share of Reynolds shear stress and play a pivotal role in generating skin-friction drag compared to wall-detached RSS. For attached structures, they are classified into four categories based on their normal scale
 $l_{y}^+=y^+_{\textit{max}}-y^+_{\textit{min}}$
:
 $l_{yi}^+ \approx 10, 20, 50, 100$
, categorised using logarithmic intervals (
 $l_{y1}^+\lt \sqrt {10\times 20}$
,
 $\sqrt {10\times 20}\lt l_{y2}^+\lt \sqrt {20\times 50}$
,
 $\sqrt {20\times 50}\lt l_{y3}^+\lt \sqrt {50\times 100}$
,
 $l_{y4}^+\gt \sqrt {50\times 100}$
). For convenience, we will abbreviate as
 $l_{y}^+ = 10$
and so on in this paper. It should be noted that since the attached structures studied subsequently all have
 $y^+_{\textit{min}} = 0$
(i.e. their lowest point is immediately adjacent to the wall),
 $l_y^+$
not only represents the wall-normal scale, but also reflects the distance between the structure’s head and the wall.
Step 3. Perform conditional averaging and skin-friction decomposition for structures of different scales. First, all Q2 structures with
 $l_y^+ = 10$
are traversed to locate their centre points. Within the statistical window surrounding each centre point, conditional averaging is performed on flow field parameters such as velocity. After obtaining the conditionally averaged flow field parameters, a conditional FIK-like identity is applied to decompose the skin friction. Subsequently, based on the spanwise and wall-normal scales of the structures, the decomposed skin-friction terms are spatially averaged. For example, for a Q2 structure with
 $l_y^+ = 10$
, we have
 $a_{\textit{xy}} = 5.5$
and
 $a_{zy} = 4.8$
, which implies
 $l_x^+ = 55$
and
 $l_z^+ = 48$
. The spatial averaging is then performed within a range
 $\pm \Delta x^+ = 27.5$
and
 $\pm \Delta z^+ = 24$
centred at
 $\Delta x^+ = 0$
,
 $\Delta z^+ = 0$
for each skin-friction term. Finally, the above procedure is repeated for Q2 and Q4 structures of different scales.
The conditionally averaged momentum equations and the FIK-like identity are
 \begin{align} \frac {\partial \bar {\rho }\tilde {u}}{\partial t}+\frac {\partial \bar {\rho }\tilde {u}{{{\tilde {u}}}_{\kern-2pt j}}}{\partial {{x}_{\kern-2pt j}}}+\frac {\partial \bar {\rho }\,{{\widetilde {{u}^{\prime\prime}{u}^{\prime\prime}}}_{j}}}{\partial {{x}_{\kern-2pt j}}}=-\frac {\partial \bar {p}}{\partial x}+\frac {\partial {{{\bar {\tau }}}_{xj}}}{\partial {{x}_{\kern-2pt j}}}, \\[-28pt] \nonumber \end{align}
 \begin{align} \begin{aligned} & {{\tau }_{xx}}=2\mu \frac {\partial u}{\partial x}-\frac {2}{3}\mu \left ( \frac {\partial u}{\partial x}+\frac {\partial v}{\partial y}+\frac {\partial w}{\partial z} \right )\!, \\& {{\tau }_{\textit{xy}}}=\mu \left ( \frac {\partial u}{\partial y}+\frac {\partial v}{\partial x} \right )\!, \\& {{\tau }_{xz}}=\mu \left ( \frac {\partial u}{\partial z}+\frac {\partial w}{\partial x} \right )\!, \\ \end{aligned} \\[0pt] \nonumber \end{align}
where
 $\overline {\phi }$
denotes the conditional Reynolds average,
 $\widetilde {\phi }$
denotes the conditional Favre average,
 $\tilde {\phi }=\overline {\rho \phi }/\overline {\rho }$
and
 ${\phi }''=\phi -\tilde {\phi }$
. Based on the above equation, the FIK-like identity is
 \begin{align} {{C}_{f}}=C_{\kern-2pt f}^{M}+C_{\kern-2pt f}^{T}+C_{\kern-2pt f}^{P}+C_{\kern-2pt f}^{B}+C_{\kern-2pt f}^{U}, \\[-28pt] \nonumber \end{align}
 \begin{align} \left \{ \begin{aligned} & C_{\kern-2pt f}^{M}=-\frac {2}{{{y}_{b}}}\int _{0}^{{{y}_{b}}}{({{y}_{b}}-y)}\left (\bar {\rho }\tilde {u} \frac {\partial \tilde {u}}{\partial x}+\bar {\rho }\tilde {v}\frac {\partial \tilde {u}}{\partial y}+\bar {\rho }\tilde {w}\frac {\partial \tilde {u}}{\partial z} \right )\text{d}y, \\ & C_{\kern-2pt f}^{T}=-\frac {2}{{{y}_{b}}}\int _{0}^{{{y}_{b}}}{\left ( {{y}_{b}}-y \right )}\left ( \frac {\partial \bar {\rho }\widetilde {{u}^{\prime\prime}{u}^{\prime\prime}}}{\partial x}+\frac {\partial \bar {\rho }\widetilde {{u}^{\prime\prime}{w}''}}{\partial z} \right )+\bar {\rho }{u}^{\prime\prime}{v}''\,\text{d}y, \\ & C_{\kern-2pt f}^{P}=-\frac {2}{{{y}_{b}}}\int _{0}^{{{y}_{b}}}{\left ( {{y}_{b}}-y \right )}\frac {\partial \bar {p}}{\partial x}\,\text{d}y, \\ & C_{\kern-2pt f}^{B}=\frac {2}{{{y}_{b}}}\int _{0}^{{{y}_{b}}}\left({\left ( {{y}_{b}}-y \right )}\left ( \frac {\partial {{{\bar {\tau }}}_{xx}}}{\partial x}+\frac {\partial {{{\bar {\tau }}}_{xz}}}{\partial z} \right )+{{{\bar {\tau }}}_{\textit{xy}}}\right)\text{d}y, \\ & C_{\kern-2pt f}^{U}=-\frac {2}{{{y}_{b}}}\int _{0}^{{{y}_{b}}}{\left ( {{y}_{b}}-y \right )}\bar {\rho }\frac {\partial \tilde {u}}{\partial t}\,\text{d}y. \\ \end{aligned} \right . \\[0pt] \nonumber \end{align}
For clarity in subsequent expressions,
 $C_{\kern-2.5pt f}$
hereafter denotes the conditionally averaged skin-friction coefficient,
 $C_{f2}$
represents the conditionally averaged skin-friction coefficient for Q2 structures, and
 $C_{f4}$
for Q4 structures. The upper integration limit
 $y_b$
is typically set to
 $y_b=1.3\delta _{99}$
in conventional applications (Wenzel et al. Reference Wenzel, Gibis and Kloker2022), where
 $\delta _{99}$
represents the boundary layer thickness. However, for wall-attached RSS with varying wall-normal scales
 $l_y^+$
, this study employs
 $y_b=l_y^+$
to better capture scale-dependent effects.
Globally averaged FIK-like identity, where
 $(C_{\kern-2.5pt f})$
is the original skin-friction coefficient:
 $(C_{\kern-2.5pt f}^{\textit{sum}})=(C_{\kern-2.5pt f}^M)+(C_{\kern-2.5pt f}^T)+(C_{\kern-2.5pt f}^B)+(C_{\kern-2.5pt f}^P)$
, and all terms are normalised by
 $(C_{\kern-2.5pt f})$
.

In the globally averaged FIK-like identity (Wenzel et al. Reference Wenzel, Gibis and Kloker2022; Xu et al. Reference Xu, Wang and Chen2022), the friction decomposition terms (denoted by
 $[C_{\kern-2pt f}]$
) maintain standard interpretations:
 $[C_{\kern-2pt f}^{M}]$
denotes the mean convection term representing main flow advection,
 $[C_{\kern-2pt f}^{T}]$
is the turbulent convection term accounting for turbulent fluctuations,
 $[C_{\kern-2pt f}^{P}]$
is the pressure gradient term, and
 $[C_{\kern-2pt f}^{B}]$
is the boundary layer term. However, when applying the conditionally averaged FIK-like identity centred on RSS, some terms acquire distinct physical interpretations that differ fundamentally from previous formulations. The term
 $C_{\kern-2.5pt f}^{\textit{Mx}} = -({2}/{y_b}) \int _0^{y_b} (y_b - y) ( \bar {\rho } \tilde {u} ({\partial \tilde {u}}/{\partial x}) )\, {\rm d}y$
reflects the influence of streamwise momentum transport by RSS during ejection/sweep events on skin friction. Similarly,
 $C_{\kern-2.5pt f}^{My} = -({2}/{y_b}) \int _0^{y_b} (y_b - y) ( \bar {\rho } \tilde {v} ({\partial \tilde {u}}/{\partial y}) )\, {\rm d}y$
and
 $C_{\kern-2.5pt f}^{Mz} = -({2}/{y_b}) \int _0^{y_b} (y_b - y) ( \bar {\rho } \tilde {w} ({\partial \tilde {u}}/{\partial z}) )\,{\rm d}y$
represent the wall-normal and spanwise momentum transports, respectively (see § 4 for details). Compared to the globally averaged drag decomposition method, the unsteady term is
 $C_{\kern-2.5pt f}^{U}\neq 0$
in conditionally averaged drag decomposition because of the evolution of structures (see § 5). Here,
 $C_{\kern-2.5pt f}^{P}$
represents the streamwise pressure variation caused by structures,
 $C_{\kern-2.5pt f}^{B}$
represents the viscous effects of boundary layer, and
 $C_{\kern-2pt f}^{T}$
reflects variations between different structures (see § 6).
To verify the code of the conditionally averaged FIK-like identity, the result of the globally averaged FIK-like identity is shown in figure 9. Similar to the results of Wenzel et al. (Reference Wenzel, Gibis and Kloker2022) and Xu et al. (Reference Xu, Wang and Chen2022), the turbulent convection term
 $[C_{\kern-2.5pt f}^T]$
dominates the skin-friction generation, followed by the mean convection term
 $[C_{\kern-2.5pt f}^M]$
and boundary layer term
 $[C_{\kern-2.5pt f}^B]$
. The minimal discrepancy (
 $\lt 2\,\%$
) between the reconstructed
 $[C_{\kern-2.5pt f}^{\textit{sum}}]$
and actual
 $[C_{\kern-2.5pt f}]$
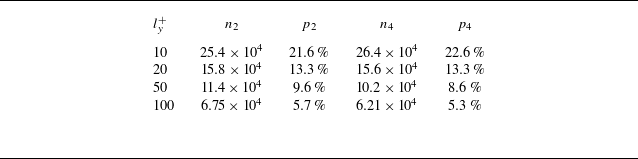
confirms the accuracy. Table 3 summarises the statistic of conditional averaging. The statistical results of table 3 demonstrate robust dataset characteristics: small-scale Q2/Q4 structures constitute approximately 70 % of the population, and all scale categories contain over
 $10^4$
samples, ensuring the statistical convergence of conditional averaging. This thorough validation establishes the reliability of our methodology for subsequent scale-dependent analysis of turbulent structures.
Statistics of conditional average:
 $n_2$
and
 $p_2$
are the entire number and the percentage of Q2 structures of different scales, and similarly for Q4.

3. Conditionally averaged skin friction and the decomposition
This section begins by presenting the conditionally averaged skin-friction coefficient contours, followed by a detailed decomposition analysis to uncover the mechanism of high/low skin-friction generation and their scale-dependent variations. Figure 10 displays the conditionally averaged skin-friction coefficients for Q2 and Q4 structures at different scales. The Q2 structures consistently produce low skin-friction regions directly beneath them, while Q4 structures generate high-friction zones. Notably, the low-friction regions under Q2 structures are flanked by alternating high-friction strips in the spanwise direction, with the inverse pattern observed for Q4 structures. This characteristic alternating distribution arises from the natural spanwise arrangement of Q2 and Q4 structures in turbulent boundary layers.
As the wall-normal scale increases, the spatial extent of high/low skin-friction regions generated by these structures undergoes significant expansion. The initially localised spot-like patterns at
 $l_y^+ = 10$
progressively evolve into well-defined streak-like formations with increasing scale. Typically, Q2 structures reside within low-speed streaks, while Q4 structures are associated with high-speed streaks. The premultiplied spectra in figure 5 reveal the presence of large-scale structures with
 $\lambda _z^+ \gt 500$
, i.e.
 $l_z^+ \gt \delta$
, which may correspond to the streak structures related to Q2 and Q4 events. For a brief introduction, the graph maximum of Reynolds stress and skin friction as functions of
 $l_y^+$
are shown in figure 11. For both Q2 and Q4 structures, peak Reynolds stress magnitudes exhibit scale-dependent growth, reaching maxima in the central logarithmic region (
 $l_y^+ \approx 50$
). The low skin friction beneath Q2 structures demonstrates monotonic enhancement with increasing scale. Conversely, Q4-related skin-friction maxima attain peak values at
 $l_y^+ = 20$
followed by gradual attenuation – behaviour contrasting with conventional understanding where intensified sweep/ejection motions from larger structures would theoretically amplify high-friction events.
Conditionally averaged skin-friction coefficients for Q2 and Q4 structures with different wall-normal scales.


To isolate the influence of factors such as the streamwise and wall-normal motion of RSS on skin friction, figure 12 presents conditionally averaged skin-friction decomposition diagrams for RSS with varying wall-normal scales. The curves of six primary terms (
 $C_{\kern-2.5pt f}^{\textit{Mx}}$
,
 $C_{\kern-2.5pt f}^{My}$
,
 $C_{\kern-2.5pt f}^{Mz}$
,
 $C_{\kern-2.5pt f}^U$
,
 $C_{\kern-2.5pt f}^P$
and
 $C_{\kern-2.5pt f}^B$
) as functions of the wall-normal scale are plotted to facilitate comparative analysis of their development trends, as shown in figure 13.
It is generally accepted that the wall-normal motion of RSS is the primary mechanism responsible for generating high/low skin-friction. The results of the present skin-friction decomposition corroborate this view: across most scales, the absolute value of
 $C_{\kern-2.5pt f}^{My}$
is the largest among all contributing components. The
 $C_{f2}^{My}$
value of the Q2 structure decreases with increasing scale, exhibiting an increasingly significant inhibitory effect on skin friction. This is because the
 $C_{f2}^{My}$
term is directly proportional to the negative wall-normal velocity. A larger
 $l_y^+$
corresponds to more intense ejection motions and greater wall-normal velocities in Q2 structures. In contrast, the
 $C_{f4}^{My}$
behaviour of Q4 structures is opposite to that of Q2. Besides the wall-normal motion, the streamwise motion of the structures also contributes to the generation of high/low skin friction. When
 $l_y^+=10$
, Q2 structures exhibit nearly equal magnitudes of
 $C_{f2}^{\textit{Mx}}$
and
 $C_{f2}^{My}$
, both contributing negatively to skin friction. Meanwhile, Q4 structures demonstrate greater
 $C_{f4}^{My}$
than
 $C_{f4}^{\textit{Mx}}$
, with both terms exerting positive effects on friction. These observations align with established understanding that Q2 ejections generate low friction, while Q4 sweeps produce high friction. Notably, a sign reversal occurs in
 $C_{\kern-2.5pt f}^{\textit{Mx}}$
for both Q2 and Q4 structures when
 $l_y^+\geqslant 20$
. For large-scale Q2 structures, the positive sign of
 $C_{f2}^{\textit{Mx}}$
indicates that the streamwise motion actually counteracts the friction reduction induced by ejection motions. Similarly, large-scale Q4 structures show
 $C_{f4}^{\textit{Mx}}\lt 0$
, demonstrating that their streamwise motions mitigate the friction enhancement from sweep motions. The spanwise motion of the structures is reflected in the
 $C_{\kern-2.5pt f}^{Mz}$
term. Regardless of scale,
 $C_{f2}^{Mz}\gt 0$
and
 $C_{f4}^{Mz}\lt 0$
, both acting to attenuate the skin friction induced by wall-normal motion. For both types of structures,
 $C_{\kern-2.5pt f}^{Mz}$
reaches its maximum magnitude at
 $l_y^+ = 20$
, and subsequently decreases as the scale increases. A detailed interpretation of
 $C_{\kern-2.5pt f}^{\textit{Mx}}$
,
 $C_{\kern-2.5pt f}^{My}$
and
 $C_{\kern-2.5pt f}^{Mz}$
will be presented in § 4.
Conditional friction decomposition diagrams for RSS with varying wall-normal scales. The integration upper limit
 $y_b$
corresponds to each structure’s wall-normal scale, with all terms normalised by local conditionally averaged skin-friction coefficients.

Notably,
 $C_{\kern-2.5pt f}^{U}$
exhibits complementary behaviour to
 $C_{\kern-2.5pt f}^{\textit{Mx}}$
; this phenomenon arises from the coupling between internal streamwise motions and streamwise evolution of structures in spatially developing turbulent boundary layers. When the structural evolution time scale is significantly smaller than the characteristic flow time scale (i.e. when the advective velocity of structures approaches the mainstream velocity,
 $u_c=\tilde {u}$
), the Taylor’s frozen-flow hypothesis becomes approximately valid:
 $\partial \tilde {u}/\partial t=-u_c\,\partial \tilde {u}/\partial x$
. As is evident from (2.10), under Taylor’s hypothesis,
 $C_{\kern-2.5pt f}^{\textit{Mx}}$
and
 $C_{\kern-2.5pt f}^{U}$
exhibit equal magnitude but opposite signs, indicating their cancelling effects on skin friction. However, our results reveal that while these terms remain oppositely signed, their sum does not vanish. Furthermore, with increasing scale,
 $C_{\kern-2.5pt f}^{U}$
undergoes sign reversal similar to
 $C_{\kern-2.5pt f}^{\textit{Mx}}$
, demonstrating scale-dependent characteristics in structural evolution dynamics. This correlation between structural scale and evolutionary behaviour suggests that the sign reversal mechanism of
 $C_{\kern-2.5pt f}^{U}$
may provide physical insight into understanding
 $C_{\kern-2.5pt f}^{\textit{Mx}}$
anomalies. A detailed discussion of these findings and their implications will be presented in § 5.
The other three terms with minor contributions (
 $C_{\kern-2.5pt f}^P$
,
 $C_{\kern-2.5pt f}^B$
and
 $C_{\kern-2.5pt f}^T$
) will be discussed in § 6.
Dominant friction components (
 $C_{\kern-2.5pt f}^{\textit{Mx}}/10$
,
 $C_{\kern-2.5pt f}^{My}/10$
,
 $C_{\kern-2.5pt f}^{Mz}/10$
,
 $C_{\kern-2.5pt f}^{U}/10$
,
 $C_{\kern-2.5pt f}^{P}$
,
 $C_{\kern-2.5pt f}^{B}$
) versus wall-normal scale
 $l_y^+$
. The terms
 $C_{\kern-2.5pt f}^{\textit{Mx}}$
and so on are divided by 10 for uniform order of magnitude.

Conditionally averaged normal velocity fields for Q2 and Q4 structures with different wall-normal scales. The velocities are normalised by friction velocity
 $u_\tau$
.

4. Term
 $C_{\kern-2.5pt f}^{M}$
and the convection of structures

4.1. Term
$C_{\kern-2.5pt f}^{My}$
and the wall-normal motion

This section provides a detailed analysis and interpretation of the variation of
 $C_{\kern-2.5pt f}^{\textit{Mx}}$
,
 $C_{\kern-2.5pt f}^{My}$
and
 $C_{\kern-2.5pt f}^{Mz}$
with scale. First, the dominant term
 $C_{\kern-2.5pt f}^{My}$
is examined. From (2.10), it can be seen that
 $C_{\kern-2.5pt f}^{My}$
is directly proportional to the negative normal velocity. Clear normal velocity counters will help to clarify the variation trend of
 $C_{\kern-2.5pt f}^{My}$
with the increase in scale, as shown in figure 14. For Q2 structures across all scales, the wall-normal velocity at their cores is positive, exhibiting distinct ejection motion accompanied by counter-rotating streamwise vortices, which is similar to the velocity field in Li et al. (Reference Li, Fu and Xu2025). Corresponding wall regions demonstrate localised skin-friction minima as shown in figure 10. Three characteristic trends emerge with increasing wall-normal scale: the normal velocity magnitude shows significant enhancement, the spatial extent of positive wall-normal velocity regions expands substantially, and both ejection motion intensity and streamwise vortex rotation strengthen markedly. In contrast to Q2 structures, figure 14 reveals inverse characteristics for Q4 configurations. The wall-normal velocity field exhibits pronounced sweep motion at structural cores, accompanied by counter-rotating streamwise vortices. In summary, the significant increase in the absolute value of
 $C_{\kern-2.5pt f}^{My}$
for Q2/Q4 structures with growing scale primarily stems from enhanced wall-normal ejection/sweep motions.
A comparison with the conditionally averaged wall-normal velocity fields in the low-speed flow studied by Pan & Kwon (Reference Pan and Kwon2018) reveals that the large-scale Q2 and Q4 structures in the present study exhibit stronger wall-normal velocity intensities and more concentrated regions of influence, as shown in figures 14(g,h). Furthermore, compared to the incompressible flow study by Lozano-Durán et al. (Reference Lozano-Durán, Flores and Jiménez2012), where
 $a_{\textit{xy}} \approx 3$
for large-scale attached structures, the present supersonic flow exhibits
 $a_{\textit{xy}} \approx 2$
(figure 7), indicating that the structural motions are more concentrated in the wall-normal direction relative to the streamwise direction. This difference may be one of the reasons for the distinct skin-friction production mechanisms observed in compressible turbulence. Although
 $C_{\kern-2.5pt f}^{My}$
was not computed in prior studies, it can be inferred that in the present supersonic flow, the more intense wall-normal motions associated with Q2 and Q4 events likely lead to a greater relative contribution of wall-normal momentum transport to the skin friction, especially for large-scale structures.
Under the influence of the streamwise vortices, the Q2 and Q4 structures alternate in the spanwise direction, which is also the reason for the corresponding friction regions to be arranged alternately spanwise. Although the bilateral symmetry represents non-physical artefacts arising from single-condition averaging procedures, the fundamental spanwise organisation of RSS and friction patterns has been established through previous investigations (Sheng et al. Reference Sheng, Malkiel and Katz2009; Guerrero, Lambert & Chin Reference Guerrero, Lambert and Chin2020).
4.2. Terms
$C_{\kern-2.5pt f}^{\textit{Mx}}$
,
$C_{\kern-2.5pt f}^{Mz}$
and the momentum transport


This subsection aims to provide an in-depth analysis of the flow mechanisms underlying the
 $C_{\kern-2.5pt f}^{\textit{Mx}}$
and
 $C_{\kern-2.5pt f}^{Mz}$
terms from the perspective of momentum transport, utilising three-dimensional flow fields and vortex structures. From the vortex structures at
 $l_y^+ = 10$
(figures 15
a,b), it can be observed that the wall-normal scales of the hairpin-like vortex structures inducing Q2 and Q4 events are significantly larger than those of the RSS themselves. Because of the streamwise vortices and the viscosity, the ejected/swept structures are elongated streamwise, which is also demonstrated by the large anisotropy (
 $a_{\textit{xy}}$
) at
 $l_y^+ = 10$
in figure 7. Consider small-scale Q2 structures as illustrated in figures 15(a,c). When ejection motions form on the upward side of streamwise vortices, the streamwise velocity decelerates, creating an upstream blue region (1) where
 ${\rm d}\widetilde {u}/{\rm d}x \lt 0$
. However, due to streamwise stretching of small-scale Q2 structures and their limited capacity to resist mainstream flow, the streamwise velocity tends to recover towards the free-stream value in the central region, resulting in
 ${\rm d}\widetilde {u}/{\rm d}x \gt 0$
(red region (2)). Consequently,
 $C_{f2}^{\textit{Mx}}$
, which is proportional to
 $-{\rm d}\widetilde {u}/{\rm d}x$
, becomes negative. Combined with the streamwise extension of small-scale structures, this indicates that the accelerating motion dominates deceleration within the structure’s entire region of influence. As shown in (2.10), when the convective acceleration of the structure is
 $\widetilde {u}\, {\rm d}\widetilde {u}/{\rm d}x \gt 0$
, the presence of the negative sign leads to
 $C_{f2}^{\textit{Mx}} \lt 0$
. This implies that momentum, which would otherwise contribute to shear stress at the wall, is transferred into the flow field to facilitate the acceleration of the structure, thereby reducing the skin friction.
For larger scales (figures 15
e,g), where
 $a_{\textit{xy}}$
remains small (figure 7), the Q2 structures experience less streamwise stretching. The more substantial ejection motions effectively reduce streamwise velocity, maintaining
 ${\rm d}\widetilde {u}/{\rm d}x \lt 0$
from the structure’s leading edge through its centre.
Conditionally averaged flow fields for Q2 and Q4 structures with different wall-normal scales. The vortices displayed by the isosurfaces of the Q-criterion are flooded by
 ${\omega }_{x}$
, and the
 $x{-}y$
plane at
 $\Delta {{z}^{+}}=0$
and the
 $y{-}z$
plane at
 $\Delta {{x}^{+}}=0$
are shifted aside for better observation, where the contours are
 ${(\partial u/\partial x)}^{+}$
and
 ${(\partial p/\partial x)}^{+}$
, respectively.

Taking into account the streamwise scale of the structure, this results in a streamwise-averaged
 $C_{f2}^{\textit{Mx}} \gt 0$
. From the perspective of momentum transport, this indicates that large-scale Q2 structures are predominantly dominated by streamwise deceleration. During this deceleration process, excess momentum is transferred to the wall, thereby increasing the skin friction.
In contrast to Q2 structures, Q4 structures exhibit opposite but not fully symmetric behaviour. At small scales, as shown in figure 15(b), the decelerating part holds only a slight advantage within the streamwise extent of the structure, with both parts being nearly comparable. This results in
 $C_{f4}^{\textit{Mx}}$
being almost equal to 0, as depicted in figure 12(b). However, for
 $l_y^+ \geqslant 20$
, as shown in figures 15(d,f,h), accelerating motion becomes dominant. This leads to a significant transfer of momentum from the wall to the structure, ultimately reducing the skin friction (
 $C_{f4}^{\textit{Mx}} \lt 0$
).
The mechanism of
 $C_{\kern-2.5pt f}^{Mz}$
is analogous to that of
 $C_{\kern-2.5pt f}^{\textit{Mx}}$
. Due to the rotation of the streamwise vortex, prior to the ejection of fluid parcels in Q2 structures, the spanwise motion directly beneath the structure converges towards
 $\Delta z = 0$
. Owing to spatial confinement, the spanwise flow in this region tends to decelerate, i.e.
 $\widetilde {w}\, {\rm d}\widetilde {w}/{\rm d}z \lt 0$
. The excess momentum is thereby transported to the wall, resulting in
 $C_{f2}^{Mz} \gt 0$
. Similarly, for Q4 structures, the impingement of fluid parcels induced by sweeping motion causes them to accelerate outwards along the spanwise direction after hitting the wall, leading to
 $C_{f4}^{Mz} \lt 0$
.
It should be noted that for large-scale structures, the spatial development term
 $C_{\kern-2.5pt f}^U$
tends to cancel the streamwise motion term
 $C_{\kern-2.5pt f}^{\textit{Mx}}$
– a phenomenon that will receive detailed analysis in § 5.
5. Term
$C_{\kern-2.5pt f}^{U}$
and the evolution of structures

This section investigates the temporal evolution of individual structures to examine scale-dependent characteristics of
 $C_{\kern-2.5pt f}^{U}$
and provide explanations for
 $C_{\kern-2.5pt f}^{\textit{Mx}}$
behaviour. Figure 16 shows the probability density function (PDF) of the streamwise convective velocity, the conditionally averaged velocities of Q2 and Q4 structures at different scales, and the global mean velocity. The convective velocity of the structures is obtained by calculating the streamwise displacement of the geometric centre between two consecutive time instants (Lozano-Durán & Jiménez Reference Lozano-Durán and Jiménez2014). The figure reveals that the convective velocity of Q2 structures is slightly lower than the mean velocity, while that of Q4 structures is somewhat higher, which is consistent with the findings of Jeon et al. (Reference Jeon, Choi, Yoo and Moin1999) and Lozano-Durán & Jiménez (Reference Lozano-Durán and Jiménez2014). The comparable but unequal magnitudes of
 $\tilde {u}_c^+$
and
 $\tilde {u}^+$
indicate partial violation of Taylor’s frozen-flow hypothesis (
 $\partial \tilde {u}/\partial t \approx -u_c\,\partial \tilde {u}/\partial x$
), consistent with § 3 observations where
 $C_{\kern-2.5pt f}^{\textit{Mx}}$
and
 $C_{\kern-2.5pt f}^{U}$
were oppositely signed but not perfectly balanced.
Figure 13 reveals distinct scale-dependent trends: for small-scale Q2 structures,
 $C_{f2}^{U}\gt 0$
(
 $\partial \tilde {u}/\partial t\lt 0$
) suggests continued streamwise velocity reduction, while Q4 structures show
 $C_{f4}^{U}\lt 0$
(
 $\partial \tilde {u}/\partial t\gt 0$
), indicating velocity enhancement in the dimension of time. Considering that the streamwise motion of the Q2 structure will reduce the main flow velocity, while the Q4 structure will increase it, this implies dominant growth phases for small-scale wall-attached structures. Conversely, large-scale structures exhibit opposite trends (Q2
 $\partial \tilde {u}/\partial t\gt 0$
, Q4
 $\partial \tilde {u}/\partial t\lt 0$
), signalling decay towards mean flow conditions.
Streamwise advection velocities
 $\tilde {u}_c^+$
, conditionally averaged velocities
 $\tilde {u}$
of Q2 and Q4 structures of different scales, and mean velocity profile
 $\tilde {U}^+$
, normalised by their local friction velocity
 $u_\tau$
. Here,
 $\tilde {u}_c^+ - \text{PDF}$
represents 40 % of the maximum probability density function.

(a) Maximum Reynolds shear stress and (b) normal scales of Q2 and Q4 structures during their evolution. The structures are at least once attached to wall, the developments of structures with different lifetimes are interpolated at 10 stages and averaged, and both Reynolds shear stress and normal scales are normalised by wall unit.

Detailed tracking of individual structures in figure 17 quantifies the evolution of peak Reynolds stress and wall-normal scale through birth, development and death stages. A rapid initial growth is observed in both parameters, followed by an extended quasi-steady development, and a gradual decay in the end. This phenomenon is further supported by the overlapping ratio
 $R$
curve. As shown in figure 18,
 $R$
is very large at the initial moment, then decreases sharply and remains stable. The overlapping ratio
 $R$
is defined as the difference in structure volume before and after development divided by the overlapping volume (
 $R = |v_2 - v_1| / v_0$
). A large
 $R$
indicates that the structure has undergone significant scale growth. In figure 17(b), the wall-normal scale evolution shows small-scale Q2 structures predominantly in birth phases, while Q4 structures appear in both birth and decay stages but with smaller birth-phase scales – consistent with the above hypotheses.
Plots of 40 % of the maximum of the probability density function of overlap ratio
 $R$
during evolution. The evolutionary stages are the same as in figure 17.

Probabilities of growth and decay for attached Q2 and Q4 structures with different scales.

Since structures cannot remain wall-attached during the complete evolution, and this study only focuses on attached structures, a more rigorous analysis focusing exclusively on attached structures examines consecutive evolutionary instants (figure 19). Growth phases are defined by increasing maximum Reynolds shear stress, consistent with figure 17(a). The results demonstrate strong scale-dependent asymmetries: small-scale Q2 structures show significantly higher growth probability, while small-scale Q4 structures exhibit nearly balanced growth/decay probabilities. This asymmetry explains the relatively smaller
 $C_{f4}^{U}$
magnitudes for Q4 structures in figure 12(b), as opposing growth/decay effects tend to cancel out.
Furthermore, re-examining the conditionally averaged velocities of each structure in figure 16, it is observed that for large-scale structures,
 $\tilde {u}^+$
for Q2 events is lower than the mean velocity
 $\tilde {U}^+$
across all wall-normal heights, while the opposite holds for Q4 events. This observation is consistent with previous studies (Gomit Reference Gomit2018), reflecting the mechanism by which Q2/Q4 structures influence skin friction by attenuating/augmenting the mean velocity. However, for small- and medium-scale Q2/Q4 structures, while
 $\tilde {u}^+$
is lower/higher than
 $\tilde {U}^+$
in the near-wall region, the trend reverses in the outer layer – a phenomenon that appears to have received limited attention in incompressible flows. This may suggest that in compressible flows, the influence of large-scale structures warrants greater emphasis. Additionally, for large-scale Q2 and Q4 structures, the convection velocities exhibit notably low values, a feature not previously reported in incompressible flows.
6. Other terms and factors
This section briefly discusses the other three terms with minor influence:
 $C_{\kern-2.5pt f}^{B}$
,
 $C_{\kern-2.5pt f}^{P}$
and
 $C_{\kern-2.5pt f}^{T}$
. First,
 $C_{\kern-2.5pt f}^{B} = ({2}/{y_b}) \int _0^{y_b} \left((y_b - y) ( ({\partial \bar {\tau }_{xx}}/{\partial x}) +( {\partial \bar {\tau }_{xz}}/{\partial z}) ) + \bar {\tau }_{\textit{xy}}\right) {\rm d}y$
. Note that
 $\tau _{xx}$
,
 $\tau _{\textit{xy}}$
and
 $\tau _{xz}$
here represent viscous shear stresses, thus this term represents the shear effect within the boundary layer, especially near the wall. As shown in figures 12 and 13, this term dominates at smaller scales. As the scale increases,
 $C_{\kern-2.5pt f}^B$
gradually decreases, indicating that the viscous effect diminishes with increasing height. Compared to the Q4 structure, the viscous term of skin friction beneath the Q2 structure accounts for a larger proportion.
The
 $C_{\kern-2.5pt f}^P$
term, which reflects the streamwise pressure gradient, follows a similar trend to
 $C_{\kern-2.5pt f}^{\textit{Mx}}$
, with both quantities reversing their signs when
 $l_y^+\gt 20$
. Flow field visualisations in figure 20 provide further insight: at
 $l_y^+=10$
, the Q2 core region exhibits positive streamwise pressure gradients (
 ${\rm d}\overline p/{\rm d}x\gt 0$
), leading to negative
 $C_{f2}^P$
values according to the relation
 $C_{\kern-2.5pt f}^P=-({2}/{{{y}_{b}}})\int _{0}^{{{y}_{b}}}{ ( {{y}_{b}}-y )}( {\partial \bar {p}}/{\partial x})\,\text{d}y$
, while Q4 structures display the opposite behaviour. When
 $l_y^+$
exceeds 20, the pressure gradient in Q2 regions reverses to negative values (
 ${\rm d}\overline p/{\rm d}x\lt 0$
), causing
 $C_{f2}^P$
to become positive, with Q4 structures again showing the inverse response. Scale-dependent vortex structure analysis reveals fundamental differences. For
 $l_y^+\geqslant 20$
, Q2 structures associate with fully developed hairpin-like vortices, whereas Q4 structures form inverted hairpin configurations consisting of paired streamwise vortex, both maintaining coherent streamwise organisation. In contrast, at
 $l_y^+=10$
, wall viscous effects produce fragmented structures with discontinuous streamwise arrangements. The small-scale Q2 vortices generate two counter-rotating streamwise vortices downstream, while Q4 vortices develop upstream streamwise vortices accompanied by downstream hairpin-like structures, exhibiting significant configuration asymmetry between Q2 and Q4 types. These distinct vortex morphologies and spatial distributions may explain the opposing pressure gradient characteristics observed between small-scale and large-scale structures.
By comparing the spatial organisations of small-scale structures in compressible and incompressible flows (Pan & Kwon Reference Pan and Kwon2018; Cheng et al. Reference Cheng, Li, Lozano-Durán and Liu2020; Dong et al. Reference Dong, Tong, Yu, Chen, Yuan and Wang2022b
; Zhang et al. Reference Zhang, Wan, Dong, Liu, Sun and Lu2023), it is revealed that in compressible flows, small-scale structures are more densely packed in the streamwise direction near the wall, and exhibit a less ordered, somewhat disorganised spanwise arrangement. This results in more pronounced local streamwise pressure gradient in compressible flows, potentially leading to a higher value of
 $C_{\kern-2.5pt f}^P$
compared to incompressible flows. Consequently, the contribution of pressure variation by Q2/Q4 structures to high/low skin friction may be greater, particularly at smaller scales. The difference in streamwise alignment may be related to thermal effects. Due to the coupling between velocity and temperature in compressible flows, and the high overlap ratio (
 $\gt 60\,\%$
, Li et al. Reference Li, Fu and Xu2025) of the two structures, the alternating streamwise distribution of thermal structures may influence the organisation of RSS. Furthermore, studies have shown that when the Mach number exceeds 3, dilatational structures with alternating signs begin to emerge in the flow field (Yu, Xu & Pirozzoli Reference Yu, Xu and Pirozzoli2019), which could also affect the spatial arrangement of Q2 and Q4 structures.
Conditionally averaged pressure gradient fields for Q2 and Q4 structures with different wall-normal scales.

Finally, the term
 $C_{\kern-2.5pt f}^{T} = -({2}/{y_b}) \int _0^{y_b} ((y_b - y) (( {\partial \bar {\rho } \widetilde {u''u''}}/{\partial x}) + ( {\partial \bar {\rho } \widetilde {u''w''}}/{\partial z}) ) + \bar {\rho }\, \widetilde {\,u''v''}) {\rm d}y$
is considered. It should be noted that in the traditional global skin-friction decomposition, this term represents the contribution of turbulent fluctuations. However, in the conditional decomposition based on RSS, as shown in (2.10), the effect of turbulent fluctuations is already incorporated into the conditionally averaged velocity
 $\widetilde {u}$
of the flow field surrounding the structure via the
 $C_{\kern-2.5pt f}^{M}$
term. Consequently, the conditional fluctuation velocity
 ${u}^{\prime\prime} = u - \widetilde {u}$
and its conditional average
 $\widetilde {u''}$
reflect the variability between structures rather than the influence of turbulent fluctuations. This explains why the
 $[C_{\kern-2.5pt f}^{T}]$
term contributes significantly in the globally averaged decomposition (figure 9), while
 $C_{\kern-2.5pt f}^{T}$
is minor in the conditionally averaged context. As shown in figure 12, the
 $C_{f4}^{T}$
term is nearly zero, but
 $C_{f2}^{T}$
is relatively larger, indicating greater variability among Q2 structures compared to Q4 structures, and this variability exerts a positive influence on skin friction.
7. Conclusion
This paper presents direct numerical simulations of supersonic zero-pressure-gradient turbulent boundary layers over a flat plate. The time-resolved clustering method was employed to identify and track Reynolds stress structures (RSS) (Q2 and Q4 events), followed by the conditionally averaged FIK-like identity of wall-attached RSS with varying wall-normal scales, with particular focus on the effects of streamwise and wall-normal motions (
 $C_{\kern-2.5pt f}^{\textit{Mx}}$
and
 $C_{\kern-2.5pt f}^{My}$
), and the effect of structural evolution is examined through
 $C_{\kern-2.5pt f}^{U}$
in the tracking of instant structures. The key findings include the following.
Small-scale structures, despite carrying lower Reynolds shear stresses and having limited influence ranges, generate more extreme skin friction. Among the contributors to skin friction (
 $C_{\kern-2.5pt f}^{\textit{Mx}}$
,
 $C_{\kern-2.5pt f}^{My}$
,
 $C_{\kern-2.5pt f}^{Mz}$
,
 $C_{\kern-2.5pt f}^U$
,
 $C_{\kern-2.5pt f}^P$
,
 $C_{\kern-2.5pt f}^B$
and
 $C_{\kern-2.5pt f}^T$
), the wall-normal motions represented by
 $C_{\kern-2.5pt f}^{My}$
constitute the dominant mechanism for high/low skin friction, while the spanwise motions (
 $C_{\kern-2.5pt f}^{Mz}$
) mitigate it. The streamwise motions and pressure gradients (
 $C_{\kern-2.5pt f}^{\textit{Mx}}$
and
 $C_{\kern-2.5pt f}^P$
) on large-scale structures exhibit opposite effects compared to small-scale ones, effectively mitigating the corresponding skin friction. The effect of
 $C_{\kern-2.5pt f}^B$
decreases with increasing wall-normal scales as the weakening of viscosity. Term
 $C_{\kern-2.5pt f}^U$
is of the opposite magnitude to
 $C_{\kern-2.5pt f}^{\textit{Mx}}$
at all scales, and they play a role in partially offsetting each other.
The terms
 $C_{\kern-2.5pt f}^{\textit{Mx}}$
,
 $C_{\kern-2.5pt f}^{My}$
and
 $C_{\kern-2.5pt f}^{Mz}$
represent the momentum transport by RSS in the three spatial directions. Among them, the wall-normal motion represented by
 $C_{\kern-2.5pt f}^{My}$
is the primary direction of momentum transport, and its sign is directly reflected in the sign of the instantaneous normal velocity, while
 $C_{\kern-2.5pt f}^{\textit{Mx}}$
and
 $C_{\kern-2.5pt f}^{Mz}$
are primarily determined by the sign of the convective acceleration. If the convective acceleration is positive, then this indicates that momentum is transferred from the wall into the structure, thereby reducing the skin friction, resulting in
 $C_{\kern-2.5pt f}^{\textit{Mx}} \lt 0$
and
 $C_{\kern-2.5pt f}^{Mz} \lt 0$
, and vice versa. Typically, regions with both positive and negative convective acceleration coexist within a structure. Determining the dominant region requires an integrated assessment, which is also related to the streamwise and spanwise scales of the structure.
On the other hand, since the streamwise motion within Q2/Q4 structures is coupled with their streamwise evolution, the spatial development term
 $C_{\kern-2.5pt f}^U$
tends to cancel with the streamwise motion term
 $C_{\kern-2.5pt f}^{\textit{Mx}}$
, therefore the sign reverse of
 $C_{\kern-2.5pt f}^{\textit{Mx}}$
can be explained by
 $C_{\kern-2.5pt f}^U$
. Structural evolution tracking reveals a fundamental scale-dependent dichotomy: small-scale structures predominantly undergo growth phases, while large-scale structures tend towards decay. This developmental asymmetry directly influences the temporal velocity evolution (
 $\partial \tilde {u}/\partial t$
), ultimately manifesting as the observed scale effects in
 $C_{\kern-2.5pt f}^U$
.
Through comprehensive analysis of
 $C_{\kern-2.5pt f}^{\textit{Mx}}$
and
 $C_{\kern-2.5pt f}^{U}$
from a momentum transport perspective, we identify two distinct scale-dependent regimes. For structures with smaller wall-normal scales and relatively larger streamwise dimensions, internal streamwise motions dominate momentum transport while simultaneously facilitating momentum accumulation during growth phases. Conversely, when wall-normal scales increase (characterised by reduced
 $a_{\textit{xy}}$
values), the structural behaviour shifts towards releasing accumulated momentum. This release process effectively converts temporally stored momentum into near-wall momentum flux, thereby enhancing the generation of high/low skin friction.
The unusual effects of
 $C_{\kern-2.5pt f}^P$
likely stem from wall viscosity and constraints on pressure fluctuations near the wall. These factors lead to fragmented streamwise vortex structures in the near-wall region, resulting in opposite pressure gradient effects between small- and large-scale structures.
Compared to incompressible flows, in the supersonic turbulence investigated here, the influence of pressure gradients from small-scale RSS on skin friction is likely more pronounced, while the contribution of wall-normal momentum transport by large-scale structures may be relatively greater. These differences may be attributed to factors such as the spatial organisation of structures and the intensity of streamwise vortices. More definitive conclusions will be established in future studies.
Acknowledgements
The authors gratefully acknowledge Dr P.J.Y. Zhang working in the University of Science and Technology of China, and Dr S.W. Dong and Dr M. Yu from the China Aerodynamics Research and Development Center, for providing valuable discussion.
Funding
The present study was supported by the National Natural Science Foundation of China (grant nos 12202488, 12525202), the National Postdoctoral Researcher Programme (GZB20230985) and the Innovation Research Foundation of the National University of Defence Technology (ZK22-30, JS25-07).
Declaration of interests
The authors report no conflict of interest.
Appendix A. Percolation analysis
This appendix provides a detailed explanation of the percolation analysis method and examines the sensitivity of threshold selection. Percolation theory, a branch of statistical physics, studies phase transitions in connectivity and is commonly used to describe the formation of connected clusters in random systems (Stauffer & Bunde Reference Stauffer and Bunde1987). The fundamental concept is that in a grid or space where ‘points’ or ‘blocks’ are randomly placed, a critical density (the percolation threshold) exists. Beyond this density, an infinite cluster spanning the entire system emerges. In the context of structure identification in turbulent flows, this ‘point placement’ process corresponds to gradually lowering the identification threshold. Taking vortex identification as an example (Moisy & Jiménez Reference Moisy and Jiménez2004), when the threshold is reduced to approximately 2, nearly all strong vorticity points connect to form a single massive structure, occupying approximately 4 % of the entire flow field volume. This phenomenon is referred to as the percolation transition. It indicates that strong vorticity structures are not randomly distributed but instead suddenly form a large-scale connected network at a specific threshold. Therefore, the threshold range causing this transition can be used as the identification threshold for structures. Percolation theory establishes that within this transition region, the identified structures maintain robust statistical consistency, making it the optimal operating range for coherent structure identification. This physics-based approach overcomes the subjectivity inherent in manual threshold selection while ensuring reliable characterisation of turbulent coherent motions.
The process of determining the threshold using percolation analysis is explained in detail below. As mentioned in § 2, three-dimensional RSS are defined as connected domains satisfying (2.6), with
 $H$
being the threshold. For a given
 $H$
, let
 $V_{{lar}}$
denote the volume of the largest identified structure, and
 $V_{{tot}}$
the total volume of all identified structures. The maximum volume fraction is then defined as
 $V_{{lar}}/V_{{tot}}$
. Additionally, the number of structures identified at this
 $H$
is denoted as
 $N$
, and the maximum number of structures identified across all
 $H$
values is
 $N_{{max}}$
. When
 $H$
is large, only a few very strong, small structures are identified. As
 $H$
decreases, the volumes of existing structures increase, and new structures emerge. Subsequently, a percolation transition occurs: structures begin to merge extensively, causing the maximum volume fraction (
 $V_{{lar}}/V_{{tot}}$
) to increase sharply, and the number of structures (
 $N/N_{{max}}$
) to decline. When
 $H$
becomes very small, almost all eligible points belong to a single giant connected cluster, resulting in
 $V_{{lar}}/V_{{tot}} \approx 1$
. After identifying the percolation transition range, any threshold within this range can, in theory, be selected without fundamentally affecting the final results. Typically, the threshold corresponding to the maximum number of identified structures within this range is chosen. Figure 21 presents the percolation analysis results of Q2 and Q4 structures. The percolation transition characteristics exhibit similarity between Q2 and Q4 structures, with the transition region spanning 0.6 to 1.4. Both quadrant types reach their maximum structure count at approximately
 $H=1$
, as is clearly demonstrated in figure 21. Based on these observations and for consistency in comparative analysis, we select
 $H=1$
as the optimal threshold value for both Q2 and Q4 structure identification.
Percolation analysis of Q2 and Q4 structures, where
 $V_{lar}/V_{tot}$
is normalised by its maximum value, the grey region is percolation transition, and the solid black line denotes the chosen threshold
 $H$
.

Anisotropy of wall-attached Q2 and Q4; similar to figure 7, but with
 $H=1.4$
.

Dominant friction components versus wall-normal scale; similar to figure 13, but with
 $H=1.4$
.

To test the sensitivity of the threshold selection, the results for a threshold value of
 $H = 1.4$
are presented in figures 22 and 23. It can be observed that compared to the results with
 $H = 1$
in the main text (figures 7 and 13), the differences in both the anisotropy and the conditional skin-friction decomposition are minimal. This confirms the validity of percolation theory: within the percolation transition range (
 $H = 0.6$
–
 $1.4$
), the geometric properties of the structures do not differ fundamentally. This range is close to and partially overlaps with the percolation transition range (
 $H = 1$
–
 $3$
) reported for incompressible flow (Lozano-Durán et al. Reference Lozano-Durán, Flores and Jiménez2012). Lozano-Durán et al. (Reference Lozano-Durán, Flores and Jiménez2012) selected
 $H = 1.75$
, and Bogard & Tiederman (Reference Bogard and Tiederman1986) selected
 $H = 1$
; the choice of
 $H = 1$
in the present study is also appropriate.
Appendix B. Definition of RSS
In incompressible flow, the Reynolds stress is defined as
 $-u'v'$
, whereas in the present supersonic flow, it is defined as
 $\tau = -(\rho u)'v'$
to account for density variations in compressible flow and to better represent the transport of momentum
 $(\rho u)'$
. To investigate the difference between the two definitions, results obtained using the
 $-u'v'$
definition are presented in this appendix.
Percolation analysis of Q2 and Q4 structure; similar to figure 21, but with RSS identified by
 $-u'v'$
.

Figure 24 shows the percolation analysis plot for RSS identified using
 $-u'v'$
. The percolation transition region is observed to be
 $H = 0.6$
–
 $1.2$
, which is very close to that obtained with
 $-(\rho u)'v'$
in figure 21. Therefore, the same threshold
 $H = 1$
is selected.
Anisotropy of wall-attached Q2 and Q4; similar to figure 7, but with RSS identified by
 $-u'v'$
.

A comparison of the anisotropy in figures 25 and 7 shows nearly identical results, indicating that the scales of the structures identified by both methods are similar. Regarding the conditional skin-friction decomposition, comparing figures 26 and 13 reveals that the qualitative trends are essentially consistent, with only minor quantitative differences. When using
 $-u'v'$
for identification, the absolute values of all terms are slightly larger than those obtained with
 $-(\rho u)'v'$
. However, the overall variation patterns with scale show no significant differences, and the conclusions drawn in this study remain capable of explaining these observations.
Dominant friction components versus wall-normal scale; similar to figure 13, but with RSS identified by
 $-u'v'$
.