

In September 2010 in the midst of a diplomatic dispute with Japan over the Senkaku/Diaoyu Islands, rare-earth elements were brought into the public eye as a tool of economic statecraft. During the crisis, Japanese buyers of rare earths reported they were unable to export them from Chinese ports. The export ban threatened key sectors of Japan's economy, and China's apparent willingness to use its economic muscle as leverage in political negotiations was threatening for businesses and policy makers in large importing countries such as Japan, the United States, and Germany. Chinese authorities consistently denied the ban's existence, but international observers were not reassured, particularly as China held almost complete global control of the resource. This paper examines economic statecraft, power and interdependence, discussing the political implications of near-monopoly control of a resource critical for high-tech military, consumer, medial, and environmental industries. The rapid backlash from primary importing countries and firms initially showed the salience and power of economic statecraft. Ultimately, however, the case of rare earths casts doubt that economic statecraft is an effective policy tool. Japan's response – an aggressive international diversification drive – effectively undermined sanctions policy and deepened political ties between Japan and China's neighbors. Economic statecraft ultimately served to heighten regional competition and undermine the China's own end goals.
The OPEC oil crises, and the subsequent need to understand how market control of a strategic resource could translate into political leverage, birthed the contemporary field of international political economy. Nye and Keohane argued that states could strategically use economic power in political bargaining in addition to coercive mechanisms of military force (Nye and Keohane, Reference Nye and Keohane1977). Economic leverage could potentially give states the ability to send costly signals that did not involve military force but nonetheless could effectively influence the policy direction of the target state (Maull, Reference Maull, Knorr and Trager1977; Morrow, Reference Morrow1999; Gartzke et al., Reference Gartzke, Li and Boehmer2001; Hancock and Vivoda, Reference Hancock and Vivoda2014). Since then, the efficacy of economic statecraft has been widely debated and often heavily disparaged (e.g., Pape, Reference Pape1997, Reference Pape1998; Drury, Reference Drury1998; Drezner, Reference Drezner1999, Reference Drezner2011). Deliberate sanctions spoilers or ‘black knights’ (Hufbauer et al., Reference Hufbauer, Schott and Elliott1990; Early, Reference Early2015) and the difficulty of maintaining collective action undermine the ability to maintain economic pressure even in cases where the sanctions are strong enough to damage the economic interests of the target state (Martin, Reference Martin1993; McClean and Whang, Reference McLean and Whang2010).
The case of rare earths is one where economic statecraft should be relatively simple to implement and use as leverage. In cases where economic dependence is high, and alternative markets or substitutable products undeveloped or unavailable, economic statecraft should be maximally effective. China's near-monopoly eliminated the need for difficult collective action. Substitution of the resource is moreover difficult, particularly for the valuable and scarce heavy rare-earth metals, requiring considerable start-up costs and technological expertise.
Despite these advantages, it is retrospectively clear that the alleged export ban had (at best) very narrow political efficacy. Japan did accede to China's demands to release the Chinese fishing boat captain Zhan Qixiong without charges just days after an embargo was widely reported in the press. At the time, the action was seen as a diplomatic loss for the Kan Naoto administration, which was greatly criticized for presumably giving into Chinese pressure (Kyodo, 2010). On the larger policy issue of ownership of the disputed territories, however, China did not win. The Senkaku/Diaoyu Islands are still disputed, and 2012 saw a larger diplomatic incident when Japan effectively nationalized them. The use of rare earths as a geopolitical bargaining chip should therefore be viewed as a failure. The concentration of rare-earth supplies within China, along with their use in large and profitable industries and military applications raised the stakes of conflict, and triggered countermeasures. China's sanctions prompted strategic risk management on the part of private Japanese firms and state-level industrial policy aimed at minimizing disruptions to their supply chain.
The monopolistic environment provides an opportunity to trace how firms and the state expand an economic network in response to the political risk created by a sanctions regime. A vector error correction model (VECM) statistically disentangles the effects of China's economic statecraft from their rare-earth trade and pricing policies. Prior to 2010, there was little international supply diversification; besides China, countries with rare-earth reserves had largely ceased mining or end-use production of rare earths by the 2000s. Even if firms were actively looking to diversify their supply, the market was narrow. The existence of the export ban was also fiercely debated, with some saying it was simply a matter of Chinese export quotas or increased prices that led Japanese firms to protest. Japanese actors were influenced by changes in these economic variables, but evidence presented here demonstrates it was China's coercive economic diplomacy that triggered the change in Japan's economic behavior. China's purported use of rare-earth elements as an economically costly diplomatic signal demonstrated their potential leverage, but also had unintended consequences, as Japan moved to diversify rare-earth supplies and in doing so deepened diplomatic ties with China's neighbors.
The statistical model demonstrates that export quotas and price fluctuations do not fully account for Japan's response. The findings demonstrate that even in cases of extreme market monopoly and an essentially non-substitutable good, concerted cooperation between the public and private sectors in the target state can effectively bust sanctions. Moreover, through a comparison of American and Japanese reactions to Chinese policy, the paper demonstrates that when faced with similar market conditions but the absence of political coercion, a state will not aggressively pursue diversification.
1. China's rare-earth policies
China has held a virtual monopoly over global production of rare-earth elements for decades, controlling over 90% of the world's current supply and approximately 30% of the world's known reserves. By the 1990s the two main importers of rare earths, Japan and the United States, depended on China for more than 90% of their supply (United States Geological Survey Minerals Yearbook). Rare earths include 17 elements (the 15 lanthanides plus scandium and yttrium) and are necessary for components in many high-tech products. Both the more abundant light rare-earth elements and scarcer heavy elements have important commercial and military uses, such as hybrid car engines, cell-phone batteries, components in jet fighter engines, missile guidance systems, satellite communication devices, and more (Asashima, Reference Asashima2010; Humphries, Reference Humphries2010; Coppel, Reference Coppel2011; United States Geological Survey, various years). Global demand began for the resources rose in the 1980s, particularly in Japan, the United States, and Germany. More recently, demand from the rapidly developing Chinese and Indian economies has created more demand, and a more global market (Hurst, Reference Hurst2010).
While the United States dominated the global manufacture of rare-earth elements in the 1980s, largely through Mountain Pass Mine in California by 1994 US and Chinese rare-earth elements production was separated by only 10,000 tons. Less than 10 years later, US production was near zero and Chinese production over 80,000 tons. Largely due to lower production costs and poor environmental regulation in China, but also because of Chinese state investment in the rare-earth industry, China came to dominate the market after the Mountain Pass Mine ceased production in 2002 (Mancheri, Reference Mancheri2012, Reference Mancheri2015).
China's rare-earth monopoly is maintained through abundant reserves and technical expertise, needed as rare earths are difficult to extract and process. That said, China does not control the global reserves of rare earths: they could be mined and processed elsewhere given the right conditions and investments. China's supply monopoly is maintained through control ‘over several stages of REE processing – from mining to separation into individual elements’ (Golov et al., Reference Golov, Scott, Erskine, Ali and Ballantyne2014: 58). Trade dependence on China among the advanced industrialized nations that heavily use rare-earth elements in high-end manufactures is thus high, but not unsurmountable. Japan accounts for a large percentage of global rare-earth consumption and is the single greatest importer of rare-earth elements. The country also accounted for between 50 and 60% of Chinese rare-earth exports (Situation and Policies of China's Rare Earth Industry, 2012).
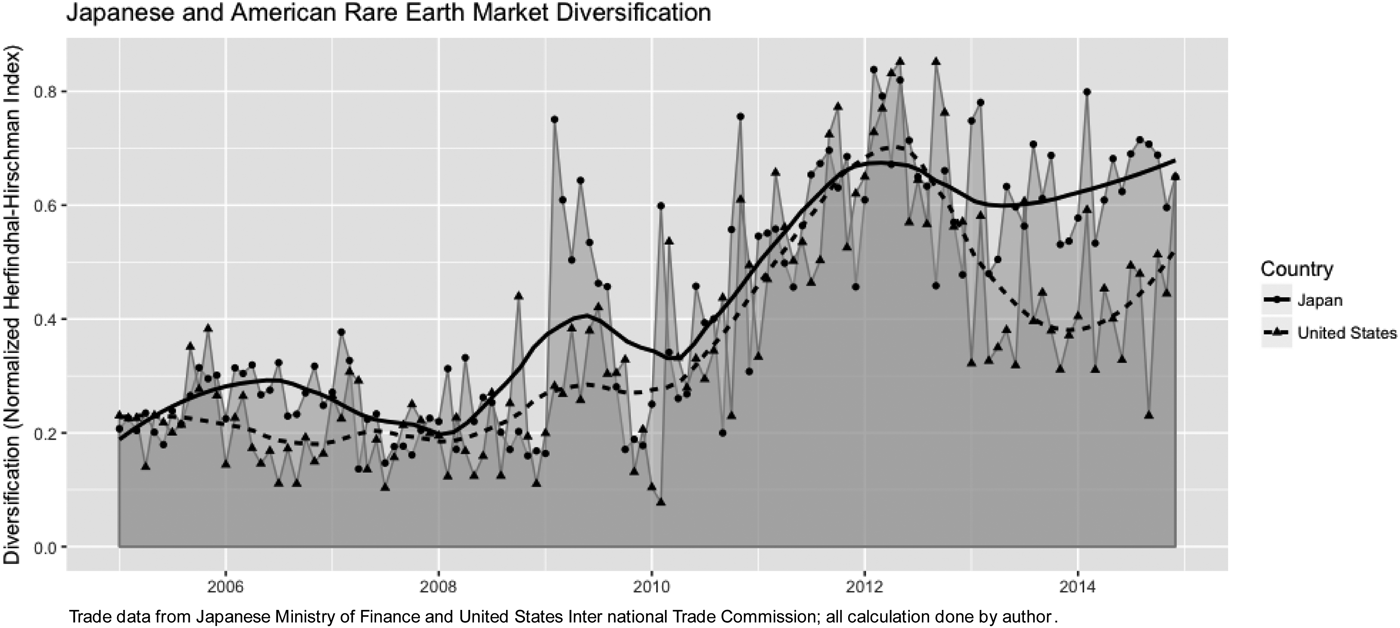
Figure 1 shows the dependence of Japan and the United States on Chinese rare-earth imports from 2005 to 2014 using a normalized Herfindahl–Hirschman index (HHI) and a trend line.Footnote 1 The HHI is a measure of market diversity and ranges from 0 to 1, where 0 is a perfectly monopolistic market structure and numbers closer to 1 indicate diversification or a competitive market. Japan has between 8 and 19 non-Chinese sources for rare-earth metals and the United States between 9 and 22. From 2005 to 2009, the HHI hovers around 0.2 for both countries, indicating an extremely uncompetitive market, and reflecting China's rare-earth dominance. Japan's HHI has two sharp increases – in February 2009 and November 2011 – and trends toward greater diversification with a value around 0.6. The United States HHI also trends up between 2010 and 2012, and then falls to around 0.4 in 2013–2014.
Japanese and American rare-earth market diversification

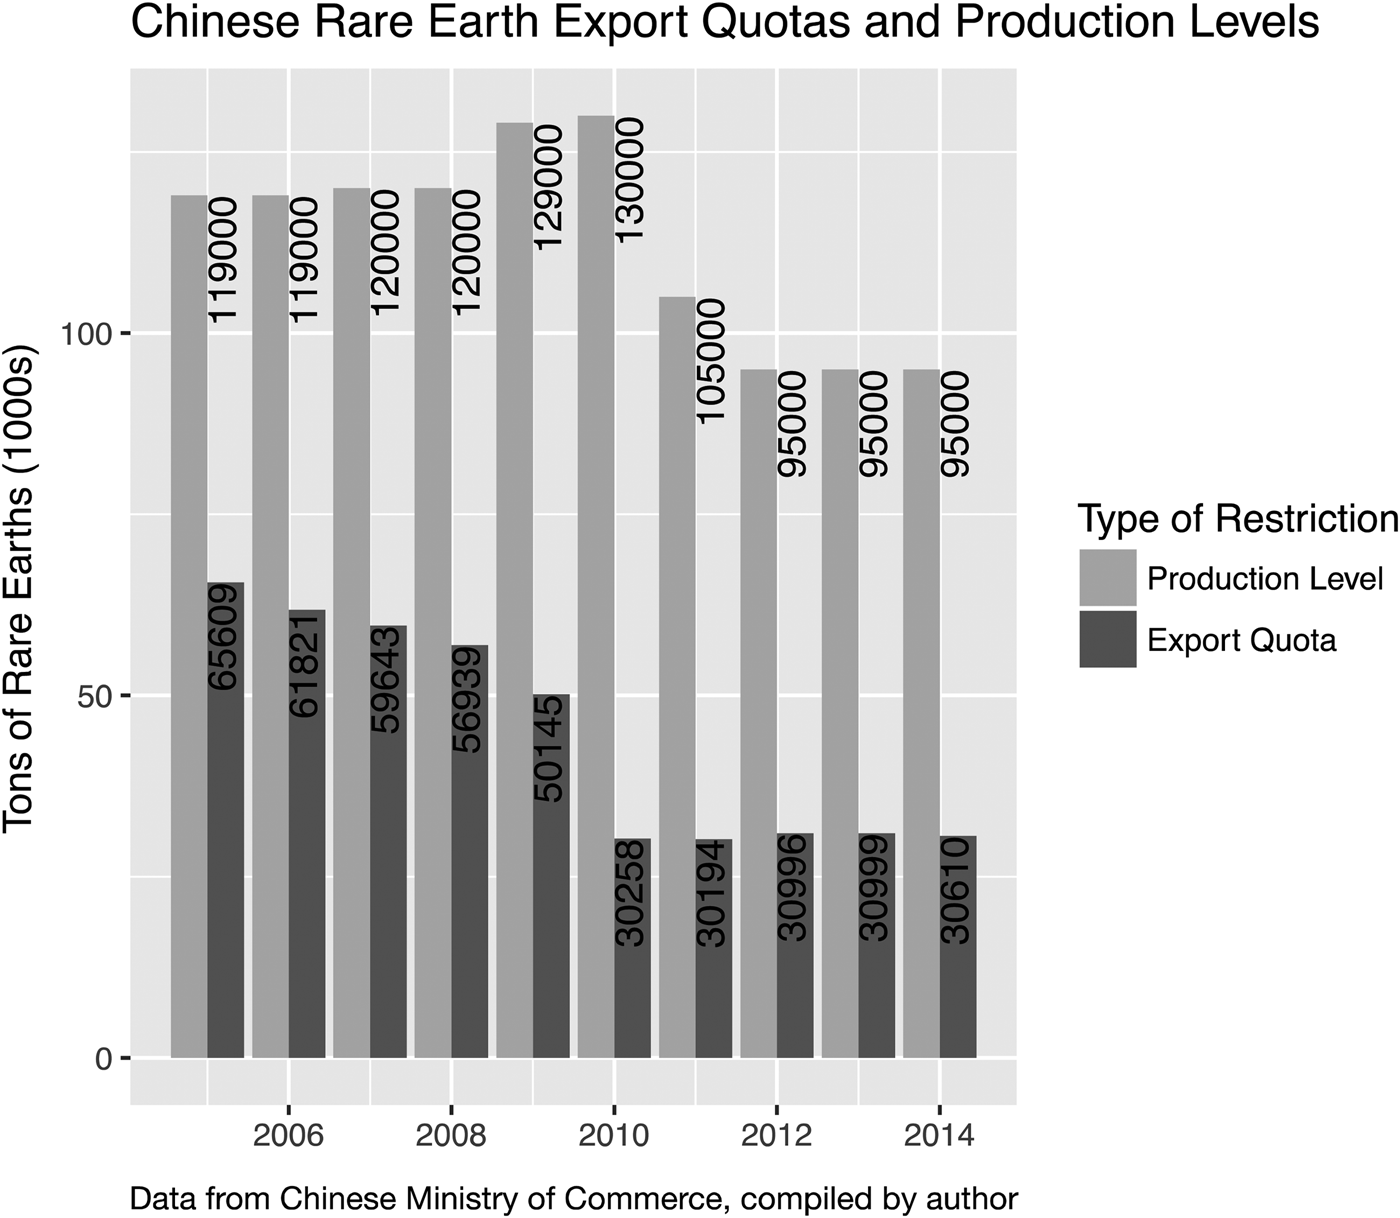
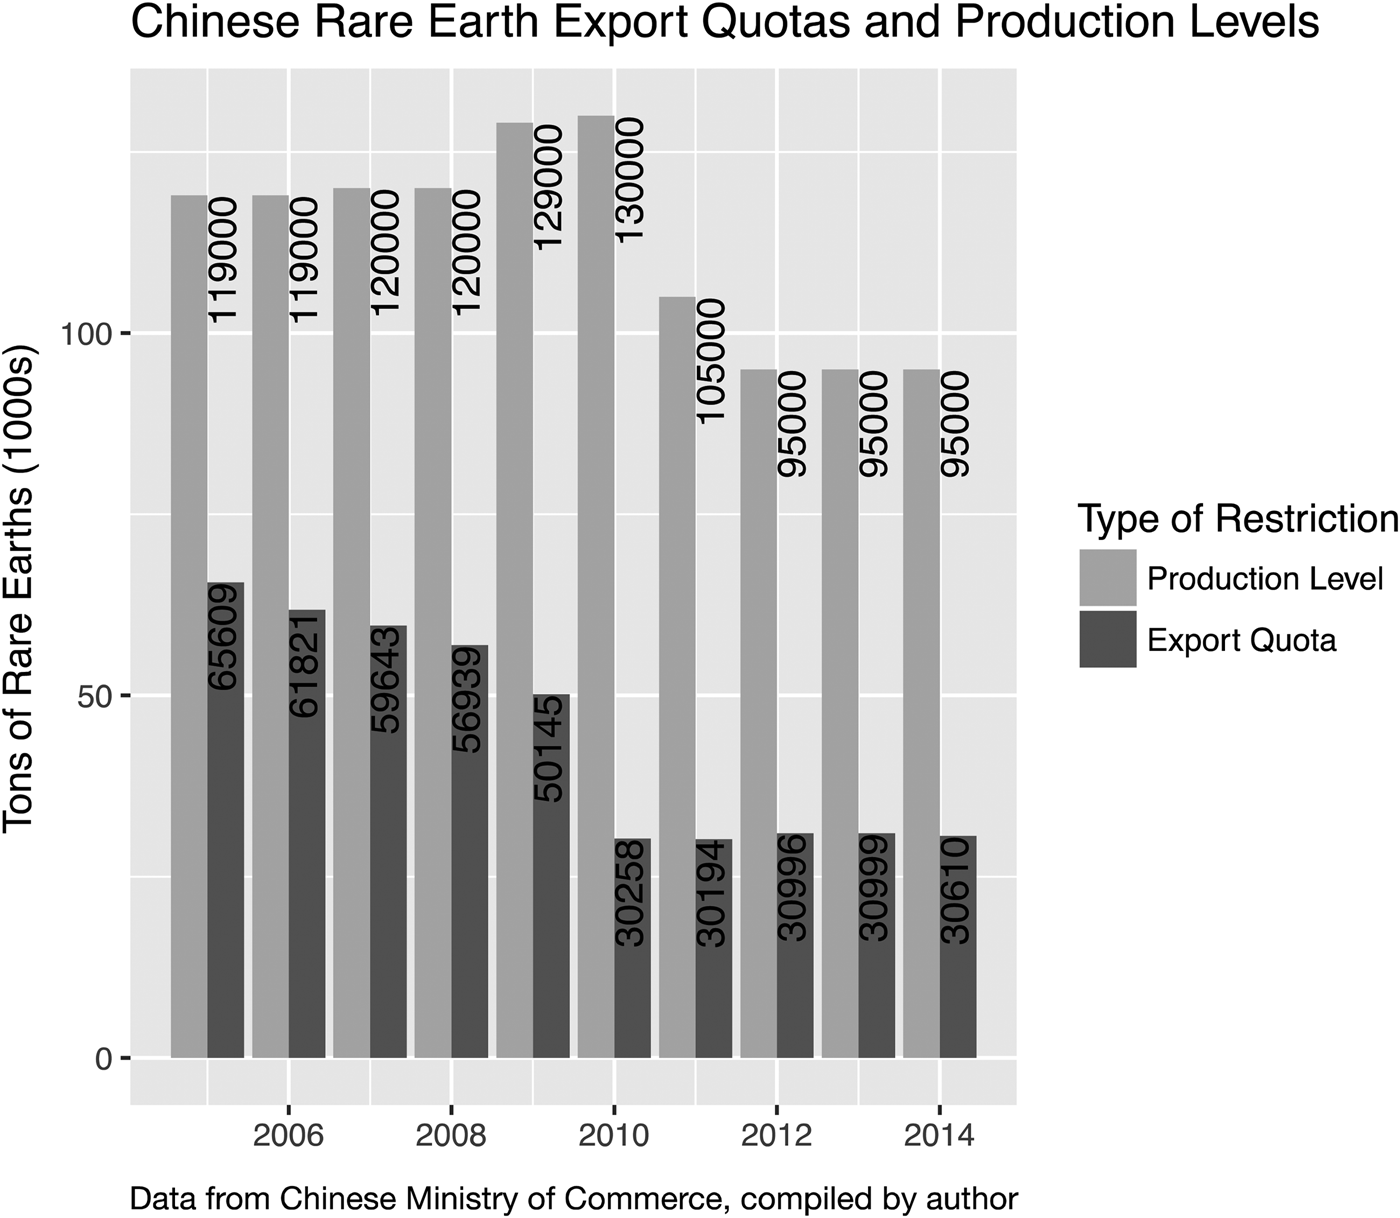
Prior to the export ban, China's rare-earth policies attempted to stabilize their internal market and partially limit exports. In the early 2000s, China began to limit the supply of rare-earth elements with both production and export quotas. After the initial implementation of production quotas in 2001, levels continued to be high, likely because of illegal mining and the lack of central coordination to control mines (Hurst, Reference Hurst2010; Nakano, Reference Nakano2011). In 2005, China began to implement rare-earth export quotas, setting the first quota at the export level from 2004 (see Figure 2). Export quotas began modestly, with decreases of <10% from the previous year, but increased dramatically to almost 40% cuts in 2010 (including a July 2010 announcement from the China Ministry of Commerce (2011) that it was cutting its export quotas by 72% for the remainder of the year). The quotas remained at that level through 2014. In addition to trade policy, from the 2000s the Chinese state has been attempting to centralize and rationalize the rare-earth industry as outlined in their 2012 report Situation and Policies of China's Rare Earth Industry. As with quotas, state efforts accelerated in 2010. Through these policies, the state aimed to shut down illegal and dangerous mines (of which there were over 300 as of 2012), and consolidate the over 2000 existing mines into six regionally based state-owned conglomerates.
Chinese rare-earth export quotas and production levels.
These policies have three potential aims: environmental conservation, an attempt to shift economic advantage from foreign producers to domestic producers, or an effort to gain geopolitical advantage over rival states by leveraging the resource. The first aim is unlikely, and the second two more plausible. Although the mining of rare-earth elements does come at considerable environmental cost, their restriction for environmental concerns was rejected by the WTO in 2014 (see Bradsher, Reference Bradsher2010a; Hurst, Reference Hurst2010; Hao and Liu, Reference Hao and Liu2011; Kilby, Reference Kilby2014). While the mining of rare earths is environmentally harmful, the prevailing evidence indicates that the CCP was not driven by those concerns in policy making (see Chaffin, Reference Chaffin2011; Hornby and Donnan, Reference Hornby and Donnan2013; WTO, 2014).
There is more evidence for the second goal: economic resource nationalism. Resource nationalism involves ‘rebalancing, [or] a focus on shifting a larger share of commodity revenues from international to domestic hands’ and is common in the oil industry (Bremmer and Johnston, Reference Bremmer and Johnston2009: 151). The Chinese state has worked to consolidate the rare-earth value chain from mining to final production through subsidies and trade policy (Golov et al., Reference Golov, Scott, Erskine, Ali and Ballantyne2014; Mancheri, Reference Mancheri, De Lima and Leal2016; Kennedy Reference Kennedy, De Lima and Leal2016). On the 1992 ‘southern tour’ Deng Xiaoping famously said, ‘the Middle East has oil, and China has rare earths’, suggesting a deliberate strategy to maximize China's share of global rare-earth production, for at least economic if not necessarily geopolitical gain (Li, Reference Li2012). More than 20 years later, the head of the China Society of Rare Earths said: ‘the real value of rare earths is realized in the final product’ (quoted in Abraham, Reference Abraham2015: 33). This perspective fits into broader Chinese political economy arguments that predict centralization and strict state control over strategic resources and sectors (Hsueh, Reference Hsueh2011). The Chinese rare-earth industry does not involve coercive nationalization of foreign invested companies, but rather the involuntary centralization and consolidation of domestic mining operations. Combined with the reduced export quotas, the results are effectively similar to oil or other resource nationalism (Laux and Molot, Reference Laux and Molot1978; Wilson, Reference Wilson1986; Vivoda, Reference Vivoda2009). China's policies thus serve to shift economic advantages from foreign-based buyers to domestic producers and the state. Export restrictions for raw materials are an additional policy tool used to give domestic downstream producers a competitive advantage through access to cheap resources not available to their international competitors. This policy encourages high-end manufacturers to bring industrial investments to China (Mancheri, Reference Mancheri, De Lima and Leal2016). Some examples exist: Japanese producers of rare-earth-dependent products have indeed begun to shift to China (see Inoue and Gordon, Reference Inoue and Gordon2011; TDK, 2013 for examples).
The final and most contested interpretation is that Chinese rare-earth policy was economic statecraft: a tool for geopolitical leverage. There exists evidence for and against this proposition, implicitly hinging on whether an analyst believes there was an export ban. The economic nationalism camp argues rare earths could be future ‘elements of conflict’ in East Asia, as Japan and South Korea begin to utilize area around disputed territories in order to diversify supply (Ting and Seaman, Reference Ting and Seaman2013; Abraham, Reference Abraham2015; Kalantzakos, Reference Kalantzakos2018). Contrarily, others argue that there is limited to no evidence that an export ban occurred, either because disruptions in Japanese imports are inconsistent with an export ban (Johnston, Reference Johnston2013) or because the rare-earth issue was a significant grievance and concern prior to fall 2010 (Hagström, Reference Hagström2012). Others argue that China is pursuing policy consistent with a ‘socially responsible organization’ by successfully promoting the interests of domestic over international stakeholders (Hayes-Labruto et al., Reference Hayes-Labruto, Schillebeeckx, Workman and Shah2013), or that China's rare-earth policies were motivated primarily by environmental concerns as addressed above (Bradsher, Reference Bradsher2010a; Hurst, Reference Hurst2010; Kilby, Reference Kilby2014).
Japanese firms active in China first reported the export ban. In October 2010, the Japanese Ministry of Economy, Trade, and Industry surveyed 152 firms, of which 66 responded. Of the responders that traded in rare earths (31 companies), each one reported some form of difficulty importing the commodities. 25% reported additional and new procedures at the export license stage, which they could not fulfill. Thirty-five percent reported their exports licenses denied at Chinese customs, and 45% reported being stopped at the customs bond area and in some cases all Japan-bound ships being detained (Ministry of Economy Trade and Industry, 2010c). At the same time, Chinese officials categorically denied trade restrictions. Then Chinese Premier Wen Jiabao assured international audiences on 8th October that ‘China has not and will not obstruct the trade of rare earths’ on 8th October (Li, Reference Li2010), and on 29th October, Ministry of Industry and Information Technology spokesman Zhu Hongren's reaffirmed that Chinese stance that the minerals would ‘not be used as a bargaining tool’ (Pan, Reference Pan2010). These assurances did little to calm the importers of rare earths in the United States, European Union, and Japan.
Observers around the world denounced the Chinese government's apparent use of natural resources for political leverage (Hao and Liu, Reference Hao and Liu2011; Marukawa, Reference Marukawa2011; Nakano, Reference Nakano2011). Paul Krugman called China ‘a rogue economic superpower, unwilling to play by the rules’ with a ‘government that is dangerously trigger-happy, willing to wage economic warfare on the slightest provocation’ (Krugman, Reference Krugman2010). American government agencies and think tanks largely agreed with Krugman. The American Enterprise Institute wrote that ‘economic coercion appears to be a legitimate foreign policy tool, especially in the early stages of a bilateral dispute’ for China, citing rare earths in particular (Mazza, Blumenthal and Schmitt, Reference Mazza, Blumenthal and Schmitt2013, 2). The US government named rare earths a ‘critical resource’, and pursued policies related to resource security (Coppel, Reference Coppel2011; Parthemore, Reference Parthemore2011; US House, 2011; Department of Defense, 2013). A German business official commented that ‘raw materials have become a geopolitical issue’ (Reuters, 26 October 2010). Japanese state actors were also actively concerned about the erosion of the border between politics and economics (Interviews with officials from Ministry of Foreign Affairs, Ministry of External Trade and Industry, Cabinet Office, 2011). Expert David Abraham commented that Japanese ‘officials worried that rare earths were just the beginning of what China might withhold because China is also the leading global producer of twenty-eight advanced metals also vital to Japanese industry’ (Abraham, Reference Abraham2015: 24). The Japanese Chamber of Commerce in Beijing requested ‘policy stability’ and predictability in rare-earth exports in their annual White Paper, suggesting that the quotas were placing a burden on Japanese companies and that the alleged export ban had created panic (Japanese Chamber of Commerce, 2011; Author Interview October 2011).
The use of economic coercion in China's foreign relations has not been limited to rare earths, damaging the plausibility of China's denials. Previous findings on the effects of politics on China's trading patterns are mixed, but largely indicate that interstate conflict between China and its partners does politicize economic relations, and lends credence to the idea that rare earths could have been used as a political bargaining tool. Fisman et al. (Reference Fisman, Hamao and Wang2014) find that Japanese and Chinese firms that were highly exposed to the partner economy suffered in the stock market in the wake of political tensions (or similarly Newland and Govella (Reference Newland and Govella2010)). Vekasi (Reference Vekasi2014) finds that large Japanese firms in China which were highly visible and consumer-oriented suffered economic fallout following political tensions, whereas smaller, component manufacturers did not (see also Nagy (Reference Nagy2013) for a similar discussion). Fuchs and Klann (Reference Fuchs and Klann2013) found a significant decline in trade with China after a country's head of state met with the Dalai Lama. Contrarily, Davis and Meunier found that Sino-Japanese political tensions do not significantly change trading patterns, concluding that ‘the resilience of economic interdependence to political crises’ created a buffer zone to shield normal business transactions from geopolitics (Davis and Meunier, Reference Davis and Meunier2011: 644). China's virtual monopoly and increasing state control over rare earths makes the sector an atypical business transaction. The Japanese state and private firms thus had a strong foundation from history and experience to believe and act as if the embargo was not merely cheap talk but a threat to their long-term business prospects in China.
2. Japan's diversification efforts
Japanese state and private actors moved aggressively and sometimes in collaboration to diversify supply. Diversification activities, including new Economic Partnership Agreements, joint ventures, mining exploration, and rare-earth processing plants throughout Asia, the Americas, and Australia, began when China tightened export quotas, and greatly accelerated following the politicization of the resource in fall 2010. The events in the fall of 2010 damaged the perception that Sino-Japanese political friction would steer clear of economics and led to an all-out international rare-earth diversification drive by both the state and private sector. Japan's rare-earth diversification efforts span from Central to Southeast Asia, and from South America to the bottom of the Pacific Ocean (Beauford, Reference Beauford2011; Reuters, 2011). The Japanese state promoted diversification through diplomatic agreements with countries with domestic rare-earth reserves, overseas development aid projects, and by providing opportunities (such as economic tours or trade fairs) for firms to find partners in those countries. State efforts originated in the Japanese Ministry of Foreign Affairs (MOFA), the Ministry of Economy, Trade, and Industry (METI) (and its organization the Japan External Trade Organization (JETRO)), and the Japan Oil, Gas, and Metals National Corporation (JOGMEC).
On 1 October 2010, approximately 10 days after news agencies reported an export ban, Japanese Foreign Minister Maehara Seiji announced in a press conference that the Japanese government would practice ‘pluralistic risk management’ with regard to rare earths:
Securing a long-term, stable supply of mineral resources that contain rare-earth elements is one of our country's important diplomatic goals. …[We intend] to engage strategically in such matters as diplomacy in the area of natural resources…[and] to pour further efforts through our diplomatic missions abroad into collecting information that contribute to development of mines overseas and securing of relevant interests, as well as into strengthening bilateral relations through mutual high-level visits, meticulous economic cooperation that take into consideration the needs of countries that possess resources, and other means. Taking into full account the needs and requests of Japanese companies, we intend to actively support private enterprises by working together with relevant ministries, agencies, and institutions and working as a team, utilizing various tools such as ODA programs and technical cooperation (Maehara, Reference Maehara2010).
In a policy speech to the Diet on 24 January 2011, Maehara emphasized economic diplomacy with the ‘U.S., Australia, Mongolia, India, Vietnam, and Kazakhstan’, of which one pillar was securing strategic resources through overseas development aid and diplomacy (Maehara, Reference Maehara2011).
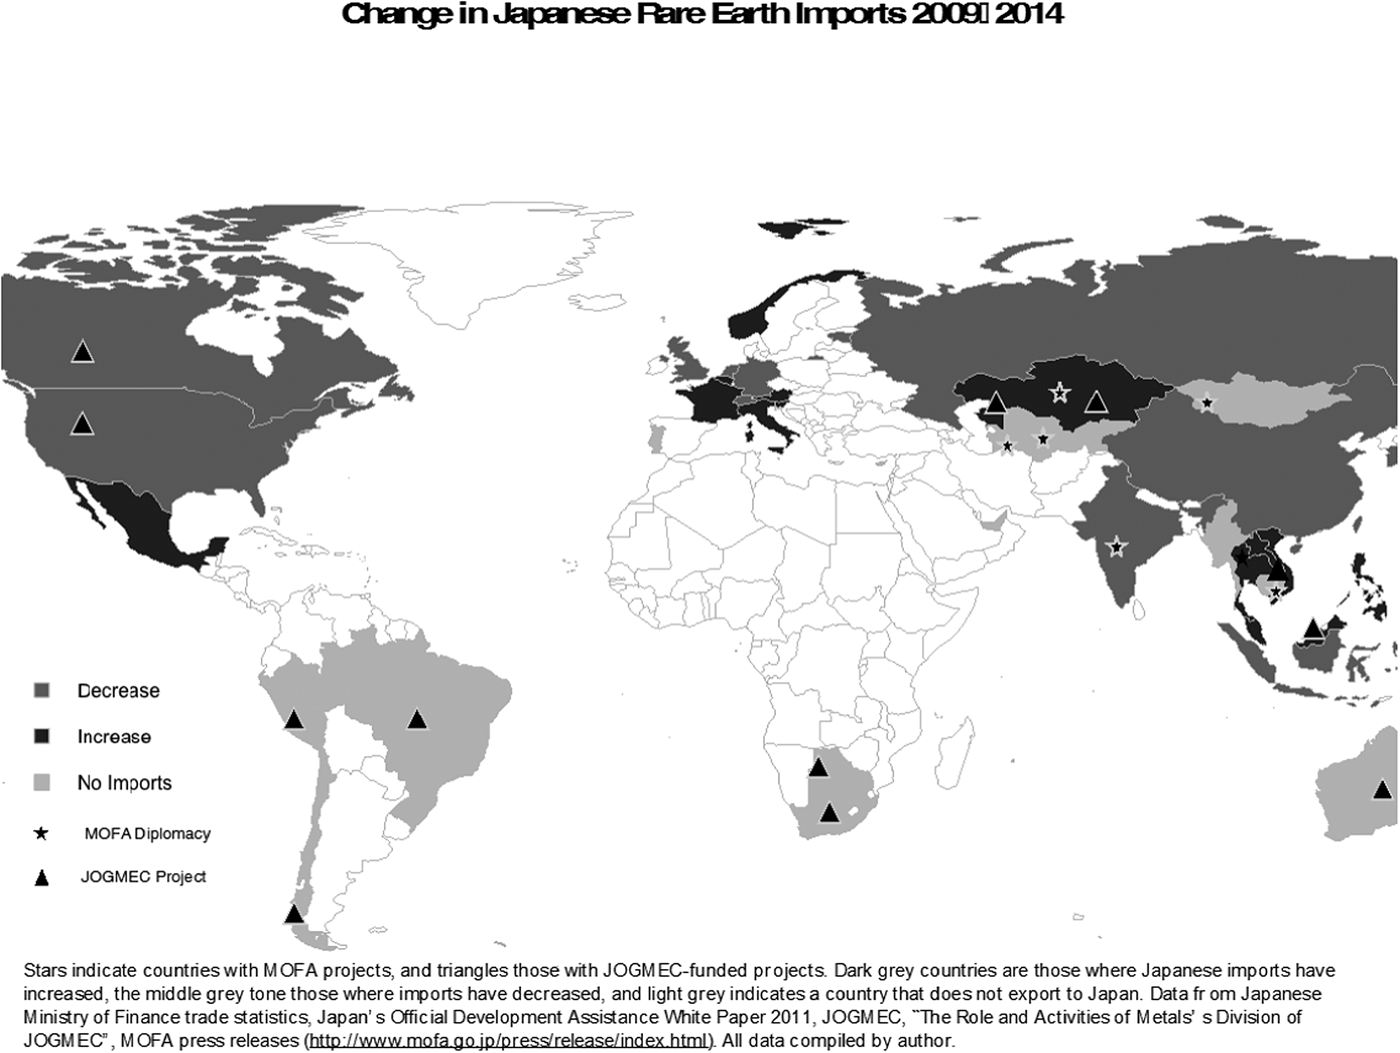
Diplomatic efforts taken by MOFA and JOGMEC to diversify supply of rare earths and the change in rare-earth imports from 2009–10 to 2013–14 are illustrated in Figure 3. The stars show diplomatic efforts by MOFA, and the triangles joint venture rare-earth exploration funded by JOGMEC. Japan's diplomatic efforts included many Central Asian countries, initially Kazakhstan and then Mongolia, and then countries participating in the 2011 Central Asia plus Japan dialogue (Kyrgyz, Tajikistan, Turkmenistan, Uzbekistan, and again Kazakhstan). They also focused in South and Southeast Asia, particularly India, Myanmar, and Vietnam. Additionally, the 2010 and 2011 Overseas Development Aid budgets allocated funds for METI to pursue rare-earth projects overseas by developing ‘infrastructure for industries and the distribution of goods in developing countries, and [securing] access to natural resources including rare earth elements’ (MOFA White Paper, 2011: 162). The JOGMEC efforts have some overlap with MOFA, particularly in Asia, but also extend to the Americas and Australia.
Japanese Ministry of Foreign Affairs rare-earth efforts.

Japanese industrial policy administered by METI also encouraged international diversification, particularly in the United States and Australia through the Molycorp and Lynas mines, respectively. On 1 October 2010, in the midst of the conflict, METI called for proposals from private firms to participate in the policy to ‘shed’ or ‘escape’ (datsu) Chinese rare earths (Nihon Keizei Shimbun, Reference Nihon Keizai2011). One hundred and ten companies and 160 projects qualified for subsidies under METI's 2010 Rare Earth policy, under four categories: 65 for decreasing the amount of rare earths used or finding substitutes; 62 for rare-earth recycling; seven for diversifying the supply of rare earths; and 26 for experimentation and facilities assessment for rare earths (METI, 2010a, 2010b). The four approaches reflect and enhance strategic actions taken by the private sector. METI offered approximately 42 billion yen ($513 million) in subsidies for rare-earth industries in order to cut Japan's reliance on China by one-third. For international diversification, companies received subsidies to either expand rare-earth sources generally or for specific metals such as tungsten or cerium (METI, 2010b).
Japanese companies also independently attempted to rapidly diversify their supply chains. Japanese companies are known for having broad and resilient international production networks, relying on multiple companies to supply either base commodities or components to a final manufactured product (Tachiki, Reference Tachiki2005; Nikkei Ecology, 2011). If one supplier fails, the companies have an alternative so they can avoid disruption in the manufacturing process. Rare earths present a challenge to this strategy due to the degree of dependence on China (Golov et al., Reference Golov, Scott, Erskine, Ali and Ballantyne2014; Abraham, Reference Abraham2015; Kennedy, Reference Kennedy, De Lima and Leal2016; Mancheeri and Marukawa, Reference Mancheeri and Marukawa2016). Abraham illustrates:
From Toshiba's perspective its rare-earth supply chain resembles a pyramid with the company on top and a network of suppliers below, but the structure may be closer to a diamond insofar as Toshiba's suppliers, and in fact all manufacturers globally, have historically relied on just one ultimate source – China (Abraham, Reference Abraham2015: 112–113).
Kennedy emphasizes this point, pointing to the extensive rare-earth value chain inside China. He points to not just mines, but also the hundreds of companies with capacity to process rare earths or manufacture specific components, and their support (direct or indirect) from the Chinese state (Kennedy, Reference Kennedy, De Lima and Leal2016: 45). Given these challenges, the support from Japan's diplomatic corps, and funding from state entities like METI and JOGMEC were vital to diversification.
An example from Kazakhstan illustrates. In June 2010, Kazakhstan's National Nuclear Company Kazatomprom and Sumitomo Corporation of Japan formed a 51/49 joint venture to establish Summit Atom Rare Earth Company (SARECO) to develop rare-earth capacity in Kazakhstan. ‘Rare earth diplomacy’ between Japan and Kazakhstan occurred in June 2010 (concurrent with the Sumitomo deal) and again in July 2011. Toshiba and Kazatomprom similarly worked on a joint venture in September 2011 following the second MOFA visit (Toshiba, 2011). Sumitomo and Kazatomprom managed to open their first production facility in 2012 (Sumitomo Corporation, 2012). Japanese companies also extended their investment efforts to Australia and Vietnam. Mitsubishi UFJ, for example, bought an almost 10% share in the Australian Lynas Group in 2011 (Fickling, Reference Fickling2011). Efforts in Vietnam include joint state-led research projects (Fuyuno, Reference Fuyuno2012), and investments from trading companies Sojitz and Toyota Tsusho, which has also advanced into India (Chansoria, Reference Chansoria2015).
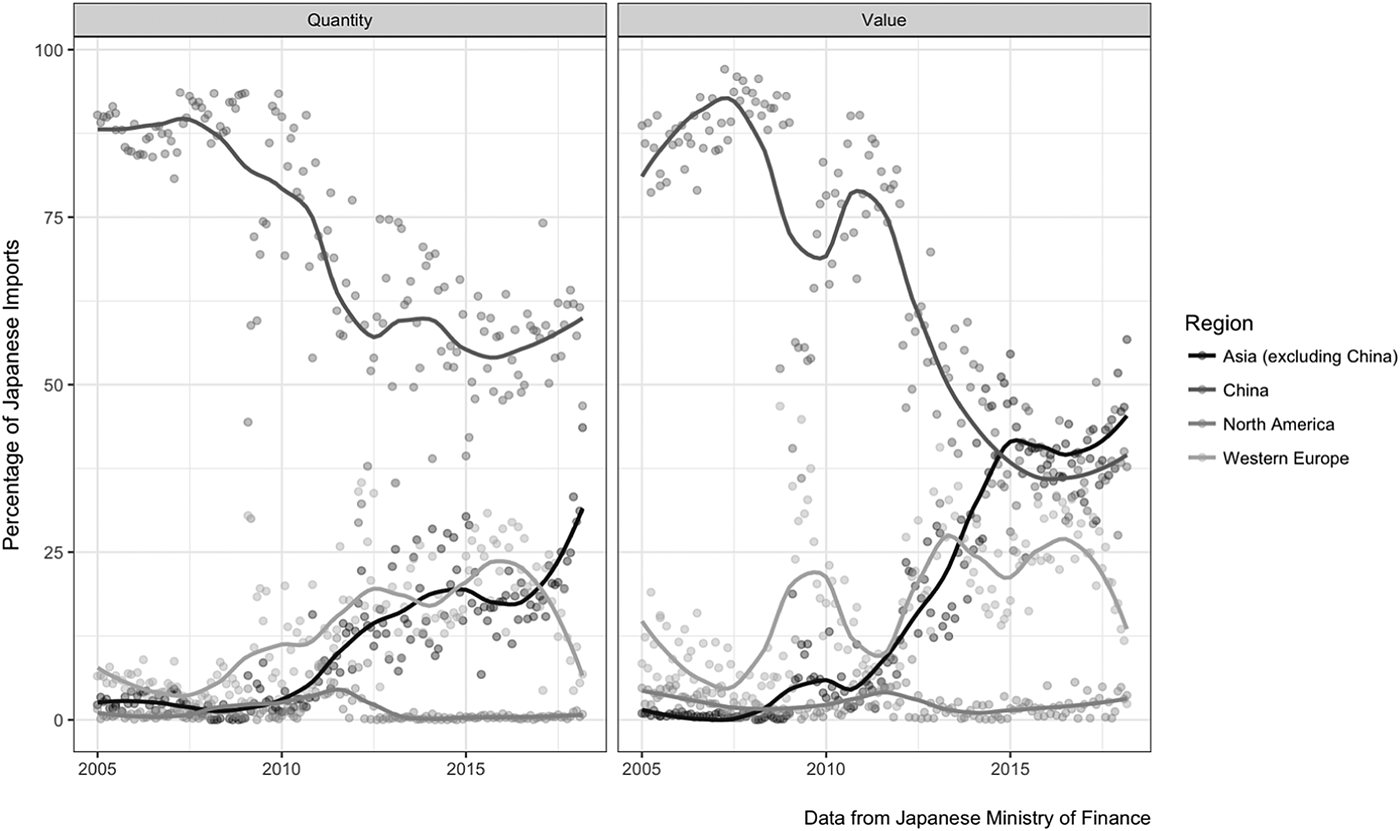
After 2009–2010, as Japanese firms began to seek alternative, non-Chinese sources, imports from Southeast and Central Asia particularly increased as seen in Figure 3. While it is difficult to precisely track the import patterns by country given the complexity of rare-earth value chains, non-Chinese Asian imports are largely driven by imports from Vietnam and Malaysia. However, many Vietnamese imports originated in Chinese mines (Abraham, Reference Abraham2015), and the Malaysian imports come from Australia-based Lynas Corporation (Lynas Corporation, 2017). To further demonstrate the success of Japan's diversification efforts, Figure 4 shows the monthly percentage of Japanese imports by quantity and volume from China, the rest of Asia, North America, and Western Europe with a smoothed trend line. In 2005–2010 upward of 90% of imports came from China. By quantity, this has decreased to around 60% in early 2018, though there is variation throughout the year. The story is even more stark when looking at the value of imports – by, value more imports now come to Japan from the rest of Asia rather than China. These figures and data strongly suggest that private and public efforts to diversify supplies were effective.
Percentage of Japanese rare-earth imports from China and other regions.

Japanese state actors such as MOFA and METI claimed that efforts to diversify supply of rare-earth metals was triggered by Chinese policy, but it is not immediately clear that the strategy was motivated by China's purported economic statecraft, and not solely by economic factors such as export quotas or price fluctuations. Simply looking at the narrative of events, or even reports from individual firms or state bureaucrats, it is difficult to determine if economic statecraft was ultimately a significant predictor of global market behavior or if it was simply an incidental event. Particularly troubling for analysis is that Chinese export quotas tightened and prices rose in the same year as the conflict. Just as CCP elites categorically denied the export ban, Japanese state and business elites had the incentive to exaggerate the effect of an export ban. If the alleged ban affects diversification in a statistically significant way while controlling for these other factors, it shows that economic statecraft can be ultimately self-defeating: it triggers behavior that undermines its goals. If not, then the export ban was epiphenomenal. In the next section, a VECM tests the varying effects of political and economic variables on diversification behavior to distinguish between these two arguments.
The statistical model tests three propositions, which provide alternative explanations for the effects of international politics and the export ban shock, trade policy and quotas, and world market prices, respectively on Japanese international diversification activity. The comparison to American rare-earth markets additionally demonstrates whether the market changes are a result of global trade patterns or due to the alleged targeted economic sanctions. The first proposition states that the political fallout from the Senkaku/Diaoyu islands dispute and the subsequent export ban of September 2010 motivated diversification efforts:
Proposition 1:
The September 2010 ‘Senkaku shock’ increased the diversification of rare-earth metals.
The ‘Senkaku shock’ – when Zhan Qixiong ran his fishing boat into the Coast Guard ship and triggered the string of events that included the incidents related to rare earths – is exogenous to the fundamentals of rare-earth markets and trade flows. The second proposition argues that international diversification increased as the supply of rare-earth metals grew increasingly constrained by export quotas:
Proposition 2:
Supply constraints from export quotas increased the diversification of rare-earth metals.
The third proposition argues that changes in rare-earth metal prices, particularly the prices in China vs the world market led firms to seek alternative sources of the metals:
Proposition 3:
Increases in the price of Chinese rare-earth metals relative to world rare-earth prices increased the diversification of rare-earth metals.
These propositions are tested using a VECM with monthly trade date from 2005 to 2014. The time series analysis captures long- and short-run trends in the economic variables, and tests if the political variable influenced diversification behavior.
3. Methods and data
The key variables measure the degree of international diversification, rare-earth prices, and quota policies. The trade data are based on nine-digit HS-codes from the Japanese Ministry of Finance (MOF) and the United States International Trade Commission (USITC).Footnote 2 The Japanese data are inclusive of 17 rare earths, with specific elements combined under similar HS-codes. For example, code 280530000 includes ‘rare-earth metals, scandium and yttrium, whether or not intermixed or interalloyed’ and the series beginning with 2846 includes ‘compounds, inorganic or organic, of rare-earth metals, of yttrium or of scandium or of mixtures of these metals’ but does not differentiate any elements other than cerium, cerium oxide, yttrium, or lanthanum (Japanese Ministry of Finance). The USITC is similar, but also collects more fine-grained import data, for example differentiating between lanthanum, cerium, praseodymium, and neodymium in the 2805300000 series. Substantively, these differences in statistical collection make no difference because in aggregate they are measuring the same commodities. They do, however, preclude finer-grained analysis of specific metals because it is impossible to ascertain in the Japanese data which precise elements are being imported.Footnote 3 The American data include domestic production numbers of rare-earth elements as reported by the US Geological Survey to include potential domestic diversification efforts.Footnote 4
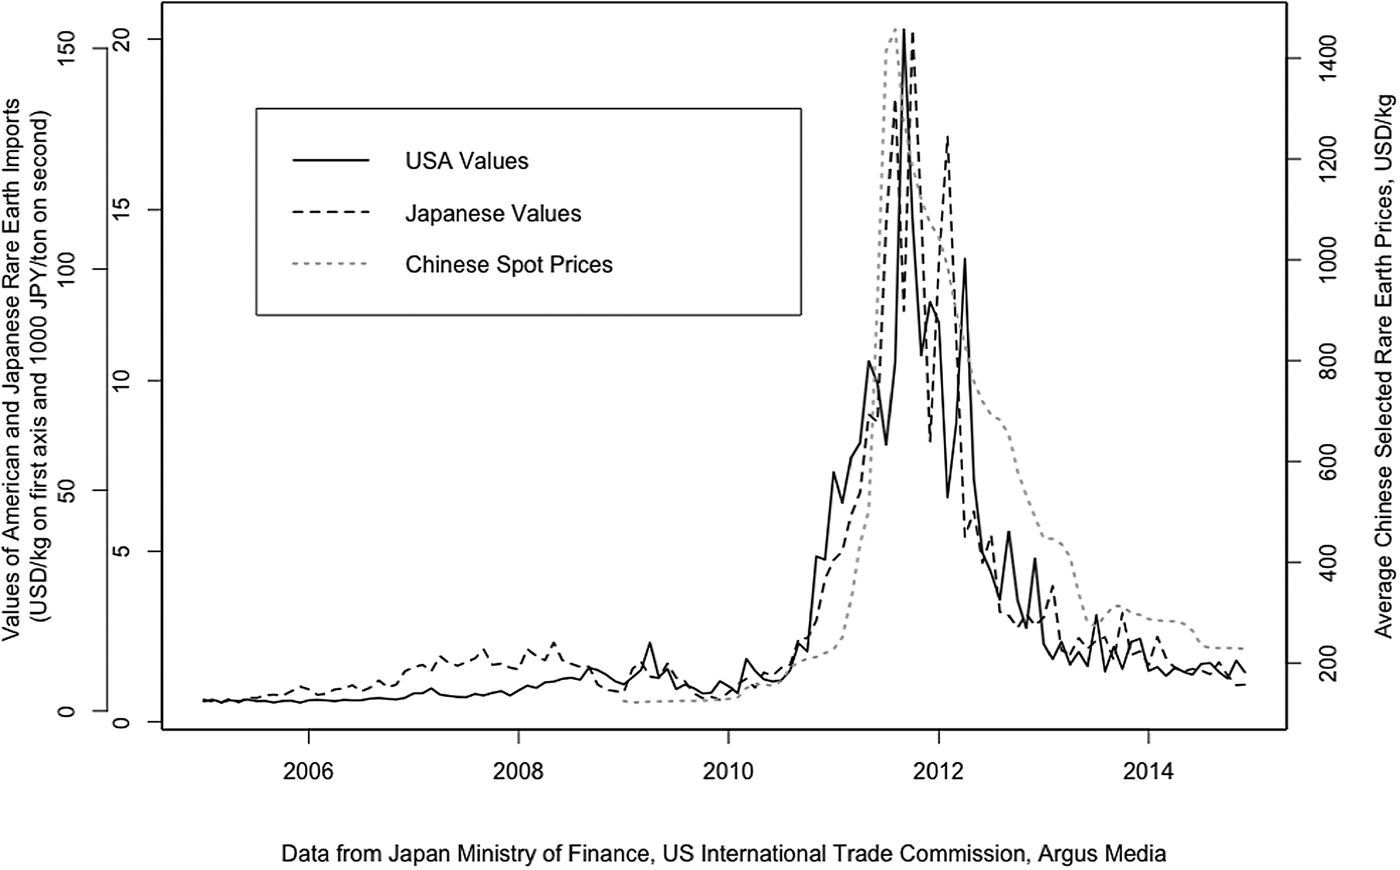
The key outcome variable, the degree of international diversification, is measured using the normalized HHI as previously defined. There are three explanatory variables: the monthly average value of Chinese rare-earth element imports relative to monthly average world values (Price), the difference between Japanese and American rare imports from China and the size of the aggregate Chinese export quota (Quota), and the exogenous political intervention of the export ban in September 2010 (Export Ban). The trade data from both countries include both quantity and value of the imports, allowing a simple calculation of the price trend of rare-earth elements in both markets (trade value/trade quantity). Figure 5 shows the price trends over time for imports, and compares those numbers to average spot prices of selected rare-earth elements from Argus Media (various years).Footnote 5 The variables track closely together indicating that the values of the imports as reported by the MOF and USITC are an accurate reflection of global rare-earth prices. Following years of low and stable prices, there is a dramatic price spike in summer 2011. Values of Japanese and American imports are notably lower than average rare-earth prices, reflecting that firms in both countries have a higher demand for the less expensive elements. Because the trade data do not differentiate between elements, it is impossible to closely track demand here, but this research should be pursued in the future.
Value and price of rare-earth elements.

The logic behind the Price variable is straightforward: firms will seek the lowest prices available for their sourcing needs. When Chinese rare-earth metal prices are relatively higher than the world average (when the variable Price is greater than 1), diversification (the HHI) will increase. When Chinese prices are relatively lower than the world average (the variable is <1), then it is expected that firms will import rare-earth metals from China and diversification will decrease.
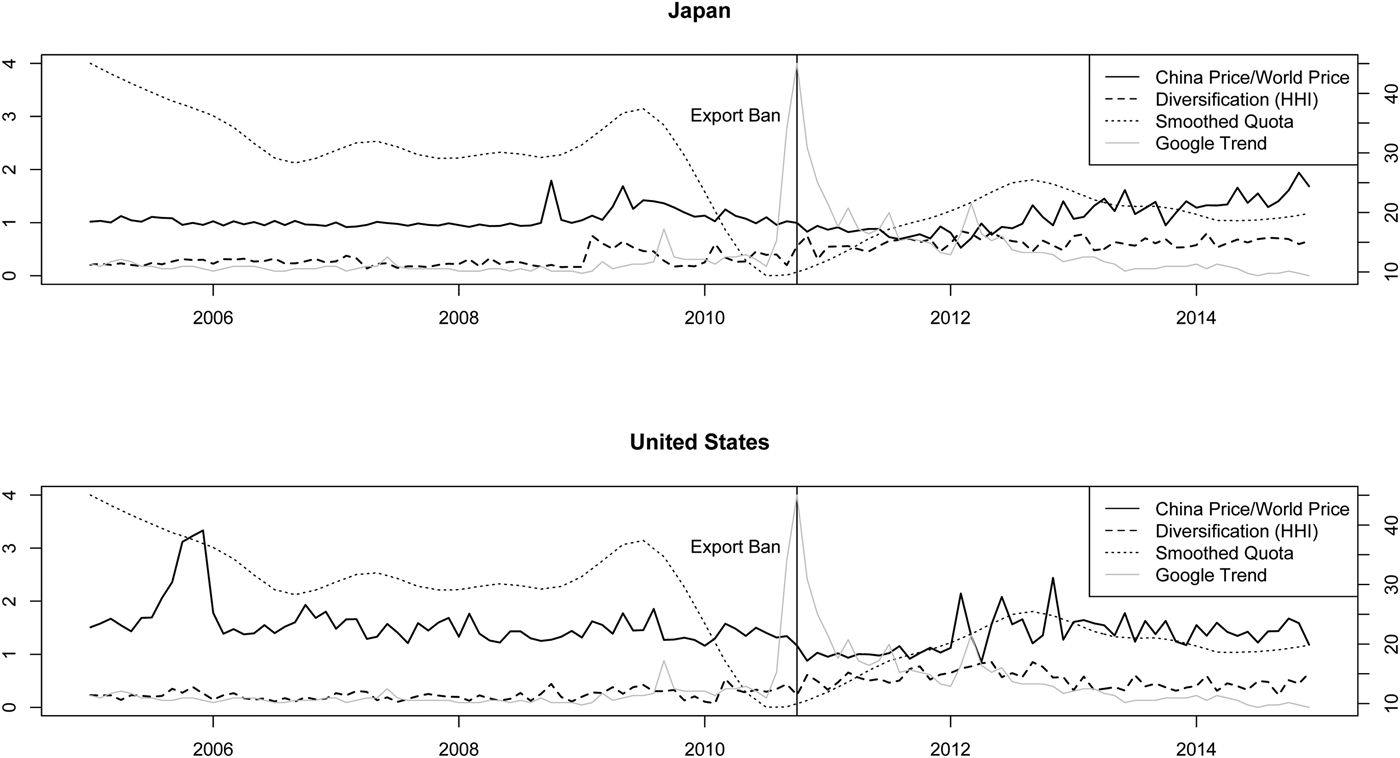
The export quota variable is the difference between the quota as reported by the Chinese Ministry of Commerce and the year-to-date quantity of exports from China. As importing firms approach or reach export quotas, it is predicted that firms will seek alternative sources of rare-earth metals due to restrictions from the Chinese side. As the variable approaches zero (and the supply of rare-earth metals available for export shrinks), diversification should increase. This variable is seasonal as it resets at the beginning of each year and are smoothed into a trend line using loess smoothing.Footnote 6 A visual check of the price and HHI series (see Figure 6) confirms that the two time series move together through summer of 2010 for Japan, and fall of 2010 for the United States, and then they appear to diverge. 2010 was also the year importers came the closest to hitting the quota limit, complicating the analysis as it is the same year as the geopolitical shock.
Prices, diversification, and quotas, 2005–2014.

The export ban is measured in two ways: a time-period dummy and a measure of media attention about rare-earth elements using Google trends. Using a dummy variable (coded 0 before the ban and 1 after) is a standard approach to modeling an exogenous intervention, but this measurement strategy does not account for other possible exogenous confounding factors after 2011. The Google trends variable is a measure of attention paid to a particular topic, in this case ‘rare-earth elements.’ A 0 indicates no interest and 100 the highest level of interest. Google trends shows a spike at the export ban, followed by quickly declining interest with a smaller spike in March 2012 when the United States introduced a WTO dispute against China for the export quotas. Google trends are an alternative way to capture this political intervention that is more sensitive to potential confounding variables.Footnote 7 These variables are plotted in Figure 6 for both the Japanese and United States trade data.
3.1 Vector error correction model
The effects of the extraneous political shock, as well as the endogenous diversification, price, and quota shifts are estimated using a VECM on monthly trade date from 2005 to 2014, with an intervention analysis to evaluate the causal direction and temporal nature of the importing dynamics. The three endogenous series plausibly move together, and share a time-invariant mean as a whole. VECM allows exploration of the short- and long-run trends in these relationships without strong theoretical assumptions, and to do so without problems of spurious regression, or statistically significant relationships where none should exist. VECM can be used when there is not a strong theoretic case to be made for strict unidirectional causality (Sims, Reference Sims1980; Freeman et al., Reference Freeman, Williams and Lin1989; Enders and Sandler, Reference Enders and Sandler1993; Wood and Peake, Reference Wood and Peake1998; Haber and Menaldo, Reference Haber and Menaldo2011). There are not strong theoretical reasons to assume the independent movement of price, the quota limit, or international diversification, just as there is no reason to believe the ‘Senkaku shock’ trigger for the alleged export ban was a reaction to rare-earth markets.
Multivariate time series such as vector autoregression relies on the assumption that the temporal processes are stationary, or that the mean of the series does not vary over time. Diagnostic tests on the variables indicate non-stationarity; the mean does vary over time.Footnote 8 When non-stationary variables are cointegrated – some linear combination of non-stationary time series produces a stationary time series – as these are, a VECM is an appropriate approach (Box-Steffensmeier and Smith, Reference Box-Steffensmeier and Smith1998). Cointegration is not uncommon in economic processes, as the market mechanism ensures ‘that they cannot drift too far apart, for example interest rates in different parts of a country, or gold prices’ (Granger, Reference Granger1981: 128). A Phillips–Ouliaras test for cointegration between diversification, price, and quota indicates that diversification, price, and quotas are cointegrated with 99% confidence (Phillips and Ouliaris, Reference Phillips and Ouliaris1990), and a Johansen cointegration test shows that market diversification, price changes, and quota limits do share a common long-run trend (Johansen, Reference Johansen1988, Reference Johansen1995). VECM is thus an appropriate method for substantive reasons as well as methodological ones. I estimate the degree of diversification as follows:
 $$\Delta Y_t = \gamma + \sum\limits_{\,j = 1}^{k-1} {{\rm \Gamma} \Delta Y_{t-j} + \alpha {\beta} ^{\prime}Y_{t-k} + \varepsilon _t} $$
where Y t is the vector of variables and Δ the first difference of them. Γ indicates how the model adjusts for short-term differences in the cointegrated variables. The αβ ′ is a matrix where α models the speed of adjustment and β ′ is a vector of cointegrating terms that makes the series stationary. γ is the linear component of the trend, and k the lag structure. The last term represents error.
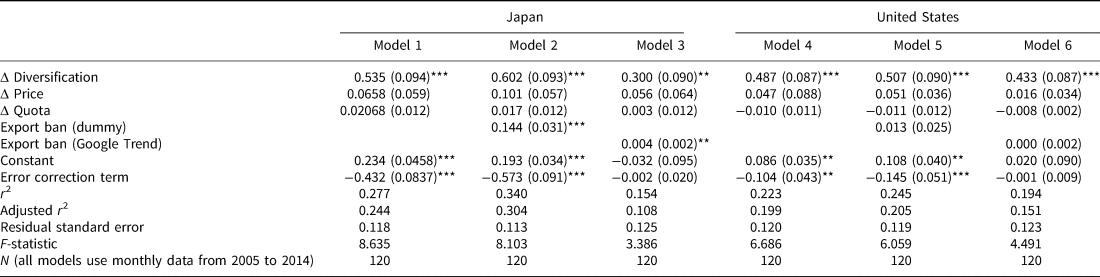
A Zivot–Andrews test for structural breaks indeed indicates that the diversification series indeed has a structural break immediately following the export ban (November 2010) with 95% confidence. Diagnostics tell us that diversification, price, and quota series are I(1) stationary and cointegrated processes, and that the diversification series contains a structural break in November 2010. Models 1–3 use the Japanese data, and models 4–6 American data, for six restricted vector error correction ordinary least squares models with cointegration rank r = 1. Models 1 and 4 contain only the three endogenous economic variables, models 2 and 5 add the Senkaku shock dummy, and models 3 and 6 use the Google trend measurement. The coefficients measure the rate at which short-term changes in the variables affect the long-run equilibrium of the cointegrated series.
4. Results
The results of the six models are shown in Table 1. Consistent with expectations, prior diversification indeed drives future diversification across all models, showing that as countries find new sources of rare-earth elements (international or even domestic in the case of the United States), they are able to maintain and develop a more diverse supply chain. The quota limit is also significant at the 0.05 level, in the direction expected: as exports reached the quota level diversification increased. Models 2 and 3 add an exogenous export ban shock. Model 2 shows that controlling for quotas and prices, the export ban had a strongly significant and positive effect on the Japanese HHI, demonstrating that Japanese diversification activity increased following the ban and providing support for Proposition 1. Model 3 with the Google trend has the same result. Combined with the structural break in the data at the time of the export ban, and the differences in the underlying dynamics of the post-ban series suggested by the diagnostic tests, these results suggest a durable change in Japanese firms’ diversification activity. The statistical analysis provides strong evidence that the export ban had a strong effect on the diversification behavior of Japanese firms, independent of Chinese quota policy or the economic factor of price.Footnote 9
Restricted vector error correction results for diversification

Significance codes: 0.001 ‘***’; 0.01 ‘**’; 0.05 ‘*’; 0.1 ‘.’; 1.
Quotas, surprisingly, were not significant after controlling for the export ban. In interviews with officials at the METI as well as large Japanese firms, it was largely assumed that the imposition of the tight quota system was partially driving diversification behavior. These results to the contrary suggest that diversification patterns were not correlated with an imposition of quotas, but rather geopolitics. One possible interpretation of this finding is the role of illegal mining although firm evidence is lacking. The Chinese government knows from differences in their official statistics that the export of illegally mined rare-earth metals is significant. In 2011, they reportedly seized 769 tons of smuggled rare-earth metal products (Situation and Policies, 2012: 30). Industry exports additionally estimate that almost half of rare-earth exports were from illegal mines prior to 2010 (Bradsher, Reference Bradsher2010b), and even after the alleged export ban imbroglio the numbers remained high (Abraham, Reference Abraham2015: 103–104). The large amount of the total supply potentially coming from illegal sources could explain why the quotas do not significantly increase international diversification. Nevertheless, given the degree to which Japanese government officials and firms emphasized the quotas, it is a startling result. The role of illegal rare earths also applies to Johnston's (Reference Johnston2013) argument that there was never a rare-earth export ban because there were no significant changes in imports to Japanese ports. Smuggled rare-earth metals, however, could have smoothed out the statistics.Footnote 10 An additional possibility is the existence of a temporal gap between when firms (or states) want to diversify and have the ability to do so. Rare-earth diversification is difficult, and the imposition of export quotas was troubling for business actors. The broader examination of Japanese data gives a fuller picture of trading behavior and how news of an export ban, at the very least, was a catalyst for change.
Models 4, 5, and 6 examine the United States data using the same approach as the Japanese trade data. In all three of these models, only prior diversification is significantly predictive of a higher HHI. The alleged export ban is not significant, and neither is the quota limit. These results – that the period around the geopolitical conflict was significant for Japanese behavior and not for American behavior – strongly suggest that the perceived risks from China's coercive economic statecraft were a driving force in the target state's subsequent behavior.
5. Conclusion
Amid tensions that increased risk perception for Japanese firms operating in China, multinational companies’ interpretations of opaque Chinese policy dictated response. Export quotas, industrial rationalization, the Chinese monopoly in production and advantages in technology, and the lack of natural or synthetic alternatives contributed to a heightened risk perception of firms with regard to rare-earth metals, making their use as a tool in economic statecraft more potent. Even the perception that rare-earth metals were used as diplomatic leverage was deeply troubling. After news of an export ban was strewn across headlines, Japanese firms and the state reacted as if China used its monopoly power to send a costly signal: perceived political risk was the most salient variable in predicting future diversification behavior. The powerful reaction to the threat of limited supplies of rare earths, both in Japan and in the United States, demonstrated the potential power of using a natural resource for political leverage. This approach, of course, also comes with its own risks as the target state is not a passive recipient.
The reaction of Japanese actors, however, ultimately showed the failure of economic statecraft as a political or economic strategy. Japanese actors, in particular, interpreted China's actions through a foreign policy lens and had an active economic response to China's economic sanctions. Japanese state and private actors quickly mobilized to overcome the sanctions using private capital, diplomatic tools, and industrial policy. They were ultimately confident enough in their diversification efforts that the threat of economic exclusion from China was defanged. From almost complete dependence of over 90% of imports, China now controls <60%.
Diversification policy was successful in part because of how firms utilizing rare earths are embedded in their global supply chains. The firms could seek alternatives for a resource in Australia, process it in Malaysia, and then insert the metal into a component in yet a third, fourth, or fifth country. They are able to shift one part of their supply chain while maintaining the rest of the network. Global supply chains thus seem to lower the costs of economic sanctions to the target state, a proposition that needs to be researched further.
The dynamics of China's rare-earth policies also have geopolitical implications. Actions taken to overcome China's resource monopoly have deepened international alliances between Japan and its new partner countries in rare earths. These alliances will bring new technology and skills to Japan's allies, and new trading relationships for all countries involved. Some of these countries – Kazakhstan, India, Vietnam, Burma, and Mongolia – neighbor China, further complicating Japan's relationship with its powerful neighbor. Japan's dual internationalization strategy of diplomacy followed by private sector investment from trading companies, in conjunction with industrial policy, seems to be bearing fruit. Rare-earth supplies are increasingly diversified for Japan, and the new production and refining sites pursued by Japanese general trading companies throughout the world will likely continue that trend.
There are also broader geopolitical lessons from China's control of rare-earth metals. The vulnerability from dependence on one country for a critical resource has arguably led to greater regional competition as Japan forges new alliances with China's neighbors (e.g., Ishida, Reference Ishida2013; Chansoria, Reference Chansoria2015). China's control of rare-earth metals is threatening: economically, but also with respect to security concerns. It remains to be seen whether these new economic alliances and search for new supplies of scarce resources will greatly exacerbate existing political tensions as Ting and Seaman (Reference Ting and Seaman2013) suggest or settle into a more globalized rare-earth market without attendant security considerations. It is clear that even purely economic decisions made by a rising China are filtered through a political lens. Even though the United States has not diversified its rare-earth supplies as aggressively or consistently as Japan, the rhetoric and political discussion in the United States are strong, treating China's activities as another ‘China threat’. Economic statecraft, rather than ameliorating a political conflict, in fact exacerbated it.
Kristin Vekasi is an Assistant Professor in the Department of Political Science and the School of Policy and International Affairs, University of Maine, 5754 North Stevens Hall, Orono, Maine 04469