I. INTRODUCTION
Photocatalysts have attracted much attention for environmental remediation and converting photon energy into chemical energy.Reference Wang, Maeda, Thomas, Takanabe, Xin, Carlsson, Domen and Antonietti1–Reference Kubacka, Fernández-García and Colón3 Semiconductor TiO2 photocatalyst, which offers powerful oxidation in the treatment of bioresistant organic contaminants such as dye waste water and water splitting.Reference Akurati, Vital, Dellemann, Michalow, Graule, Fetti and Baiker4,Reference Wang, Miyauchi, Ishikawa, Pyatenko, Koshizaki, Li, Li, Li, Bando and Golberg5 Nevertheless, the photocatalytic activity of TiO2 is not high enough to meet the need of industrial use due to the rapid recombination of photogenerated electrons and holes. Therefore, a tremendous effort is in progress to improve its photocatalytic performance, including metal or nonmetal ions doping and combination with semiconductors into heterojunctions.Reference Feng, Wang, Zheng, Zhang, Fan, Liu, Amoureux and Deng6,Reference Rawal, Sung and Lee7 Doping with metal elements (such as Fe, V, Ag, etc.)Reference Choi, Termin and Hoffmann8–Reference He, Yu, Hu and Larbot10 and nonmetallic elements (such as B, N, F, etc.)Reference Asahi, Morikawa, Ohwaki, Aoki and Taga11–Reference Feng, Zheng, Wang, Ren, Gao, Liu, Shen, Chen and Deng13 are the most common approaches. Recently, the rare-earth elements europium (Eu) and gadolinium (Gd) were found to be good dopants for enhancing the photocatalytic activity of TiO2Reference Chen, Zhu, Lv, Deng, Zhou and Deng14 and some bismuth-based photocatalysts, e.g., Bi2WO6 and BiFeO3.Reference Tian, Zhang and Zhang15,Reference Guo, Fang, Dong, Zheng and Shen16 BiPO4, discovered recently as an oxoacid salt photocatalyst, exhibits more attractive activity than that of TiO2 (P25).Reference Pan and Zhu17 To the best of our knowledge, few efforts have been made to investigate the influence of doping on the photocatalytic activity of BiPO4. Though the structures and polymorph-sensitive luminescence properties of Eu-doped BiPO4 were reported recently,Reference Zhao, Li, Li, Yang and Zheng18 the photocatalytic activity of rare earth metal-doped BiPO4 was not measured.
In this work, the Eu3+- and Gd3+-doped BiPO4 microcrystals were synthesized by a facile hydrothermal method. The crystal structure, micromorphology, and optical properties of the materials were characterized. The photocatalytic activities of methylene blue (MB) photodegradation were investigated. To further understand the photocatalytic mechanism of Eu3+- and Gd3+-doped BiPO4 composites, the effects of Eu3+ and Gd3+ doping concentration on the photocatalytic activity were discussed.
II. EXPERIMENTAL
A. Preparation
Pure BiPO4, Eu3+- and Gd3+-doped BiPO4 were synthesized by a hydrothermal process. All chemicals were used as received, without further purification. Three millimoles of Bi(NO3)3·6H2O and equal molar NaH2PO4·2H2O were mixed in a beaker. Then, 30 mL of distilled water was added to the beaker and magnetically stirred to form a homogeneous solution at room temperature. The resulting precursor suspension was transferred into a 50 mL Teflon-lined stainless steel autoclave and maintained at 160 °C for 24 h. The products were washed several times with distilled water and dried at 80 °C for 24 h, subsequently. Eu3+- and Gd3+-doped BiPO4 were synthesized using the above procedure but Bi(NO3)3·6H2O was partially replaced by Eu(NO3)3·6H2O and Gd(NO3)3·6H2O to obtain samples of EuxBi1−xPO4 (x = 0.5, 1, 1.5, 2, 3, and 5%) and GdxBi1−xPO4 (x = 1, 3, 4, 5, 6, 7, and 10%).
B. Characterization
X-ray diffraction (XRD) was performed on a Bruker D8 ADVANCE x-ray diffractometer (Karlsruhe, Germany) with Cu Kα radiation (λ = 1.5418 Å). The scanning step width of 0.02° and the scanning rate of 0.2 S−1 were applied to record the patterns in the 2θ range of 10–70°. The scanning electron microscopy (SEM) images were taken with an S-4800 electron microscope (Tokyo, Japan). A Varian 710-ES (Varian, Shanghai, China) inductively coupled plasma optical emission spectrometer (ICP-OES) with Sepex Certiprep standards was used to analyze the element of composition of the microcrystals. UV-vis spectra were obtained with sample powder from a PerkinElmer Lambda 35 UV-vis spectrometer (Tokyo, Japan). The spectra were collected at 200–1000 nm and referenced to BaSO4.
C. Photocatalytic evaluation
Photocatalytic activities of undoped BiPO4 and doped BiPO4 were evaluated by degradation of MB under ultraviolet light irradiation of a 300-W high-pressure mercury lamp. Powder photocatalyst (50 mg) was dispersed into 100 mL of dye solution (10−5 mol/L). Before illumination, the photocatalyst powder and dye solution were vigorously stirred in the dark for 1 h to achieve the adsorption–desorption equilibrium of suspensions. After that, the light was turned on, and 2 mL of the suspension was taken at certain intervals and separated through centrifugation. The UV-vis spectra of the centrifuged solution were recorded using a U-3010 spectrophotometer.
III. RESULTS AND DISCUSSION
A. Characterization of structures of Eu-doped and Gd-doped BiPO4
The crystal structures of monoclinic BiPO4, EuPO4, and GdPO4 have been shown in Figs. 1(a)–1(c), respectively. They all crystallize in the monoclinic space group P2/n and possess similar unit cells and structural configurations, which are constructed by MOn (M = Bi, Eu, and Gd) polyhedra and PO4 tetrahedra. The XRD patterns in Fig. 2 show that all samples including BiPO4, EuPO4, GdPO4, Eu-doped and Gd-doped BiPO4 are single phase and have a homogeneous crystal structure with monoclinic symmetry. However, compared with BiPO4, there is a shift to high 2θ angle for the XRD patterns of EuPO4 and GdPO4. As displayed in Fig. 3, the diffraction peaks of Eu-BiPO4 [Fig. 3(a)] and Gd-BiPO4 [Fig. 3(b)] in the low-angle and high-angle ranges all gradually shift to larger angles corresponding to the reduction of unit cell or interlayer spacing compared to BiPO4. In other words, the diffraction peaks of doped samples are gradually approaching that of pure EuPO4 and GdPO4 with increasing doping concentrations of Eu3+ and Gd3+, which suggests that Eu3+ and Gd3+ partially substitute for Bi3+ and are incorporated into the BiPO4 crystal lattice.
Crystal structures of (a) BiPO4, (b) EuPO4, and (c) GdPO4 with Bi/Eu/Gd-O polyhedra and PO4 tetrahedra.

XRD patterns of (a) Eu/BiPO4 and (b) Gd/BiPO4.
XRD patterns of (a) Eu/BiPO4 and (b) Gd/BiPO4 in low-angle and high-angle ranges.
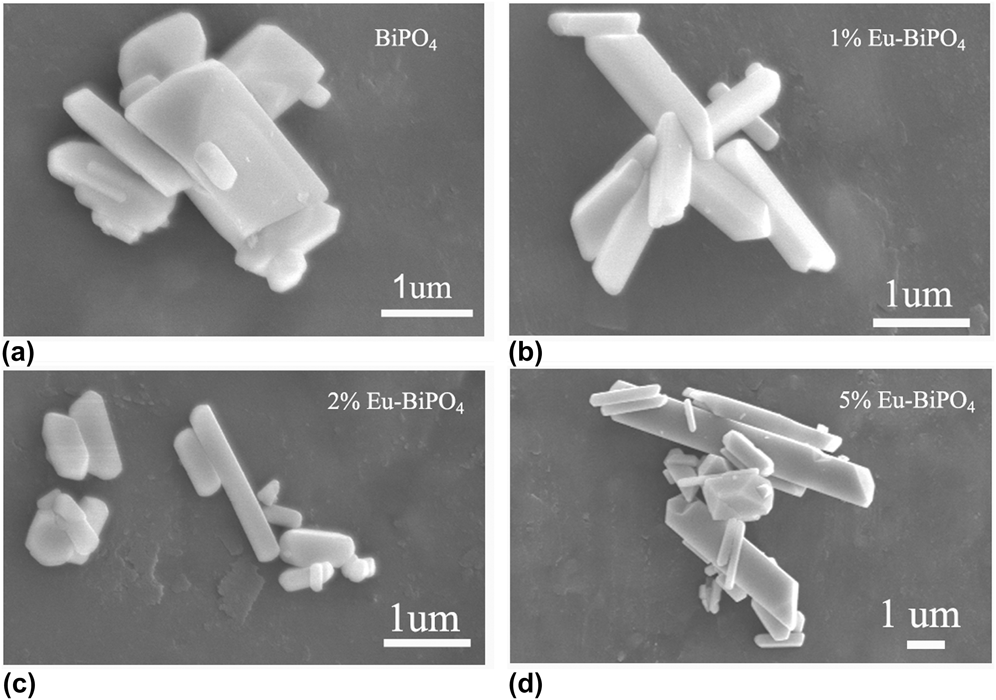
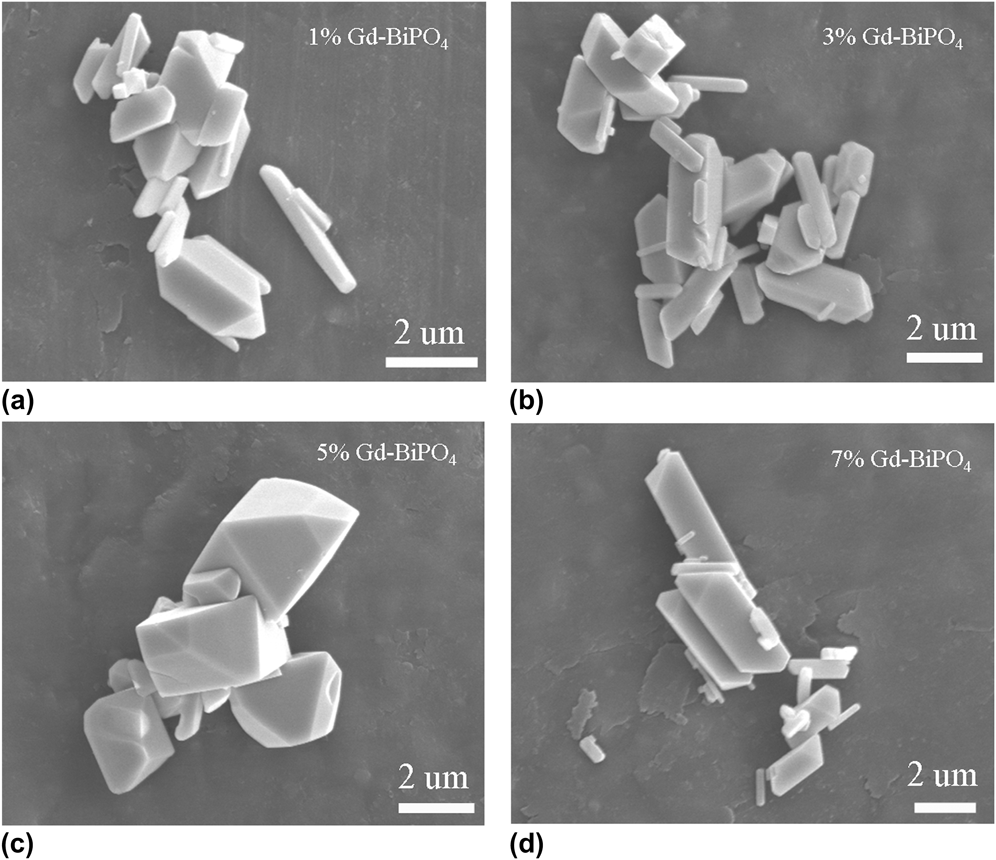
The surface morphologies and particle sizes of the pure BiPO4, Eu/BiPO4, and Gd/BiPO4 composites were observed using a SEM. Figure 4(a) presents an image of the pure BiPO4, which shows that the product consists of nanorods of 200 nm–1 μm diameters and lengths ranging from 200 nm to 1.5 μm. Figures 4(b)–4(d) show the images of 1, 2, and 5% Eu/BiPO4, respectively. It can be seen that the lengths of the nanorods gradually increase with increasing dopant concentration. When the doping content was 1% [Fig. 4(b)], the average size of the nanorods was about 1 μm, and the lengths grow to 3–5 μm when the doping concentration was increased to 5% [Fig. 4(d)]. The influence of doping by Gd3+ on the morphologies and particle sizes is shown in Fig. 5. The SEM images of Gd-doped BiPO4 with doping content of 1, 3, 5, and 7% are shown in Figs. 5(a)–5(d), respectively. It is very interesting to note that the presence of Gd3+ significantly influenced the morphology of the samples, and the content of Gd3+ plays an important role in controlling the morphology and surface. When the dopant content increased above 1% [Fig. 5(a)], a few exposed crystal facets start to appear. With the doping concentration is, e.g., 3% [Fig. 5(b)], the amount of crystal facets exposed increases and the aspect ratio of the samples gradually decreases. When the Gd3+ doping content was 5%, the as-grown microcrystals of novel morphology were obtained. As shown in Fig. 5(c), the products exhibit terrace-like morphology with explicitly inclined plane. As the dopant concentration increased further, the particles were similar to those displayed by the low Gd3+ doping concentration and the nanorods were obtained again [7% Gd-BiPO4 depicted in Fig. 5(d)].
SEM images of (a) pure BiPO4 and Eu-doped BiPO4 with dopant content (b) 1%, (c) 2%, and (d) 5%.
SEM images of Gd-doped BiPO4 with dopant content (a) 1%, (b) 3%, (c) 5%, and (d) 7%.
To confirm the doping concentration, ICP elemental analyses were performed on 1% Eu/BiPO4 and 5% Gd/BiPO4 samples. The results showed that the molar ratios of Eu/Bi 1:97.6 and Gd/Bi 1:19.2 are in accordance with the expected values.
B. The optical properties of Eu-doped and Gd-doped BiPO4
Figure 6 shows the diffuse reflectance absorption spectra (DRS) of the Eu-doped and Gd-doped BiPO4 microcrystals. Compared with pure BiPO4, all of the doped samples show a certain degree of blue shift from the figures, indicating that Eu3+ and Gd3+ doping can evidently enlarge the band gap of BiPO4. Among the doping series, 1% Eu/BiPO4 and 4% Gd/BiPO4 possess the widest band gap. The band gap (E g) values estimated from the main absorption edge of the UV-vis absorption spectra were 3.89, 4.02, and 3.97 eV for samples of BiPO4, 1% Eu/BiPO4 [Fig. 6(a)], and 4% Gd/BiPO4 [Fig. 6(b)], respectively. The sample of 5% Gd/BiPO4 exhibits a band gap of 3.93 eV [Fig. 6(b)].
UV-vis absorption spectra of (a) Eu/BiPO4 and (b) Gd/BiPO4 samples.
C. Photocatalytic activities of Eu-doped and Gd-doped BiPO4
The photocatalytic activities of the as-prepared samples were evaluated by the degradation of MB. Figure 7(a) shows the photocatalytic performance of the as-prepared samples of Eu-doped BiPO4. Compared with pure BiPO4, the 1% Eu/BiPO4 sample exhibits the highest photocatalytic activity, and the photodegradation efficiency of MB was 92% after 25 min of reaction, while 24% MB remains in the reaction by pure BiPO4. The MB concentrations versus the reaction time catalyzed by Gd-doped BiPO4 are plotted in Fig. 7(b). It can be obviously seen that the Gd-doped BiPO4 with different doping concentrations all showed higher photocatalytic activity than pure BiPO4. Among these, 5% Gd/BiPO4 displays the highest photocatalytic activity with photodegradation efficiency of 93% in 20 min. To compare the degradation rate quantitatively, the pseudo-first-order kinetic curves of MB photodegradation was also plotted [Figs. 7(c) and 7(d)]. As shown in Fig. 7(c), the experimental data shows the apparent rate constants k of 0.06, 0.057, 0.127, 0.063, 0.078, 0.059, and 0.066 min−1 for pure BiPO4, 0.5, 1, 1.5, 2, 3, and 5% Eu/BiPO4, respectively. From Fig. 7(d), the apparent rate constant is 0.116, 0.13, 0.133, 0.16, 0.122, 0.104, and 0.09 min−1 for Gd/BiPO4 with doping content 1, 3, 4, 5, 6, 7, and 10%, respectively. Thus, 1% Eu/BiPO4 and 5% Gd/BiPO4 possess the highest photocatalytic activity and are about 2 and 2.7 times more effective than pure BiPO4, respectively, which indicates that europium and gadolinium dopants effectively improve the photocatalytic activities of BiPO4 microcrystals.
Photocatalytic performance of (a) Eu/BiPO4 and (b) Gd/BiPO4, and kinetic fit for the degradation of MB in the presence of (c) Eu/BiPO4 and (d) Gd/BiPO4 samples under UV light.
The different photocatalytic mechanisms of Eu/BiPO4 and Gd/BiPO4 photocatalysts are proposed. In the Eu/BiPO4 photocatalysts, the increased activity may be due to trapping of photogenerated electrons by Eu dopant, thereby reducing the extent of electron–hole recombination.Reference Tian, Zhang and Zhang15 In the whole process, considering the standard redox potentials of Eu3+/Eu2+ and O2/ ${\rm{O}}_{\rm{2}}^ -$ (E0 (Eu3+/Eu2+) = −0.36 V and E0 (O2/
 ${\rm{O}}_{\rm{2}}^ -$) = 0.0338 V), surface electrons could be trapped by the Eu3+ ion to form a reduction species Eu2+ ion, and the adsorbed oxygen was present in the system, so the Eu2+ could be oxidized back to Eu3+. As a result of the cyclic reactions, the electron hole recombination rate could be reduced. In addition, from the DRS results, the 1% Eu/BiPO4 exhibits the most significant blue shift compared to pure BiPO4 and other Eu-doped BiPO4 samples, indicating that 1% Eu-doped BiPO4 possesses the largest band gap so as to inhibit the recombination of photogenerated electron and hole.Reference Chen, Zhu, Lv, Deng, Zhou and Deng14 However, for higher doping concentration of europium, reduction of Eu3+ to Eu2+ by the photogenerated electrons is expected to be faster than the photocatalytic oxidation reaction by oxygen, since the former is simply a direct transfer of the trapped electron from Eu3+ to the valence band hole.Reference Colon, Lopez, Hidalgo and Navio19 In that case, the excess Eu species may act as a recombination center or may cover the active sites on the BiPO4 surface and thereby reduce the efficiency of charge separation.
Different from that of Eu/BiPO4, the enhanced photocatalytic activity of Gd/BiPO4 is proposed to relate the morphologies of BiPO4 microcrystals. As revealed in the literature, the photocatalytic activity of the catalyst is governed by composition, crystal structure, optical band gap, and surface properties of exposed crystal facets.Reference Liu, Yu and Jaroniec20,Reference Zhao, Ma, Li, Ji, Chen, Zhu and Zhao21 From the SEM images of Gd/BiPO4, the Gd3+ dopant had significantly influenced the morphology of BiPO4 nanorods. The Gd-doped BiPO4 all exhibited morphology change and some exposed crystal facets in different degree compared with pure BiPO4 nanorods. That may be one reason that all Gd-doped BiPO4 showed higher photocatalytic activities than pure BiPO4. When the Gd3+ doping content was 5%, the microcrystals with terrace-like morphology possess the most exposed crystal facets instead of nanorods and thus display the best photocatalytic performance. Besides, Gd3+ has 7f-electrons and is half filled, and this half-filled electronic configuration is more stable. When Gd3+ ions trap electrons, the half-filled electronic configuration is destroyed and their stability decreases; the trapped electrons can easily be transferred to the oxygen molecules adsorbed on the surface of the catalysts, and the Gd3+ ions return to the original stable half-filled electronic structure. This might promote charge transfer and efficiently separate the electrons and holes by shallowly trapping electrons. Thus, Gd3+ was recommended as the most promising lanthanide due to the enhancement in the interfacial electron transfer rate.Reference Xu, Gao and Liu22 This may also be the reason for the enhanced photocatalytic activity in Gd3+-doped BiPO4.
IV. CONCLUSION
The Eu/BiPO4 and Gd/BiPO4 microcrystals were synthesized by a hydrothermal route. The photocatalytic experiments showed that most of Eu/BiPO4 samples and all Gd-doped BiPO4 samples exhibited high photocatalytic activity for the decomposition of MB. Among these, 1% Eu/BiPO4 and 5% Gd/BiPO4 displayed the highest photocatalytic activity, and the degradation rates are 2 and 2.7 times greater than pure BiPO4, respectively. The photodegradation reactions of MB by Eu/BiPO4 and Gd/BiPO4 followed first-order kinetics. The possible reasons for Eu/BiPO4 composites showing higher activity than pure BiPO4 are mostly ascribed to the trapping of surface electrons by the Eu3+ ion to reduce the recombination rate of the electron and hole, and the enhanced photocatalytic activity of Gd/BiPO4 was mainly attributed to the exposed crystal facets of BiPO4 microcrystals modified by Gd3+ ion and shallowly trapping electrons by the half-filled f-orbits.
ACKNOWLEDGMENTS
This work was supported by the Fundamental Research Funds for the Central Universities (Grant No. 2652013052) and the special co-construction project of Beijing city education committee, Key Project of Chinese Ministry of Education (Grant No. 107023).