Introduction
Amphistomes are parasitic in the digestive tracts of many vertebrates (from fishes to mammals). In ruminant animals the adult flukes are conspicuously present in the stomach and the immature ones in the small intestine, causing the disease amphistomiasis. This disease poses a major obstacle to livestock production in ruminants worldwide, especially in young animals where it causes high morbidity and mortality (Phiri et al., Reference Phiri, Chota and Phiri2007). More than 70 species of amphistomes have been reported from animals of food value from different parts of the globe (Roy & Tandon, Reference Roy and Tandon1995). Members of the amphistomid family Gastrothylacidae (Trematoda: Digenea: Echinostomida) are parasitic in ruminants throughout Africa and Asia and are characterized by the presence of a deep or shallow ventral pouch, the latter being an invagination of the genital atrium (Jones, Reference Jones, Jones, Bray and Gibson2005). In north-east India, five species of pouched amphistomes belonging to this family have been recorded so far, namely Fischoederius cobboldi, F. elongatus, Gastrothylax crumenifer, Carmyerius spatiosus and Velasquezotrema tripurensis.
The taxonomy of amphistomes is based mainly on morphological data; histological examination of median sagittal sections of adult amphistomes using features of pharynx, terminal genitalium and acetabulum has been used to discriminate them (Sey et al., Reference Sey, Prasitirat, Romratanapun and Mohkaew1997), which involves long and cumbersome procedures. In recent times, the amplification of specific DNA regions via the polymerase chain reaction (PCR) and improved sequencing techniques have been employed to resolve taxonomic issues related to various helminth parasites by utilizing genetic markers in nuclear ribosomal DNA (rDNA) and mitochondrial DNA (Blair et al., Reference Blair, Campos, Cummings and Laclette1996). The second internal transcribed spacer (ITS2) region of rDNA is particularly valuable and is one of the more frequently utilized regions for phylogenetic analyses at the genus and species levels (Itagaki et al., Reference Itagaki, Tsumagari, Tsutsumi and Chinoni2003). Recent studies have also shown the utility of the ITS2 region, in addition to its role for low-level phylogenetic analyses, in inferring phylogenies at higher taxonomic levels, due to the highly conserved core secondary structure of this region; the secondary structures have thus proven to be additional tools for use in systematic and taxonomic studies (Coleman, Reference Coleman2003, Reference Coleman2007, Reference Coleman2009; Schultz et al., Reference Schultz, Müller, Actziger, Seibel, Dandekar and Wolf2006; Selig et al., Reference Selig, Wolf, Müller, Dandekar and Schultz2008).
In the present study, we aimed to infer a molecular phylogeny using ITS2 sequence as well as secondary structures of the five gastrothylacid fluke species, which commonly prevail in the bovine livestock in north-east India.
Materials and methods
Parasite material and DNA isolation
Adult flukes were collected from the rumen of freshly slaughtered host animals, Bos indicus, at local abattoirs from Tura (25.52°N 90.22°E), Shillong (25.57°N 91.88°E) and Dharmanagar (24.37°N 92.17°E), District Headquarters in the state of Meghalaya and Tripura, north-east India. Collected materials were first preserved in 70% ethanol and then processed for DNA isolation. Total genomic DNA was isolated from single flukes individually. Flukes were first immersed in digestion extraction buffer (containing 1% sodium dodecyl sulphate (SDS), 25 mg proteinase K) at 37°C overnight. DNA was then extracted from lysed individual worms by the standard ethanol precipitation technique (Sambrook et al., Reference Sambrook, Fritsch and Maniatis1989).
DNA amplification and sequencing
The rDNA region spanning ITS2 was PCR-amplified from total genomic DNA obtained from the flukes following the standard protocol with minor modifications, as described elsewhere (Prasad et al., Reference Prasad, Tandon, Chatterjee and Bandhopadhyay2007). We used universal primers for trematodes, designed based on sequences of the 5.8S and 28S genes of Schistosoma species (Bowles et al., Reference Bowles, Blair and McManus1996):
3S (forward): 5′-GGTACCGGTGGATCACTCGGCTCGTG-3′
A28 (reverse): 5′-GGGATCCTGGTTAGTTTCTTTTCCTCCGC-3′
For DNA sequencing, PCR products were purified using the Genei Quick PCR purification kit (Bangalore Genei, Bangalore, India) and sequenced in both directions using the above-mentioned primers on an automated sequencer (Applied Biosystems 3130 Genetic Analyzer, California, USA).
ITS2 sequence analysis
The sequenced ITS2 rDNA plus flanking 5.8S and 28S sequences (ITS2+) were first annotated in order to retrieve the exact ITS2 sequences for subsequent analysis. The annotation was carried out using the ‘Annotate’ feature (default settings) on the ITS2 database (Koetschan et al., Reference Koetschan, Förster, Keller, Schleicher, Ruderisch, Schwarz, Müller, Wolf and Schultz2010). This tool uses HMMer (Eddy, Reference Eddy1998) to annotate eukaryote ITS2 sequences with Hidden Markov Models (HMMs) by identifying a 25-nucleotide interaction of the 5′ 5.8S rDNA subunit end with 25 nucleotides of the 28S rDNA subunit 3′ end (Keller et al., Reference Keller, Schleicher, Schultz, Müller, Dandekar and Wolf2009).
Sequence identity was calculated for annotated ITS2 sequences of the five gastrothylacid species with Bioedit software version 7.0.9.0 (Hall, Reference Hall1999) using ‘Sequence Identity Matrix’ from the ‘Alignment’ menu to see the occurrence of inter-specific variations among the ITS2 sequences.
Predicted ITS2 RNA secondary structures
Secondary structures of annotated ITS2 sequences were reconstructed using free energy folding algorithms with MFOLD software version 3.2 (Zuker, Reference Zuker2003). The ITS2 sequences were treated as linear and the folding temperature was set at 37°C for analysis. The structure with the highest negative free energy was chosen from different output files.
Phylogenetic analysis using sequence data
Multiple sequence alignment of the ITS2 sequences was carried out using ClustalW of Bioedit software. The resulting sequence alignment from Bioedit in FASTA format was exported to the program ProfDistS for computing phylogenetic trees (Friedrich et al., Reference Friedrich, Dandekar, Schultz and Müller2005; Wolf et al., Reference Wolf, Ruderisch, Dandekar, Schultz and Müller2008). The phylogenetic tree was constructed using the neighbour-joining (NJ) distance method with the settings Bootstraps = 1000, Distance Correction Model = Jukes Cantor. NjPlot was set as default viewer for visualizing the tree.
Bayesian phylogenetic analysis
DNA sequences were aligned using ClustalX 2.0.7 and the alignment file in NEXUS format was generated. The alignment file was imported into the program jModelTest v 0.1.1 (Guindon & Gascuel, Reference Guindon and Gascuel2003; Posada, Reference Posada2008) to determine the best-fit model of nucleotide substitution using the Akaike Information Criterion (AIC). The program returned GTR+G as the best-fit model. Bayesian phylogenetic analysis was carried out using MrBayes v3.1.2 (Huelsenbeck & Ronquist, Reference Huelsenbeck and Ronquist2001) with settings according to the GTR+G model. Metropolis-coupled Markov chain Monte Carlo (MCMCMC) sampling was performed with a combinatorial run of four incrementally heated chains for 5,000,000 generations with sampling frequency set to 100. The phylogram containing information on the Bayesian posterior probabilities indicated by the branch were generated and subsequently visualized in TreeViewV1.6.6 (Page, Reference Page1996). In addition to the sequence data set used in the previous analysis, Schistosoma mansoni sequence was included and chosen as the outgroup taxon.
Phylogenetic analysis using sequence–structure data
ITS2 RNA sequences with homologous structures in Vienna format from MFOLD were synchronously aligned using the program 4SALE (Seibel et al., Reference Seibel, Müller, Dandekar, Schultz and Wolf2006, Reference Seibel, Müller, Dandekar and Wolf2008). The alignment with structural information was exported with the resultant filename changed to a filename with the extension ‘.xfasta’ to ProfDistS for tree construction.
The alignment output file with the ‘.xfasta’ extension from 4SALE was imported into ProfDistS. ‘RNA/DNA structure Profile Neighbour Joining’ was selected from the ‘Run’ menu with the settings Bootstraps = 1000, Distance Correction Model = General Time Reversible, Ratematrix Q = Q_ITS2.txt (an ITS2 specific substitution model included as a supplemental file in ProfDistS). The resultant tree file with node strengths was viewed in ProfDistS by setting NjPlot as the default viewer.
Results
DNA amplification and sequencing
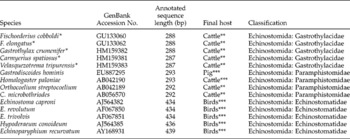
Universal primers, as mentioned above, successfully amplified the desired region spanning ITS2 (ITS2+) with sequenced product sizes of 477 bp, 520 bp, 463 bp, 464 bp and 482 bp in the case of F. cobboldi, F. elongatus, G. crumenifer, C. spatiosus and V. tripurensis, respectively (fig. 1). The sequences obtained were submitted to GenBank and their accession numbers acquired, as shown in table 1.
PCR products obtained from the five gastrothylacid species using ITS2 primers. Lanes: 1, Fischoederius cobboldi (477 bp); 2, F. elongatus (520 bp); 3, Carmyerius spatiosus (464 bp); 4, Gastrothylax crumenifer (463 bp); 5, Velasquezotrema tripurensis (482 bp); M, molecular weight marker (100 bp ladder).

Gastrothylacid species and other digenetic trematode species used in this study with their respective GenBank accession numbers for corresponding ITS2 sequences and their classification.

*Sequence generated as part of the present study; **rumen; ***intestine.
ITS2 sequence analysis
The sequences showed a 5.8S–28S rRNA gene interaction which is evidenced by the ability to produce an HMM-based annotation. The annotated ITS2 sequences were found to be 288 bp in the case of both Fischoederius and Gastrothylax species (F. cobboldi, F. elongatus and G. crumenifer) and 287 bp for those of the genera Carmyerius and Velasquezotrema (C. spatiosus and V. tripurensis).
Sequence identity matrix data revealed a considerable sequence divergence among the five gastrothylacid species, with inter-specific variations ranging from 1.4 to 4.9% (table 2). A total of two insertions/deletions, six transversions and ten transitions were found amongst the ITS2 sequences of these species.
Sequence identity matrix of the gastrothylacid amphistome species generated using Bioedit (numbers indicate percentage identities/differences (PI/PD); ID=identical).

Secondary structure analysis
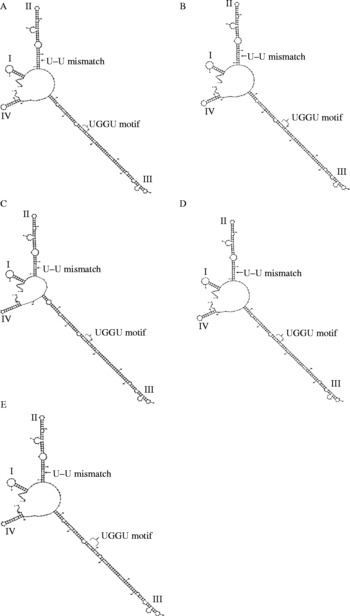
Predicted secondary structures for the ITS2 region of all the five species in the present study, analysed using Mfold, resulted in a four-helix model with calculated minimum free energies of − 120.50 kcal/mol, − 115.70 kcal/mol, − 123.60 kcal/mol, − 118.70 kcal/mol and − 117.20 kcal/mol, respectively (fig. 2). Helices I and IV of this model were found to be relatively short, each comprising fewer than 30 nucleotides; helix III was the longest, consisting of about 135 nucleotides, and contained a UGGU motif 5′ to the apex; a U–U mismatch was found in the second helix.
Inferred secondary structure of the ITS2 rDNA region based on minimum free-energy modelling using Mfold software. (A) F. cobboldi (dG = − 120.50 kcal/mol); (B) F. elongatus (dG = − 115.70 kcal/mol); (C) C. spatiosus (dG = − 123.60 kcal/mol); (D) G. crumenifer (dG = − 118.70 kcal/mol); (E) V. tripurensis (dG = − 117.20 kcal/mol). Helices I through IV are indicated. The U–U mismatch in helix II and UGGU motif in helix III are also indicated.

Phylogenetic analyses
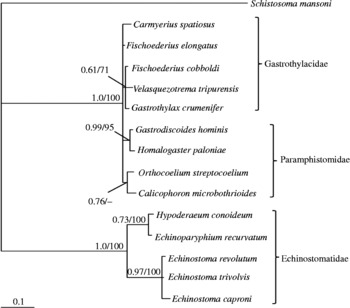
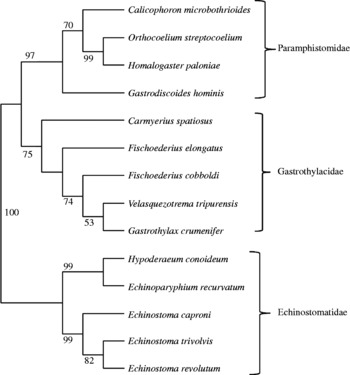
For phylogenetic analyses, annotated ITS2 sequences of other digenetic trematodes (all belonging to the Order Echinostomida) already available in the ITS2 database were retrieved (table 1). Tree topology obtained based on the sequence data alone using the neighbour-joining method showed two distinct clades: one of the gastrothylacid species forming a well-supported clade with members of the other amphistomid family Paramphistomidae (100% bootstrap value) and the other of the family Echinostomidae (fig. 3). However, the amphistome clade was not well resolved, with the two families Gastrothylacidae and Paramphistomidae clumping together. The phylogenetic tree obtained using the Bayesian phylogenetic approach also resulted in a similar topology, retaining same grouping (fig. 3). However, the tree reconstructed on the basis of sequence–structure data (fig. 4) showed a better resolution within the amphistome clade, with gastrothylacid species forming a monophyletic group well separated from the family Paramphistomidae, as indicated by high bootstrap values (>70%).
Phylogram obtained based on ITS2 primary sequence data. Numbers represent Bayesian posterior probabilities/bootstrap values from 1000 replicates (neighbour joining). Bootstrap values of < 50% are not shown.

Profile neighbour-joining tree obtained by ProfDistS synchronously calculated on ITS2 sequence and secondary structure information. Bootstrap support values from 1000 pseudoreplicates are shown.

Discussion
In morphology-based generic and species identification of gastrothylacid flukes, several criteria are regarded as having high taxonomic value. These include: the extent of the ventral pouch (terminating in the mid-region or extending posteriorly up to or near to the level of the testes), uterine loops (extending from one side of the body to the other, or in the mid-line throughout) and the position of testes (symmetrical or tandem) (Jones, Reference Jones, Jones, Bray and Gibson2005). However, the field diagnosis of infection is conventionally based on detection of eggs in the stool samples. These transmission stages of most paramphistomoid fluke species are not morphologically distinguishable from one another. DNA-based methods thus provide supplementary tools in authentic identification of taxa (Blair et al., Reference Blair, Campos, Cummings and Laclette1996); hence the present study.
The ITS2 sequence analysis revealed a considerable sequence divergence, with inter-specific variations ranging from 1.4 to 4.9% among the gastrothylacid species, suggesting the usefulness of the ITS2 region for discriminating closely related species. As has been already demonstrated, differences of as little as one nucleotide change in the ITS2 sequence alone can be used as an effective genetic marker for low-level analyses to distinguish closely related species of digeneans (Nolan & Cribb, Reference Nolan and Cribb2005).
In secondary structure analysis using minimum free-energy modelling, the inferred secondary structure for all the five gastrothylacid species was revealed to corroborate with the core four-helix domain structure (with helix III being the longest, containing a UGGU motif, and a U–U mismatch in helix II) that has been recently identified as common to almost all eukaryote taxa (Coleman, Reference Coleman2003; Schultz et al., Reference Schultz, Maisel, Gerlach, Müller and Wolf2005). The optimal secondary structures inferred herein also agree with the four-domain model of the ITS2 rDNA region for other digeneans as well (Morgan & Blair, Reference Morgan and Blair1998). This structurally identical nature of the ITS2 region can be attributed to the functional similarity of rRNA biogenesis among eukaryotes, where the folding pattern of the ITS2 region has been shown to play an important role in the correct processing of mature rRNA (Van Nues et al., Reference Van Nues, Rientjes, Morre, Mollee, Planta, Venema and Raue1995; Joseph et al., Reference Joseph, Krauskopf, Vera and Michot1999).
Inclusion of secondary structures in phylogenetic reconstructions has been shown to improve the robustness and accuracy of phylogenetic trees (Keller et al., Reference Keller, Forster, Müller, Dandekar, Schultz and Wolf2010). Morever, the utility of ITS2 sequence–structure data in reliable taxonomic inferences has been demonstrated (Shylla et al., Reference Shylla, Ghatani, Chatterjee and Tandon2011). In the present study, the phylogenetic tree obtained based on sequence data alone, using both neighbour-joining and Bayesian methods, could not resolve the constituent families within the amphistome clade. This reflects the ability of the ITS2 sequence, which is highly variable, as an effective marker for discriminating species at the genus and species level only, and therefore it cannot be applied to higher-level phylogenetic analyses. On the contrary, the highly conserved nature of the ITS2 secondary structure makes it a suitable candidate for phylogenetic analyses at higher taxonomic levels. This is reflected here by the tree reconstructed using sequence data combined with secondary structure information, which showed a better resolution, with the family Gastrothylacidae forming a monophyletic group well separated from Paramphistomidae, as indicated by high bootstrap values. This result conforms to the classification of the Paramphistomata group based on morphological observations (Jones, Reference Jones, Jones, Bray and Gibson2005; Sey, Reference Sey2005). More importantly, it also showed the applicability of the ITS2 sequence–secondary structure information in deriving phylogenetic relationships at higher taxonomic levels, which in this case is the inter-family level, i.e. between the families Gastrothylacidae and Paramphistomidae.
The present study provides the first molecular characterization of the gastrothylacid fluke species. The study also demonstrates and reiterates the phylogenetic utility of the ribosomal ITS2 region both for low-level phylogenetic analysis, as indicated by the sequence variation among the gastrothylacid species studied, and for inferences at higher taxonomic levels, as shown by the conservation of the secondary structures and the tree reconstructed using sequence–structure data.
Acknowledgements
The study was supported by a Department of Biotechnology (Government of India) sponsored project sanctioned to V.T., B.R. and A.C., Departmental Special Assistance (University Grants Commission (UGC)-Special Assistance Programme) in Zoology and University with Potential for Excellence-Biosciences Project (UGC) in School of Life Sciences at North-Eastern Hill University (NEHU), Shillong. The use of facilities at the Bioinformatics Centre, NEHU is thankfully acknowledged.