I. INTRODUCTION
Resistive switching phenomena have attracted a great deal of attention owing to their high potential for next-generation nonvolatile memory applications to resistive random access memory (ReRAM), which is an alternative to well-established practical memories such as static random access memory (SRAM) and dynamic random access memory (DRAM).Reference Waser1, Reference Karg, Meijer, Bednorz, Rettner, Schtorr, Joseph, Lam, Janousch, Staub, La Mattina, Alvarado, Widmer, Stutz, Drechsler and Caimi2 Many kinds of material combination and structures have been proposed for the ReRAM application. A typical resistive switching model is based on a thermal effect initiated by a voltage-induced partial dielectric breakdown that forms a discharge filament modified by Joule heating.Reference Pagnia and Sotnik3, Reference Chudnovskii, Odynets, Pergament and Stefanovich4 The intrinsic material properties also induce changes in resistance. For example, the insulator–metal transition in perovskite oxides such as (Pr,Ca)MnO3Reference Asamitsu, Tomioka, Kuwahara and Tokura5–Reference Kim, Kim, Lee and Kim7 and SrTiO3:CrReference Meijer, Staub, Janousch, Johnson, Delley and Neisius8 is induced by electronic charge injection operations such as doping.
We focus on a solid electrolyte based on the nanoionics model,Reference Waser and Aono9 whose resistive change was originally demonstrated by using chalcogenide materials such as As2S,Reference Sakamoto, Sunamura, Kawaura, Hasegawa, Nakayama and Aono10, Reference Banno, Sakamoto, Hasegawa, Terabe and Aono11 Cu2SReference Terabe, Hasegawa, Nakayama and Aono12, and GeAs.Reference Kozicki, Park and Mitkova13 The fundamental unit cell of this kind of switching device has a simple capacitor-like structure, which is composed of a solid electrolyte sandwiched between two conductive electrodes. In fact, the anode and cathode electrode materials are generally Ag or Cu and Pt, respectively. The noteworthy electrical characteristics of these devices are bipolar behavior controlled by the polarity of the applied voltage and their two different resistance states: a high-resistance state (HRS) and a low-resistance state (LRS). However, in terms of a practical large-scale integration (LSI) process and its application, chalcogenide materials are incompatible with the current LSI process owing to their higher vapor pressure and acting as contamination in the equipments. Moreover, the operating voltage is too low (i.e., the ion migration speed is too fast) to drive a lot of switching devices simultaneously. The matrix materials are also critical as regards controlling the diffusion of Cu. To control the defect density or grain size of the matrix, ion oxides, such as ZrO2, are somewhat better candidates. Taking these factors into account, oxide-based ReRAM with the nanoionics model has been proposed as a new application for oxides.Reference Kim and Lee14–Reference Tsuchiya, Oyama, Miyoshi and Yamaguchi18 We also investigated suitable electrode and matrix materials for the LSI process and demonstrated the resistance switching behavior of the Cu/HfO2/Pt system.Reference Haemori, Nagata and Chikyow19 We used HfO2, which is known as an ionic crystal, and a Cu electrode as a mobile ion source owing to its faster diffusion to create a filamentary path in a matrix. HfO2 is currently playing an important role in the global LSI trend including as a high-k gate insulator for advanced complementary metal–oxide semiconductor (CMOS) technologies.Reference Wilk and Wallace20, Reference Robertson21 Moreover, with the miniaturization of integrated circuits, Cu is being used for LSI interconnection wire because its conductivity is superior to that of Al. For this reason, HfO2 and Cu seem more suitable for the LSI process than other materials. There has therefore been increased interest in the use of high-k dielectric oxides as potential ReRAM materials.
Both the nanoionics model and the vacancy model, which originate with the oxygen vacancy nucleation at a metal/oxide interface, have been proposed as the mechanism of the resistance changing behavior of an oxide-based ReRAM with a metal–oxide–metal (MOM) structure.Reference Yang, Miao, Pickett, Ohlberg, Stewart, Lau and Williams22–Reference Shima, Takano, Muramatsu, Yamazaki, Akinaga and Kogure24 Yang et al. indirectly observed that oxygen vacancies are created and drift toward the cathode, forming localized conducting channels on Pt/TiO2/Pt cross-point junctions.Reference Yang, Miao, Pickett, Ohlberg, Stewart, Lau and Williams22 In contrast, Sakamoto et al. reported the creation of a Cu metal filament in Ta2O5 via an electrochemical reaction.Reference Sakamoto, Lister, Banno, Hasegawa, Terabe and Aono15 Although these different mechanisms must result from the use of different material combinations, there has been no direct observation at a metal/oxide interface under bias operation.
Hard x-ray photoelectron spectroscopy (HX-PES) is a powerful tool for investigating the electronic structure and chemical state of the surface/interface of stacking structures for nanoelectronics devices without any degradation because it has a longer photoelectron mean free path than conventional x-ray photoelectron spectroscopy (XPS) using Al Kα radiation (hν = 1486.6 eV). The detection depth of HX-PES with an energy of 6 keV is approximately three times deeper than that of conventional XPS, so the photoelectron from a metal/oxide interface, which works as an electrical device, can be detected by HX-PES. With this method, bias-induced compositional changes around the metal/oxide interface during device operation have been directly observed.Reference Yamashita, Ohmori, Ueda, Yoshikawa, Chikyow and Kobayashi25, Reference Nagata, Haemori, Yamashita, Iwashita, Yoshikawa, Kobayashi and Chikyow26
Although the formation of a filament on an anode has been reported by several groups,Reference Sakamoto, Sunamura, Kawaura, Hasegawa, Nakayama and Aono10, Reference Sakamoto, Lister, Banno, Hasegawa, Terabe and Aono15, Reference Tsuchiya, Oyama, Miyoshi and Yamaguchi18, Reference Tsuruoka, Terabe, Hasegawa and Aono27 there has been no direct observation of metal ionization and diffusion at a metal/oxide interface under bias operation. Here, we used HX-PES with an applied bias to examine the interface electronic structure of a Cu/HfO2/Pt MOM structure in an operating device. This article reviews the resistance switching behavior and direct observation of the filament formation process of the Cu/HfO2/Pt structure compared with the Pt/HfO2/Pt structure, which is an example of the oxygen vacancy model.
II. EXPERIMENT
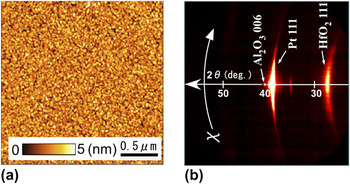
An insulating c-plane sapphire (Al2O3) was used as a substrate to eliminate additional factors responsible for electrical conductivity. A 100-nm-thick Pt bottom electrode layer was deposited on the substrate by direct current (DC) sputtering at room temperature. A HfO2 layer was deposited on the Pt bottom electrode by pulsed laser deposition with a KrF excimer laser (Coherent, Santa Clara, CA, Compex 102, λ = 248 nm). During the deposition, the substrate temperature was maintained at 300 °C by using an infrared laser heating system. The O2 partial pressure was kept at 1 × 10⁻³ Torr. The repetition rate of the laser pulse was 5 Hz, and the laser energy density was approximately 2 J/cm2. Under these conditions, the growth rate of HfO2 film was 2.1 nm/min. The surface morphology of the HfO2 film was characterized by atomic force microscopy (AFM; Seiko Instruments, Chiba, Japan, SII, SPI-4000 with E-sweep) as shown in Fig. 1(a). The obtained root-mean-square roughness was 0.6 nm. This surface morphology also indicated that the HfO2 thin film consisted of fine 20-nm grains. The crystal structure of the HfO2 thin film was identified by x-ray diffraction (XRD). An XRD system equipped with a 5 kW rotating anode Cu target and a high-resolution two dimensional (2D)-detector (BRUKER AXS, Karlsruhe, Germany, D8 Discover Super Speed with GADDS) was used to determine the phases and structure. Part of the Debye–Scherrer ring was detected rapidly and two dimensionally with the 2D-detector system. Figure 1(b) shows an XRD pattern of HfO2 thin film deposited on Pt/Al2O3. The diffraction peaks of the HfO2 thin film indicate a ring patterned peak derived from the polycrystalline monoclinic structure. The strong intensity of the (111) peak means that the HfO2 grains are preferentially oriented to [111]. This as-deposited polycrystalline HfO2 film with a grained structure was used for current–voltage (I–V) and HX-PES measurements.
(a) Atomic force microscopic images of HfO2/Pt/Al2O3 structure and (b) two-dimensional x-ray diffraction.

For the I–V measurements, 100-nm-thick Cu circular top contacts 100 μm in diameter were deposited by using a metal contact mask and DC sputtering at room temperature. The I–V measurements were performed with a semiconductor parameter analyzer (Agilent, Santa Clara, CA, B1500) at room temperature. A positive bias was applied to the top Cu electrode, and the Pt electrode was grounded.
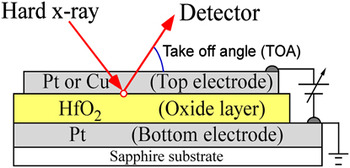
Interface electronic states were measured by using HX-PES in the SPring-8 BL15XU undulator beamline. The incident x-ray energy and the total energy resolution were 5.95 keV and 240 meV, respectively. The beamline is described in detail elsewhere.Reference Ueda, Tanaka, Yoshikawa, Yamashita, Matsushita, Kobayashi, Katsuya and Ishimaru28 The Fermi energy position was calibrated by using Au 4f7/2 spectra (84.0 eV) and the Fermi edge of Au. The measurement setup is shown in Fig. 2. Gold wires fixed to the top and bottom electrodes with Pt paste were connected to electrodes on the sample stage. The thickness of top electrode (Cu or Pt) and HfO2 layer were 10 and 30 nm, respectively. A bias voltage was applied to the sample with a DC voltage current source/monitor (ADCMT, 6240 A, Tokyo, Japan).
Schematic illustration of measurement setup for hard x-ray photoelectron spectroscopy (HX-PES) under bias application.

To analyze the HX-PES results, peaks were fitted using the Voigt function with the Doniach–Šunjić functionReference Doniach and Šunjić29 after the background had been removed by employing the Shirley function.Reference Shirley30 HX-PES measurements were performed at take-off angles (TOAs) of 85°, 40°, and 20° to obtain rough depth profiles; a TOA of 20° is surface/interface-sensitive, whereas a TOA of 85° is bulk-sensitive. The inelastic mean free path (IMFP) calculated using the TPP-2M equationReference Tanuma, Powell and Penn31 of Pt 4f7/2, which was the heaviest element with the shortest IMFP in our measurement, was 4.68 nm, and our measurements probed approximately 15 nm (probing depth: 3 × IMFPReference Powell, Jablonski, Tilinin, Tanuma and Penne32, Reference Tanuma33) below the surface at a TOA of 85°.
III. ELECTRICAL PROPERTIES OF Cu/HfO2/Pt STRUCTURE
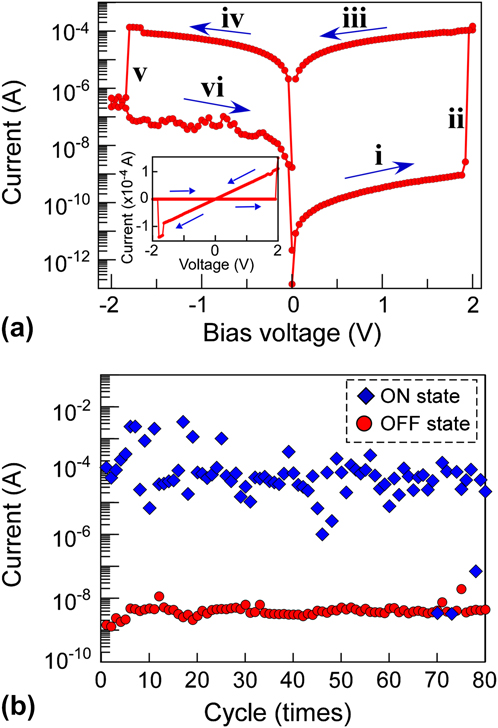
Figure 3(a) shows the I–V characteristic of the Cu/HfO2/Pt structure. The resistance changed when an applied voltage was swept from a positive bias to a negative bias, indicating that there are two different resistive states in the positive and negative voltage regions; one is HRS (turn-off) and the other is LRS (turn-on). An abrupt resistive change from HRS to LRS was induced by increasing the applied voltage up to a positive 2.0 V, where a current increase of more than four orders of magnitude was observed. When the voltage was swept continuously from the positive to the negative direction, there was a rapid drop from LRS to HRS at −1.8 V, where a current decrease of approximately three orders of magnitude was observed. The inset of Fig. 3(a) shows the linear plot of I–V characteristic, which indicated good linearity. Note that the oxygen vacancy model relating to the oxygen migration at the metal/oxide interface, shows nonlinear I–V curves during its forming process,Reference Yang, Pickett, Li, Ohlberg, Stewart and Williams34, Reference Schroeder and Jeong35 meaning that, in the case of the Cu/HfO2 interface majority of conducting pass should be metal conducting pass in the oxide.
(a) Typical current–voltage (I–V) characteristic of Cu/HfO2/Pt structure at room temperature. Arrows indicate the voltage sweep direction (i→ii→iii→iv→v→vi). i and vi are high resistance state (HRS). iii and iv are low resistance state (LRS). ii and v are turn-on and turn-off voltages, respectively. The inset shows linear plot. (b) Pulsed I–V characteristic of Cu/HfO2/Pt structure at room temperature. The pulse width, input positive voltage (set voltage), and negative voltage (reset voltage) are 0.1 s, 4.25, and −2.25 V, respectively.

We obtained switching stability with low voltage operation in each device. The transition voltage from HRS to LRS was similar for most of the devices. A pulsed I–V measurement was also performed as shown in Fig. 3(b). Stable switching behavior with an average on-off ratio of 104 was observed with an input pulse width of 0.1 s
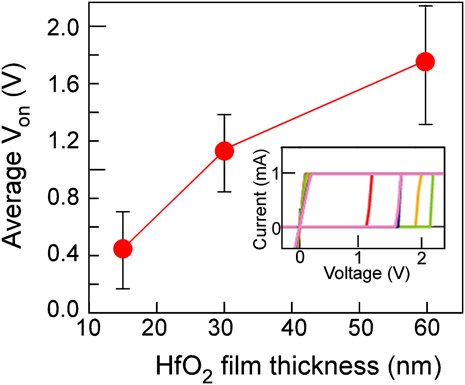
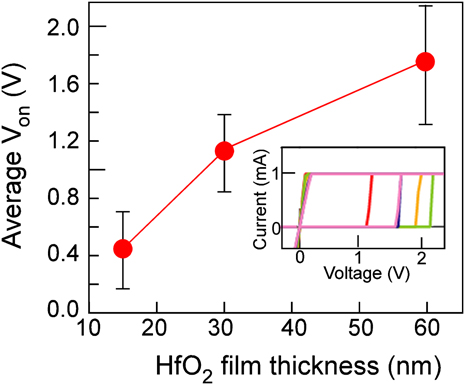
The turn-on voltage indicated the HfO2 film thickness dependence as shown in Fig. 4. As the HfO2 thickness decreased, the turn-on voltage decreased. Furthermore, with an amorphous phase HfO2 layer, the turn-on voltage increased 3-fold. The AFM observation and XRD characterization revealed that the deposited HfO2 thin films had many grain boundaries with a columnar structure. It should be noted that conductive paths form more easily in polycrystalline columnar structured films than in other amorphous films because there are many possible diffusion paths in polycrystalline film.
HfO2 film thickness dependence of average turn-on voltages. The inset shows an example of the I–V property of the Cu/60-nm HfO2/Pt structure in the forward-biased region.
IV. HX-PES MEASUREMENT AT Cu/HfO2 INTERFACE
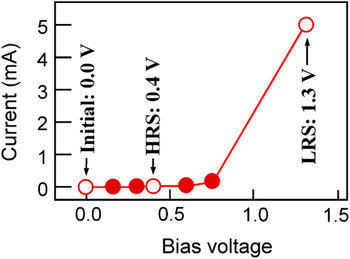
During the HX-PES measurement of the Cu/HfO2/Pt structure, the current was measured as shown in Fig. 5. The I–V property exhibited resistance switching behavior from the HRS to LRS at a bias of 1.3 V, which showed a triple-digit increase. To investigate three different resistance states, we performed the angle-resolved HX-PES measurements at three different biases of 0 V (initial stage), 0.4 V (HRS), and 1.3 V (LRS). Above 1.3 V, the high current made the system vacuum level unsuitable for obtaining measurements.
I–V property of Cu/HfO2/Pt structure during HX-PES measurement. Open circles are points measured by HX-PES.

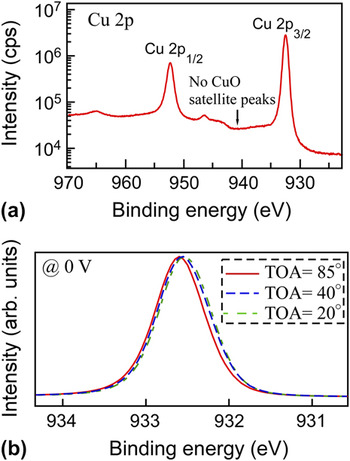
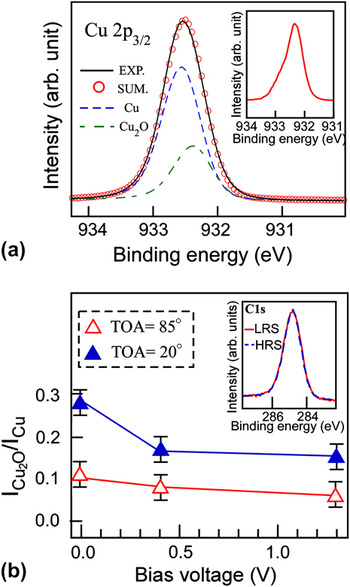
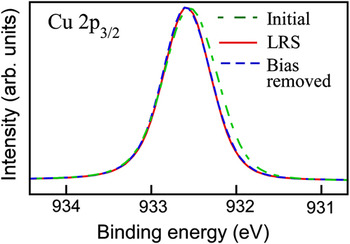
Figure 6(a) shows the Cu 2p spectrum. In the Cu 2p 3/2 spectrum, the peak at a binding energy of 932.6 eV corresponds to metallic Cu.Reference Poulston, Parlett, Stone and Bowker36, Reference Galtayrise and Bonnelle37 The most common oxides of Cu are CuO and Cu2O. According to previous studies, the Cu 2p 3/2 core level of CuO is about 1.0 eV higher than that of metallic Cu and has satellite peaks around 941 eV, which were not observed in the Cu 2p 3/2 spectrum. As the TOA decreased, the Cu 2p spectra [Fig. 6(b)] indicated the pronunciation of core level spectra at 932.4 eV that is attributed to Cu2O, indicating that the Cu electrode had Cu2O layers at the surface and interface.Reference Poulston, Parlett, Stone and Bowker36, Reference Galtayrise and Bonnelle37 Therefore, spectrum was fitted by Cu metal and Cu2O as shown in Fig. 7(a). According to a previous report, Cu film handled in the atmosphere for a few days has a Cu2O layer approximately 0.8–1.0 nm thick.Reference Rhodin38, Reference Iijima, Lim, Hong, Suzuki, Mimura and Isshiki39 Additionally, a 5-nm Pt/5-nm Cu/HfO2 structure, which was deposited via an in situ process under a high-vacuum system to eliminate the surface oxidization of the Cu layer and is an unsuitable sample for studying O 1s spectra owing to the overlapping spectra of the O 1s and Pt 4p 3/2 core levels, was investigated to estimate the thickness of the interfacial oxidized layer between Cu and HfO2 using HX-PES. The investigation revealed that a 0.9 ± 0.1 nm CuO2 layer formed at the interface of the as-deposited 5-nm Pt/5-nm Cu/HfO2 structure (not shown). As a consequence, the Cu/HfO2 is expected to have an approximately 1.8-nm-thick CuO2 layer. At the surface, the O 1s core level attributed to the adsorbed hydro-oxygen and the C 1s core level exhibited no applied bias dependence [Fig. 7(b), inset], indicating that the application of a bias did not affect the surface state. Furthermore, the inset in Fig. 7(a) shows a difference peak, i.e., the Cu 2p 3/2 peak at 0 V minus that at 1.3 V. As the bias increased, the intensity of the Cu2O peak decreased as shown in Fig. 7(b), suggesting a reduction of the Cu2O layer at the interface. To examine the volume of the reduced Cu2O layer, we estimated the thickness of the Cu2O layer (d) based on the following equation,Reference Himpsel, McFeely, Taleb-Ibrahimi, Yarmoff and Hollinger40

(a) Cu 2p HX-PES for the Cu/HfO2/Pt structure under a bias of 0 V at a TOA of 0°. (b) Take-off angles (TOA) dependence of Cu 2p 3/2 HX-PES under a bias of 0 V.

(a) Cu 2p 3/2 HX-PES for the Cu/HfO2/Pt structure under a bias of 0 V at a TOA of 20°. The inset shows the difference peak, which is the Cu 2p 3/2 peak at 0 V minus that at 1.3 V. (b) Applied bias dependences of intensity ratios of Cu2O to Cu. The inset shows C 1s HX-PES at a bias of 0.4 V HRS and 1.3 V HRS and a TOA of 20°.

where λ is the IMFP, δ is the density, M is the molar weight, I is the HX-PES intensity for Cu and Cu2O, and θ is the TOA. The surface Cu2O layer was considered to be 0.9-nm thick. Using the results obtained at TOAs of 85 and 20, the estimated interfacial Cu2O thicknesses at voltages of 0 and 1.3 V were approximately 0.9 ± 0.1 and 0.1 ± 0.1 nm, respectively, indicating that the interfacial Cu2O layer was reduced by the bias application.
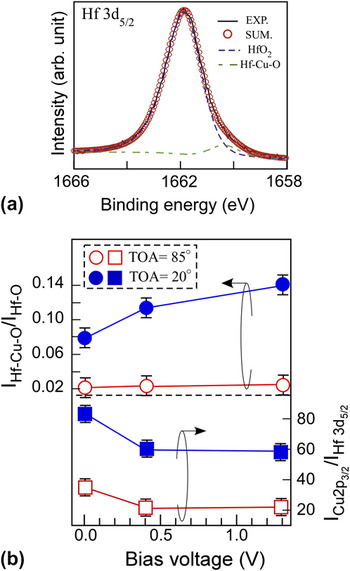
In the Hf 3d 5/2 spectrum [Fig. 8(a)], the peak at 1662.0 eV corresponds to HfO2.Reference Kobayashi, Yabashi, Takata, Tokushima, Shin, Tamasaku, Miwa, Ishikawa, Nohira, Hattori, Sugita, Nakatsuka, Sakai and Zaima41 The Hf 3d 5/2 spectrum tail intensity at a low binding energy increased as the bias voltage increased. In terms of electronegativity, the tail of the Hf 3d 5/2 spectrum was assigned to the Cu–Hf–O bonding state. The intensity ratio of Cu–Hf–O/Hf–O indicated an increase against the bias at both TOAs as shown in Fig. 8(b). Furthermore, the increase in the ratio at a TOA of 20° was greater than that at a TOA of 85°. Figure 8(b) also summarizes the intensity ratio of Cu 2p 3/2/Hf 3d 5/2 against the bias voltage. The ratio decreased against the bias voltage at both TOAs. These results provide evidence that the Cu2O at the interface was reduced and diffused into the HfO2 layer. Furthermore, after removing the bias application, the HX-PES spectra for metals maintained the same shape as those at 1.3 V as shown in Fig. 9, meaning that the Cu reduction and diffusion remain at the interface.
(a) Hf 3d 5/2 HX-PES at 1.3 V and a TOA of 20°. Solid lines show measured spectra and open circles show sum-fitted curves. Dashed lines are fitted curves for each bond: Cu, Cu2O, HfO2, and Hf–Cu–O. (b) Applied bias dependences of intensity ratios of Hf–Cu–O to Hf–O (circles) and Cu 2p 3/2 to Hf 3d 5/2 (squares).

Cu 2p 3/2 HX-PES at initial (0 V), at LRS (1.3 V), and with bias removed at a TOA of 20°.

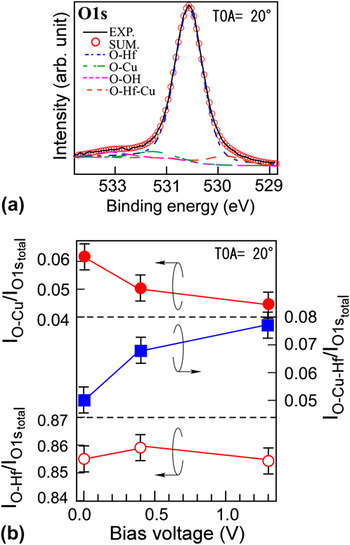
Four oxygen peaks were identified as shown in Fig. 10(a). The highest binding energy peak at 532.2 eV corresponded to O–OH components consisting of hydrogen adsorbed on the surface. The peaks at 530.7 and 531.4 eV are attributable to O–Hf and O–Cu(+1) bonding states, respectively.Reference Poulston, Parlett, Stone and Bowker36, Reference Galtayrise and Bonnelle37, Reference Barreca, Milanov, Fischer, Devi and Tondello42 The lowest binding energy peak at 529.8 eV was assigned to O–Hf–Cu. The O–Cu(+1) peak tendency was consistent with the Cu 2p 3/2 peak, which exhibited a reduction in the intensity ratio of O–Cu(+1) relative to the total intensity of O 1s against the bias voltage as shown in [Fig. 10(b), solid circles]. Furthermore, the O–Hf–Cu peak exhibited a monotonic increase [Fig. 10(b), solid squares]. These results are consistent with the changing behavior of the Cu 2p 3/2 and Hf 3d 5/2 spectra versus the bias voltage. To verify the oxygen vacancy formation in the HfO2 layer against the bias application, the applied bias dependence of intensity ratio of O–Hf (open circles) to total intensity of O 1s is also plotted in Fig. 10(b). The applied bias dependence was not observed, meaning that the oxygen vacancy did not form at the interface.
(a) O 1s HX-PES at a bias of 1.3 V at a TOA of 20°. Solid lines show measured spectra and open circles show sum-fitted curves. Dashed lines are fitted curves for each bond: O–Hf, O–Cu(+1), O–OH, and O–Hf–Cu. (b) Applied bias dependences of intensity ratio of O–Cu (solid circles), O–Hf–Cu (solid squares), and O–Hf (open circles) to total intensity of O 1s at a TOA of 20°.

V. HX-PES MEASUREMENT AT Pt/HfO2 INTERFACE
To investigate the effect of electrode materials, we fabricated a Pt/HfO2/Pt structure with the same HfO2 thickness in the same manner as that described above. When we used Pt as the top electrode, the I–V curve did not show a hysteresis loop until a voltage sweep had been applied a few tens of times. The different switching behavior might result from the structural differences between Cu/HfO2/Pt and Pt/HfO2/Pt.
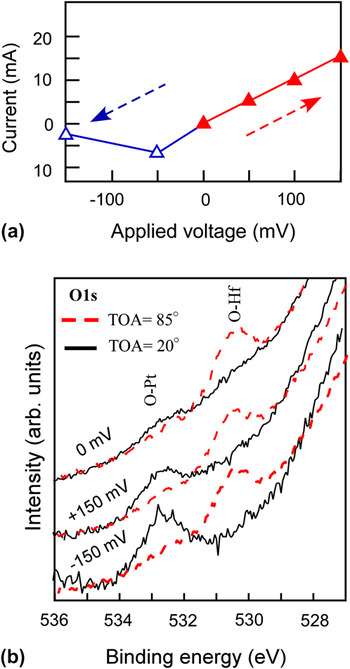
In HX-PES measurements with an applied bias voltage, the I–V property behaved nonlinearly [Fig. 11(a)]. At an applied voltage of 150 mV, the current was 15 mA. Above 150 mV, the high current made the system vacuum level unsuitable for obtaining measurements. However, at an applied voltage of 150 mV, a clear difference was observed between the O–Pt and O–Hf states at a TOA of 20° (interface- and/or surface-sensitive condition) [Fig. 11(b)]. With the O 1s spectra, because the high binding energy tail of the Pt 4p 3/2 states overlapped the weak intensity of the O 1s states, the background could not be removed correctly. To obtain initial compositional depth information, HX-PES measurements were performed at several TOAs and 0 V [Fig. 11(b)]. At a TOA of 85°, the peak at around 530.5 eV is attributable to O–Hf bonding. As the TOA increased, the intensity of the O–Hf peak decreased and a peak developed at around 532.8 eV, which is attributed to O–Pt bonding,Reference Paàl, Muhler and Schlögl43, Reference Jung, Kim, Han, Jo and Kim44 indicating that there was PtO at the interface and/or surface. Note that when the thickness of the Pt layer increased, these peak intensities decreased. Therefore, these states are predominantly formed at the interface. At 0 V, both the O–Hf and O–Pt peaks were small. When a forward bias voltage was applied, the O–Pt peak increased, whereas the O–Hf peak decreased, indicating that the Pt interface layer was oxidized and oxygen vacancies were formed in the HfO2 layer. Under a reverse bias, the O–Pt peak became more pronounced than that under a forward bias, suggesting that the PtO layer formed by the forward bias remained, and the reverse bias formed an additional PtO layer at the interface.
(a) I–V property of Cu/HfO2/Pt structure during HX-PES measurement. (b) HX-PES of O 1s as a function of bias at TOAs of 85° (solid lines) and 20° (dashed lines).

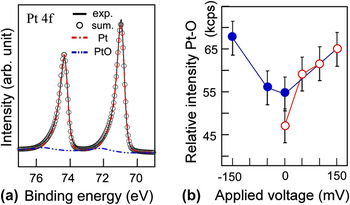
Figure 12(a) shows Pt 4f spectra at a TOA of 20° and a bias of −150 mV. The Pt 4f HX-PES spectrum was dependent on the applied voltage and the spectrum tail intensity at a high binding energy increased versus the applied voltage. In the Pt 4f spectrum, the peaks at binding energies of 71.0 and 74.3 eV correspond to metallic Pt, and the small peaks at 72.2 and 75.5 eV are attributed to PtO. As the forward bias increased, the Pt–O intensity increased [Fig. 12(b)]. This indicates that the forward bias voltage drew oxygen toward the anode and induced Pt oxidization although the oxidization energy of Pt is higher than that of Hf. After the forward bias was removed, the Pt–O intensity decreased slightly, but did not revert to the initial intensity ratio at zero bias, meaning that Pt–O bonding remained at the interface after bias application.
(a) HX-PES of Pt 4f for the Pt/HfO2/Pt diode at a bias of –150 mV (reverse bias) and a TOA of 20°. Solid lines show spectra and open circles show sum-fitted curves. Dashed lines are fitted curves for each bond: Pt and PtO. (b) Applied bias dependences of Pt 4f intensity of PtO (circles). All spectra were normalized by the Pt 4f intensity of Pt at 0 V (initial state). Open symbols show the forward bias conditions and solid symbols show the reverse bias conditions.

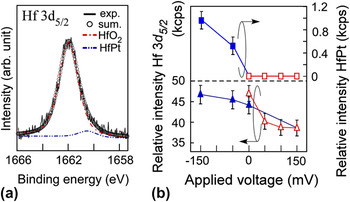
In contrast, the Hf 3d 5/2 HX-PES spectra did not show any dependence on the application of forward bias. In the Hf 3d 5/2 spectrum, under a reverse bias [Fig. 13(a)], an additional peak appeared at the lower binding energy position, which is assigned to the Hf–Pt bond considering the difference in electronegativity of each atom and referring to the previous studies.Reference Kobayashi, Yabashi, Takata, Tokushima, Shin, Tamasaku, Miwa, Ishikawa, Nohira, Hattori, Sugita, Nakatsuka, Sakai and Zaima41 The Hf–Pt intensity, which showed a monotonic increase under a reverse bias, is shown in Fig. 13(b). It indicates that the reverse bias drew Hf toward the negatively biased anode and induced Hf–Pt bond formation. To examine the bias induced variation in the Hf density at the interface, the Hf 3d 5/2/Pt 4f 7/2 elemental intensity ratio at a TOA of 20° was plotted as a function of the bias voltage [Fig. 13(b)]. The ratio decreases with increasing forward bias and increases with increasing negative reverse bias. At –150 mV, the ratio reverts to the initial intensity ratio. These results indicate that the forward and reverse biases drew Hf toward the cathode and negatively biased anode, respectively. Furthermore, the Hf drawn toward the anode induced Pt oxidization as indicated by the PtO intensity increase in Fig. 13(b). This suggests that the diffusion of Hf into the Pt anode produced Pt–Hf mixed oxide and stabilized the oxygen atoms in the negatively biased anode. According to a previous study, the rare earth–transition metal affected the valency number of Pt and induced Pt–rare earth–O bonding.Reference Matolín, Cabala, Matolínová, Škoda, Václavů, Prince, Skála, Mori, Yoshikawa, Yamashita, Ueda and Kobayashi45
(a) HX-PES of Hf 3d 5/2 for the Pt/HfO2/Pt structure under a bias of –150 mV (reverse bias) at a TOA of 20°. Solid lines show spectra and open circles show sum-fitted curves. Dashed lines are fitted curves for each bond: HfO2 and HfPt. (b) Applied bias dependences of Hf 3d 5/2 intensity ratio of HfPt (squares) and intensity of Hf 3d 5/2 (triangles). All spectra were normalized by the Pt 4f intensity of Pt at 0 V (initial state). Open symbols show forward bias conditions and solid symbols show reverse bias conditions.

VI. FILAMENT FORMATION PROCESS OF Cu OR Pt/HfO2/Pt STRUCTURE
Using HX-PES results, we revealed the relationship between the interface structures and the chemical states at the Cu/HfO2/Pt structure under different resistance states, and the difference from the interfacial reaction of Pt/HfO2/Pt structure as illustrated in Fig. 14. There is a natural oxidized copper (Cu2O) layer at the Cu/HfO2 interface in the initial state [Fig. 14(a)-i]. The application of a bias reduces the interfacial Cu2O layer [Fig. 14(a)-ii]. The Cu2O is reduced because the standard reduction potential of Cu ions (Cu+ + e− → Cu + 0.52 V) is lower than that of Pt (Pt2+ + 2e− → Pt + 1.19 V).Reference Bard and Faulkner46 Furthermore, as regards metal segregation in a film, Cu segregates and diffuses into a Hf-based film more easily than Pt.Reference Yoshitake, Aparna and Yoshihara47 It is well known that Ag can be a fast mobile ion in oxides in the same way as Cu. From previous reports and our results, it seems to be feasible that Cu migrates in the HfO2 to form a filamentary path more easily due to its fast diffusion in HfO2 through the columnar grain boundary.
Schematic illustration of (a) Cu/HfO2/Pt structure (i) in initial state and (ii) under bias operation, and (b) Pt/HfO2/Pt structure (i) in initial state and (ii) under bias operation.

This Cu diffusion behavior is quite different from the Pt/HfO2 interfacial reaction under bias operation [Fig. 14(b)], namely the oxidization of the Pt layer. The application of a forward bias diffuses oxygen into the Pt layer, thus forming PtO [Fig. 14(b)-ii]. Note that this oxygen vacancy formation behavior is consistent with the previously reported electrical properties, namely that the oxygen vacancies, which act as trap centers for charge carriers, cause deterioration in the metal/HfO2 interface during CMOS application.Reference Takeuchi, Ha and King48, Reference Ohmori, Ahmet, Yoshitake, Chikyow, Shiraishi, Yamabe, Watanabe, Akasaka, Nara, Chang, Green and Yamada49 Furthermore, the oxygen vacancies in a high electric field form percolating conduction filaments during ReRAM applications.
VII. CONCLUSIONS
In summary, we have demonstrated the resistive switching of a Cu/HfO2/Pt structure. The materials and device structure are compatible with current LSI technology. We also found that HfO2 thin films were polycrystalline with a columnar structure, which was suitable for Cu diffusion. The observed switching performance proved that HfO2 is also a promising oxide for nonvolatile resistive switching applications, not simply as a high-k dielectric gate oxide. Furthermore, to understand the control of the metal/oxide interface, we used HX-PES under bias operation. With the Pt/HfO2 interface, the application of a forward bias increased the Pt–O bonding peak, indicating evidence of Pt electrode oxidization and oxygen vacancy formation around the interface. In contrast, the application of a bias to the Cu/HfO2 interface reduced the copper oxide bonding state, providing evidence of oxygen reduction and Cu diffusion into the HfO2 layer. The most plausible switching model of the Cu/HfO2 interface was proposed based on the experimental results. Cu ions diffuse in a solid electrolyte and undergo an electrochemical reaction at a cathode. By applying a positive voltage to an anode, Cu ions are generated around the anode and they diffuse toward a cathode. The fast diffusion of Cu into an oxide electrolyte means that it is easy to make the filamentary path in the electrolyte. On the other hand, ion–electron recombination occurs and causes metal segregation at the cathode. That is to say, the formation and annihilation conduction path of metal atoms is controlled by the sweeping voltage polarity.
ACKNOWLEDGMENTS
We are grateful to Hiroshima Synchrotron Radiation Center (HiSOR), Hiroshima University, and the Japan Atomic Energy Agency (JAEA)/SPring-8 for the development of HX-PES at BL15XU in SPring-8. The HX-PES measurements were performed under the approval of the NIMS Beamline Station (Proposal No. 2009A 4600 and 2010B 4600). This work was supported in part by a grant-in-aid for Key Technology, “Atomic Switch Programmed Device” from Japan’s Ministry of Education, Culture, Sports, Science, and Technology.
We are also deeply grateful to many colleagues, in particular, Mr. Satoshi Ishimaru of SPring-8 Service, Mr. Tetsuya Adachi of National Institute for Materials Science (NIMS), Mr. Yutaka Iwashita, and Mr. Yuji Kiyota of Meiji University.