




No CrossRef data available.
Article contents
- Abstract
- 1. INTRODUCTION
- 2. SOURCES OF BIAS IN TRADITIONAL STATE ESTIMATION
- 3. EFFECTS OF SYSTEM SIZE AND BIAS ERROR
- 4. EFFECT OF BIAS ERROR ON BAD DATA DETECTION
- 5. EFFECT OF TIME SCEWNESS ON SE ACCURACY
- 6. EFFECT OF SYSTEM SIZE ON COMPUTATIONAL EFFORT
- 7. PROPOSED DIRECTIONS TO MEET THE CHALLENGE
- 7. CONCLUSION
- References
CHARACTERIZATION OF STATE ESTIMATION BIASES
Published online by Cambridge University Press: 12 December 2005
Article contents
- Abstract
- 1. INTRODUCTION
- 2. SOURCES OF BIAS IN TRADITIONAL STATE ESTIMATION
- 3. EFFECTS OF SYSTEM SIZE AND BIAS ERROR
- 4. EFFECT OF BIAS ERROR ON BAD DATA DETECTION
- 5. EFFECT OF TIME SCEWNESS ON SE ACCURACY
- 6. EFFECT OF SYSTEM SIZE ON COMPUTATIONAL EFFORT
- 7. PROPOSED DIRECTIONS TO MEET THE CHALLENGE
- 7. CONCLUSION
- References
Abstract
The control and operation of an electric power system is based on the ability to determine the state of the system in real time. State estimation (SE) has been introduced in the 1960s to achieve this objective. The initial implementation was based on single-phase measurements and a power system model that was assumed to operate under single-frequency, balanced conditions, and a symmetric system model. These assumptions are still prevalent today. The single-frequency, balanced, and symmetric system assumptions have simplified the implementation but have generated practical problems. The experience is that the SE problem does not have 100% performance; that is, there are cases and time periods for which the SE algorithm will not converge. There are practical and theoretical reasons for this and they are explained in the paper. Recent mergers and mandated regional transmission organizations (RTOs) as well as recent announcements for the formation of mega-RTOs will result in the application of the SE in systems of unprecedented size. We believe that these practical and theoretical issues will become of greater importance. There are scientists who believe that the SE problem is scalable, meaning that it will work for the mega-RTOs the same way that it performs now for medium–large systems. There are scientists who believe that this is not true. The fact is that no one has investigated the problem, let alone performed numerical experiments to prove or disprove any claims. This paper identifies a number of issues relative to the SE of mega-RTOs and provides some preliminary results from numerical experiments for the relation between the SE algorithm performance and the power system size.
Information
- Type
- Research Article
- Information
- Probability in the Engineering and Informational Sciences , Volume 20 , Issue 1 , January 2006 , pp. 157 - 174
- Copyright
- © 2006 Cambridge University Press
1. INTRODUCTION
State estimation (SE) was introduced by Gauss and Legendre (around 1800). The basic idea was to “fine-tune” state variables by minimizing the sum of the residual squares. This is the well-known least squares (LS) method, which has become the cornerstone of classical statistics. The reasons for its popularity are easy to understand: At the time of its invention, there were no computers, and the fact that the LS estimator could be computed explicitly from the data (by means of some matrix algebra) made it the only feasible approach. Even now, most statistical packages still use the same technique because of tradition and computational speed. Also, for one-dimensional problems, the LS criterion yields the arithmetic mean of the observations, which at that time seemed to be the most reasonable estimator. Afterward, Gauss introduced the Normal (or Gaussian) distribution as the error distribution for which LS is optimal. Since then, the combination of Gaussian assumptions and LS has become a standard mechanism for the generation of statistical techniques.
In a real-time environment, SE was applied to power systems by Schweppe and Wildes in the late 1960s [16]. Over the past 35 years, the basic structure of the power system SE has remained practically the same: (1) Single-phase model, (2) P, Q, V measurement set, (3) nonsimultaneousness of measurements, and (4) single-frequency model. This basic structure of the power system SE implies the following assumptions (which, in turn, result in a biased state estimator): (1) All current and voltage waveforms are pure sinusoids with constant frequency and magnitude, (2) the system operates under balanced three-phase conditions, and (3) the power system is a symmetric three-phase system which is fully described by its positive sequence network. These assumptions introduce deviations between the physical system and the mathematical model (bias) and have resulted in practical difficulties manifested by poor numerical reliability of the iterative SE algorithm. Substantial efforts to fine-tune the mathematical models in actual field implementations are required. In practice, even for a well-tuned SE, these reasons manifest themselves by the fact that the SE algorithm occasionally diverges. This “unreliability” of the state estimator has been reported in the order of 1–5%.
The authors have developed an SE methodology that is based on three-phase asymmetric models, imbalance system conditions, and Global Positioning System (GPS) synchronized measurements [14,15]. Significant improvements in the performance of the SE were reported. Hansen and Debs utilized three-phase models for traditional state estimation and they have reported a dramatic performance increase as well [5]. Similar results were reported by Zhong and Abur [19]. The authors have expanded this approach to a hybrid state estimator (i.e., one that uses both traditional data as well as GPS synchronized measurements) [6]. In this approach, the sources of the errors in the traditional SE have been investigated. This paper provides a description and quantification of these errors and biases.
The trends in the electric power industry toward larger systems, and especially the recent government announcement for mega-RTOs (regional transmission organizations), raise the question: What will be the performance of the SE in these systems? In this paper, we discuss these problems and offer thoughts on methods to investigate this problem.
We discuss the biases of the traditional SE problem and project the effect of these biases as the system size increases. Specifically, the following issues are discussed: (1) sources of bias in the traditional SE, (2) effects of system size on bias error, (3) effects of system size on computational effort, and (4) effects of bias error on bad data detection. Subsequently, we propose an approach that may mitigate these problems. Yet, extensive numerical experiments are required to determine whether the proposed SE will meet the challenge of providing a practical SE for megasystems.
2. SOURCES OF BIAS IN TRADITIONAL STATE ESTIMATION
The LS SE procedure is an unbiased estimator if and only if the model is accurate (exact) and the measurement errors are statistically distributed. Both of these conditions may not exist in a practical system. In this section we concentrate on the bias resulting from model inaccuracies and we discuss the effect of measurement errors. In particular, model inaccuracies result from (1) unbalanced operating conditions and (2) asymmetries of power system models.
2.1. Balanced Operation
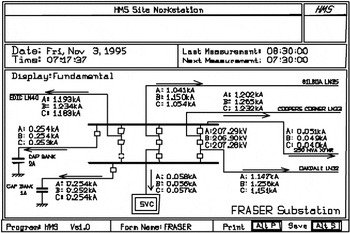
An actual power transmission system operates under near-balanced conditions. The imbalance may be small or large depending on the design of the system. As an example, Figure 1 illustrates the three-phase voltages and currents on an actual system. Note, for example, a 10% difference in the currents of phases A and B of the transmission line to GILBOA. The voltage in this case has only a 0.2% difference between two phases.

Actual three-phase voltages and currents in the FRASER substation.
Because of imbalance, the measurements may have an error. We represent this as follows:

where zt is the true measurement (assuming a balance system), Δz is the measurement error due to imbalance, and z is the actual measurement. Application of the LS SE procedure, assuming no other error sources, yields

where xt is the true state of the system or the unbiased state estimate and the second term is the bias resulting from the imbalance measurement error. Note that the bias from an unbalanced operation depends on the level of imbalance as well as the system parameters (matrix H).
2.2. System Symmetry
An actual power transmission system is never symmetric. Although some power system elements are designed to be near-symmetric, transmission lines are never symmetric. The impedance of any phase is different than the impedance of any other phase. In many cases, this imbalance can be corrected with transposition. Because of cost, many lines are not transposed.
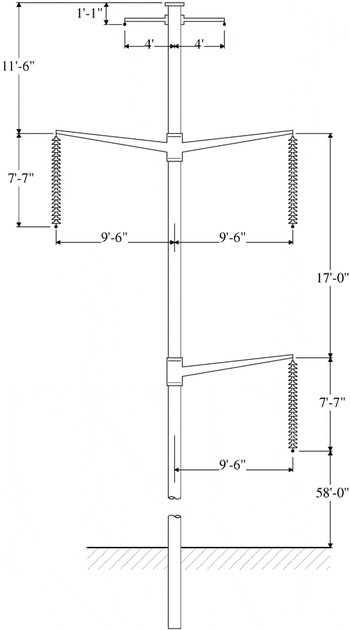
The asymmetry may be small or large depending on the design of the system. One power system component that contributes to the asymmetry is the three-phase untransposed line. As an example, Figure 2 illustrates an actual three-phase line.

Typical transmission line construction.
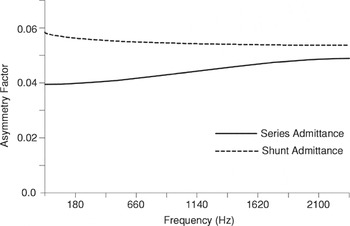
For the purpose of quantifying the asymmetry of this line, two asymmetry metrics are defined:
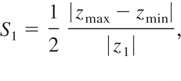
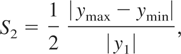
where z1 is the positive sequence series impedance of the line, zmax and zmin are the max and min series impedances of the individual phases, y1 is the positive sequence shunt admittance of the line, ymax and ymin are the max and min shunt admittances of the individual phases.
The above indices provide, in a quantitative manner, the level of asymmetry among phases of a transmission line. As a numerical example, these metrics have been computed for the line of Figure 2 and are presented in Figure 3. Note that the asymmetry is in the order of 5–6%.

Line asymmetry indices (line of Fig. 2).
Because of the presence of nonsymmetric components, the state estimate using a single-phase measurement set is biased. An estimate of the bias can be computed as follows. First, observe that because of power system component asymmetry, the relationship of a measurement to the system model will have an error. Specifically,

where h(x) is the function relating the measurement to the state vector assuming symmetric power system components and Δh(x) is the difference between the symmetric model and the asymmetric model. Now the Jacobian matrix of the measurements becomes

where Hs is the Jacobian matrix assuming symmetric power system elements. Application of the LS SE procedure, assuming no other error sources, yields

where xt is the state of the system assuming a symmetric model and the other terms represent the bias resulting from the system asymmetry.
2.3. Measurement Errors
State estimators are based on the assumption that measurement errors are statistically distributed with zero mean. The traditional implementation of SE uses sensors of V (magnitude), P, and Q. When the sensors are properly calibrated, the measurement error is very close to meeting the requirements of SE. However, recent trends resulted in the use of sensorless technology for power system measurements. Sensorless technology refers to the use of A/D converter technology to sample the voltage and current waveforms. Once the sampled waveforms are available, the required measurements can be retrieved with numerical computations.
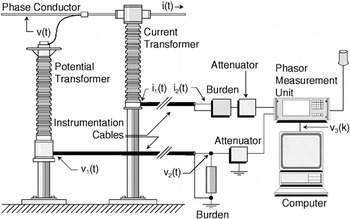
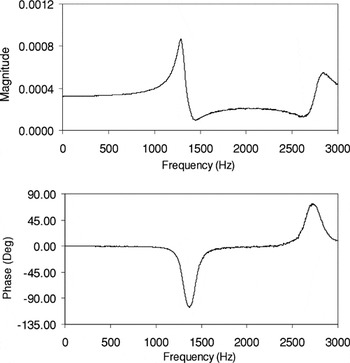
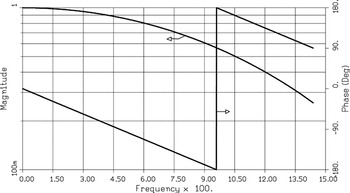
Independent of the technology used for measurements, it is important to examine whether there is bias in the measurements. This can be best achieved by examining the entire measurement channel of a typical power system instrumentation [15]. The major sources of error (see Fig. 4) are (1) the instrument transformers, (2) the cables connecting the instrument transformers to the sensors or A/D converters, and (3) the sensors or A/D converters. Figure 5 illustrates the transfer functions of a typical instrument transformer. It can be observed that the characteristics of instrument transformers near the power frequency are flat. One can conclude that for power frequency measurements, there is no appreciable measurement bias from instrument transformers. However, for measurements at harmonic frequencies, a substantial measurement bias can occur. Another source of measurement bias may result from A/D converters. Figure 6 illustrates the transfer function of a specific A/D converter (Crystal Semiconductor, 16 bit). Note the magnitude and phase bias even at power frequency. It is important to note that the measurement bias is dependent on the design of the A/D converter. The measurement bias resulting from control cables is variable, depending on the total length of the cables.

Components of a typical voltage and current instrumentation channel.

Magnitude and phase of frequency response of a 200-kV/115 potential transformer.

Magnitude and phase of frequency response of the PMU-1620 unit.
The measurement bias can be corrected with software. Such methods have been developed [19], but their use in SE is very limited. It is important to note that the above sources of error cannot be corrected with better (more accurate) instrumentation. To avoid these sources of error, three-phase measurements and a three-phase system model is required. Such a system has been developed and it is described next.
3. EFFECTS OF SYSTEM SIZE AND BIAS ERROR
The effect of bias error in SE has been studied only on a limited basis. The size of this error as the size of the system increases is an unknown. There are scientists who believe that this error will remain constant as the system size grows. Others believe that this may not be true. It is important to design numerical experiments that will allow the study of the bias error size as a function of system size. The purpose of this paper is to suggest some numerical experiments that can be used to study this issue and to provide some initial numerical results for the behavior of the SE errors in relation to the power system size.
3.1. Design of Numerical Experiments
The procedure is based on data provided by simulated system conditions. These data are used instead of actual measurements and are the input of the SE algorithm. However, the system model used for the simulations differs from the equivalent circuit-based model that is used in the SE algorithm. The elements of the power system are represented by physically based models that take into account the actual structure of each element and the possible asymmetries and imbalances that may appear; for example, a transmission line that is one of the most asymmetric power system elements is not represented by its sequence equivalent circuits, but by a physical model that takes into account the geometry of the line. The same holds for all the other elements. In addition, the system is simulated using full three-phase analysis. So, the asymmetries of the components and the imbalances are in fact taken into consideration and appear in the simulation results. We may, therefore, assume that the models represent the actual power system in great detail. Furthermore, the simulation results represent, with great accuracy, the actual quantities that would be measured in an actual power system. Finally, the use of such data ensures that no other sources of error, like measurement noise or bad data, except for the model inaccuracies are present. Therefore, a basic assumption of the experiments is that the data that are used as measurements are assumed to be free of errors, so the only source of bias is the inaccuracies of the mathematical model used by the SE algorithm.
Using the bus voltage magnitudes and the line flows obtained by the simulation as measurements, the classical SE algorithm is executed. Measurements of voltage magnitude and active and reactive power flow are considered. Power injection measurements are not used. The state estimator uses the typical single-phase equivalent circuit representation of the system. The state vector x consists of the phase angles of the voltage at each bus, except for the slack bus, and the voltage magnitude at every bus. The measurement equations that relate the measured data to the state vector are of the form

where Z is the measurement vector consisting of voltage and active and reactive power flow measurements, h(x) is the vector function that relates the measurements to the state vector, and v is the noise vector. The mathematical form of these equations depends on the system model.
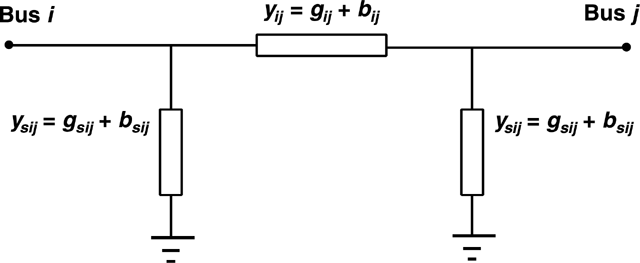
The transmission lines are modeled using the positive sequence pi-equivalent circuit, as presented in Figure 7. The active power flow through the line can be computed as a function of the state vector x by

and the reactive flow as

where

and

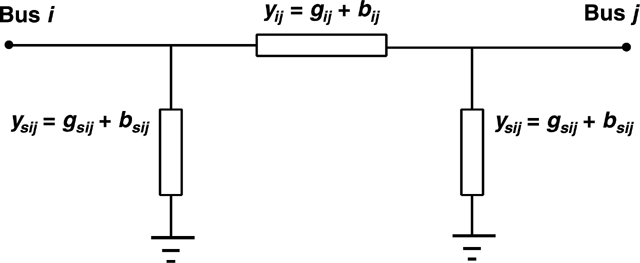
Pi-equivalent transmission line model.
The transformers are modeled similarly, but use only a series admittance, as presented in Figure 8.

Transformer model.
The active power flow through the transformer can be computed as a function of the state vector x by

and the reactive flow as

where aij and βij are defined as in (11) and (12). These are the equations that connect the flow measurements with the unknown state vector. The equations for the voltage magnitude measurements are simply

where Vi is the corresponding voltage magnitude measurement at bus i.
Assuming that the voltage magnitude is measured at every one of the n system buses, and power flows are measured at every one of the m circuit branches, at both ends of each branch, the measurement set consists of the following:
- n voltage measurements
- 2m active power flow measurements
- 2m reactive power flow measurements
The total number of measurements is M = n + 4m and the size of the state vector is N = 2n − 1 .
After the estimation algorithm has converged and an estimation of the system voltages and angles is available, an estimation of the measurements can be obtained through the measurement equations. A comparison of the measurement estimation and the actual measurements provides the estimation error for each measurement

. The weighted sum of the squares of these errors, where the weights are considered to be the inverse of the variance of each measurement, is

. If the noise of each measurement is normally distributed, then

follows the x2 distribution with M − N degrees of freedom. Using the value of

, the confidence level of the estimation can be evaluated. By considering various test cases with increasing system sizes, it is possible to study the behavior of the SE bias due to model inaccuracies as the size of the system increases.
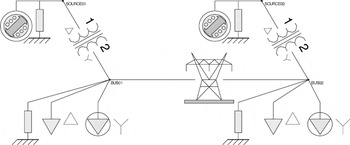
The test cases used for the study of the SE errors are based on a rather simple system configuration. The basic system module used consists of two main load buses. A constant power and constant impedance load are connected on each bus, and each bus is connected to a generator through a step-up transformer. The two load buses are connected through an overhead transmission line. The system contains all of the basic elements that are typical to a power system. The diagram of the basic two-bus module is presented in Figure 9.

Two-bus test system.
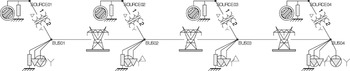
Based on this configuration, the size of the system is increased by repeating this module in a radial way and, therefore, increasing the number of buses that exist on the system. As an example, the four-bus system is shown in Figure 10. Using the simulation results as a measurement, the SE results are obtained for each system and the errors are calculated. In this way the SE performance relative to the system size can be evaluated. The behavior of the errors as the system size increases is also an indication of the performance of the SE algorithm as the system size increases.

Four-bus test system.
The quantities that are considered system measurements are the voltage magnitudes at each bus and the active and reactive power flows at each network branch. The flows are measured at both ends of each branch. Three measurement scenarios are considered:
Scenario 1: The typical single-phase measurement approach, which is commonly used and assumes symmetry and balanced loading, is assumed. The voltage magnitude of phase A is considered and only the power flows of phase A are measured and the total line flow is calculated by multiplying this measurement by 3.
Scenario 2: The second measurement scenario is the same as the first one with the exception that the data from phase B are used as measurements instead of phase A.
Scenario 3: The third scenario assumes again voltage measurements of a single phase, phase A, but three-phase measurements of active and reactive power flows. So, the power measurements provided to the SE algorithms are the sum of the measurements for all three phases.
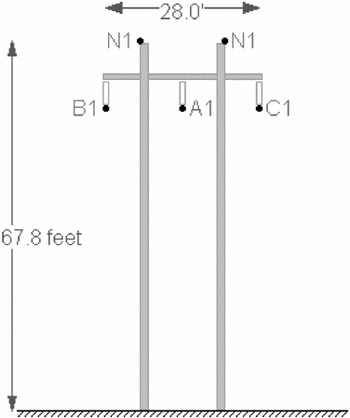
The purpose of these three cases is to capture the effects of the asymmetries in the system on the performance of the SE algorithm. In fact the system operates under balanced loading conditions, but the main source of asymmetry is the transmission line structure. The type of transmission line pole used is presented in Figure 11. There is significant asymmetry at the structure and phase A is expected to be differently loaded than phases B or C.

Transmission line pole structure.
The simplest system consists of 2 buses and the rest of them consist of 4, 8, and 16 buses. It should be mentioned that the numbers refer to high-voltage load buses, which are connected through transmission lines, and the generation buses are not taken into account. However, this implies that the actual number of buses is double in each one of the cases; that is, each case contains 4, 8, 16, and 32 buses, respectively. Based on the radial structure of the test networks, if n is the number of buses, then the number of branches is n − 1, and therefore the total number of measurements is 5n − 4. Since the number of states is 2n − 1, the measurement redundancy is 3n − 3, and this is also the number of degrees of freedom in each case, and the redundancy index is r = (5n − 4)/(2n − 1). As the system size increases (i.e., as n → ∞), r → 5/2 = 2.5.
3.2. Numerical Test Results
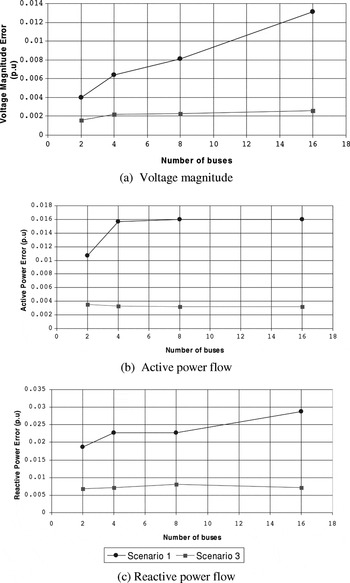
The results of the SE algorithm reveal the fact that the estimation errors due to the model inaccuracies tend to increase as the system size increases. Figure 12 presents the maximum absolute errors for voltage magnitude, active power flow, and reactive power flow, respectively.

Maximum absolute errors versus system size for (a) voltage magnitude, (b) active power flow, and (c) reactive power flow.
It should be stated again that since simulation data are used, there are no other sources of error except for model inaccuracies in each case. So, the increase in the estimation errors is solely due to the increasing model inaccuracies because of the system asymmetries as the system size increases. It is therefore projected that if the system size becomes extremely large, the results of the classical state estimator will eventually become unreliable and the errors very large. Numerical experiments for much larger systems are to be carried out to verify these conclusions. The increase in the error is much greater in the voltage magnitude, rather than in the power measurements, where it seems that the error tends to stabilize. In an actual situation, where other sources of bias are also present, this will make the SE results impractical.
Although the errors seem to increase in the case of using single-phase power measurements, this does not seem to be the case in Scenario 3, where the sum of the flows of all three phases is used as measurement. In this case, the estimation error is much lower and it remains almost constant as the system size grows.
To further investigate the issue, the confidence level of the estimation is calculated for every case. The results are produced parametrically for various values of standard deviation σ of the measurements. Every measurement is assumed to follow a Gaussian distribution with the same variance σ2. All the measurements are assumed to have the same weight.
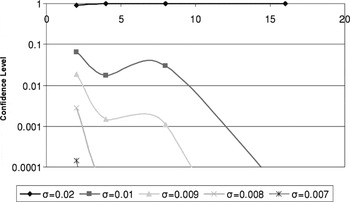
The confidence level of the estimation for various system sizes is presented in Figure 13 for the measurement data of Scenario 1. The plot is parametric for various values of the standard deviation.

Confidence level of estimation versus system size for different values of the standard deviation for scenario 1.
Based on the plot, it can be concluded that for values of σ lower than 0.02, the confidence level of the estimation is low and decreases very rapidly as the system size increases, and the estimation becomes unreliable. However, for values of σ greater than 0.02, the confidence of the estimation is very high and increases with the system size, approaching 1.00. This can be explained based on the chi-square distribution used to calculate the values of the confidence level. More specifically, the value of the objective function

increases with the system size, but as explained previously, the measurement redundancy, which is equal to the degrees of freedom, also increases linearly with the system size. So, as the system grows, the redundancy of measurements also increases and this provides a better confidence level of the estimation. However, since the redundancy index tends to stabilize quickly as n increases, this behavior may not continue to be the same for extremely large systems and the confidence level may start to deteriorate for a very large number of buses.
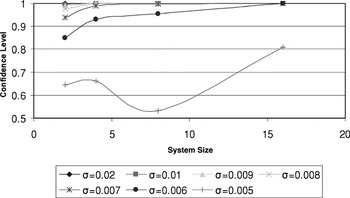
The confidence levels for Scenario 3, for the same values of measurement variance, are presented in Figure 14. The behavior in this case is similar; however, the confidence level is much higher for the same values of σ than in the previous case. This indicates that using the measurements from all three phases for the power flows, a high confidence level of estimation can be achieved for lower values of measurement variance, which may be as low as approximately 0.006, whereas in the single-phase measurements case, the best that could be achieved was a standard deviation of approximately 0.02.

Confidence level of estimation versus system size for different values of the standard deviation for scenario 3.
4. EFFECT OF BIAS ERROR ON BAD DATA DETECTION
The value of the SE is its promise to detect and identify bad data. This ability is best when the system model is not biased. In the presence of model bias, the ability to detect and identify bad data is compromised. Again, on a theoretical or practical basis, we know very little on the subject; that is, how the performance of the bad data detection and identification will be affected in megasystems.
5. EFFECT OF TIME SCEWNESS ON SE ACCURACY
The traditional SE is based on measurements that do not need to be fully synchronized. Specifically, it relies on the measurement of quantities that are constant under the assumption of steady state operation [i.e., V (magnitude), P, and Q]. In practice, each measurement is taken from others and at different times (within a short time interval) and transmitted to a central location. Thus, the measurements (data) are not all taken at the same time. Since the system is always in transition, there will be a discrepancy between the system model and the collected data resulting from the time skewness of the data. It is very difficult to quantify this discrepancy, which is dependent on the system and on how fast the system transits from one operating condition to another. This issue can be resolved with present technology (GPS) that provides practically absolute time (precision better than 1 μm).
6. EFFECT OF SYSTEM SIZE ON COMPUTATIONAL EFFORT
The traditional SE problem is based on a quasi-Newton algorithm. The direction of the Newton method is computed by inverting a matrix with size equal to the number of states. Sparsity techniques provide efficient algorithms for the solution and update for the state variables at each iteration. Numerical experiments for medium-size power systems indicate that the computational effort depends on the system topology and are proportional to a factor of n exp(a), where n is the number of states and a is an exponent that is system dependent. If we assume that the exponent is approximately 1.7, then one can project the computational effort for megasystems, assuming that the observations for medium-size systems are valid for megasystems as well. The fear is that for megasystems, the sparsity properties of the equations may deteriorate (number of fill-ins may increase disportionately with system size). The last issue not withstanding, a 10-fold increase in system size will result in a 50-fold increase in computational effort. Another issue that we do not have data for is the number of iterations that the SE will need for convergence, in the case of megasystems. All of this points to the need for proper numerical experiments that will provide information for this topic.
The above discussion assumes that we simply apply the traditional SE to the megasystems. There are alternative approaches while we maintain the traditional SE formulation. For example, the system may be partitioned and diakoptical techniques could be applied for the solution. Computational issues and convergence issues will remain the same, but this approach will allow scheduling of the computations on a distributed computer system.
7. PROPOSED DIRECTIONS TO MEET THE CHALLENGE
To alleviate the sources of error, new measurement systems and estimation methods are needed. For example, the first assumption (stated in Section 1) can be met by utilizing synchronized measurements [13]. Synchronization is achieved via a GPS, which provides the synchronizing signal an accuracy of 1 μs. Assumption 2 can be met by utilizing three-phase measurements. Finally, assumption 3 can be met by employing full three-phase models.
As shown from the numerical examples, even by simply using three-phase measurements of the power flows, the improvement in the estimation quality is substantial, even though the model remained the same and only the measurement set was improved using data from all three phases. Therefore, it is expected that if, in addition to three-phase measurement sets, synchronized measurements and three-phase models are used, the performance of the SE algorithm will be very sufficient and reliable even for extremely large systems.
The SE based on the previous assumptions is not subject to the usual biases of the traditional state estimation. The SE can be formulated as a linear SE problem that has a direct solution. This takes care of the uncertainty of how many iterations will be needed for convergence in case of megasystems. It is expected that this system, because of lack of biases, will have better bad data detection and identification. It is important, however, to add that the proposed system will need a new infrastructure that presently is not there. It is recognized that the industry is moving toward the sensorless technology, at least in new substations. The step to take from sensorless technology to synchronized measurements is economically very short. Thus, we believe that it may happen in the near future.
7. CONCLUSION
The conventional SE has inherent biases resulting from biases in the measurements and biases in the power system model (imbalance and asymmetry of component models). We presented equations for quantifying the biases in the conventional SE and have discussed the effects of these biases on the SE as the size of the system increases. Many questions remain unanswered regarding the applicability of the traditional SE to megasystems. We argue that appropriately designed numerical experiments will provide insight into these problems.
References
REFERENCES
Alsac, O.,
Vempati, N.,
Stott, B., &
Monticelli, A.
(1998).
Generalized state estimation.
IEEE Transactions on Power Systems
13(3):
1069–1075.Google Scholar
Arifian, A.,
Ibrahim, M.,
Meliopoulos, S., &
Zelingher, S.
(1997).
Optic technology monitors HV bus.
Transmission and Distribution
49(5):
62–68.Google Scholar
Clements, K.A.,
Denison, O.J., &
Ringlee, R.J.
(1973).
The effects of measurement nonsimultaneity, bias, and parameter
uncertainty on power system state estimation. In
1973 PICA Conference Proceedings, pp.
327–331.
Fardanesh, B.,
Zelingher, S.,
Sakis Meliopoulos, A.P.,
Cokkinides, G., &
Ingleson, J.
(1998).
Multifunctional synchronized measurement network.
IEEE Computer Applications in Power
11(1):
26–30.Google Scholar
Hansen, C.W. &
Debs, A.S.
(1995).
Power system state estimation using three-phase models.
IEEE Transactions on Power Systems
10(2):
818–824.Google Scholar
Ingram, M.,
Bell, S.,
Matthews, S.,
Meliopoulos, A.P., &
Cokkinides, G.
(2004).
Use of phasor measurements, SCADA and IED data to improve state
estimation. In
7th Fault and Disturbance Analysis Conference.
Krumpholz, G.R.,
Clements, K.A., &
Davis, P.W.
(1980).
Power system observability: A practical algorithm using network
topology.
IEEE Transactions on Power Apparatus and Systems
99(4):
1534–1542.Google Scholar
Meliopoulos, A.P.,
Zhang, F.,
Zelingher, S.,
Stillmam, G.,
Cokkinides, G.J.,
Coffeen, L.,
Burnett, R., &
McBride, J.
(1993).
Transmission level instrument transformers and transient event
recorders characterization for harmonic measurements.
IEEE Transactions on Power Delivery
8(3):
1507–1517.Google Scholar
Phadke, A.G.,
Thorp, J.S., &
Karimi, K.J.
(1986).
State estimation with phasor measurements.
IEEE Transactions on Power Systems
1(1):
233–241.Google Scholar
Sakis Meliopoulos, A.P.
(1998).
Power system grounding and transients.
New York:
Marcel Dekker.
Sakis Meliopoulos, A.P.,
Cokkinides, G.C., &
Webb, R.P.
(1982).
Multiphase power flow analysis. In
Proceedings of Southeastcon, pp.
270–275.
Sakis Meliopoulos, A.P. &
Papalexopoulos, A.D.
(1986).
Interpretation of soil resistivity measurements: Experience with the
model SOMIP.
IEEE Transactions on Power Delivery
1(4):
142–151.Google Scholar
Sakis Meliopoulos, A.P.,
Zhang, F., &
Zelingher, S.
(1992).
Hardware and software requirements for a transmission system
harmonic measurement system. In
Proceedings of the Fifth International Conference on Harmonics in
Power Systems (ICHPS V), pp.
330–338.
Sakis Meliopoulos, A.P.,
Zhang, F., &
Zelingher, S.
(1994).
Power system harmonic state estimation.
IEEE Transactions on Power Systems
9(3):
1701–1709.Google Scholar
Sakis Meliopoulos, A.P. &
Zhang, F.
(1996).
Multiphase power flow and state estimation for power distribution
systems.
IEEE Transactions on Power Systems
11(2):
939–946.Google Scholar
Schweppe, F.C. &
Wildes, J.
(1970).
Power system static-state estimation, Part I, II, and III.
IEEE Transactions on Power Apparatus and Systems
89(1):
120–135.Google Scholar
Semlyen, A. &
Deri, A.
(1985).
Time domain modeling of frequency dependent three-phase transmission
line impedance.
IEEE Transactions on Power Apparatus and Systems
104(6):
1549–1555.Google Scholar
Zelingher, S.,
Stillmann, G.I., &
Sakis Meliopoulos, A.P.
(1990).
Transmission system harmonic measurement system: A feasibility
study. In
Proceedings of the Fourth International Conference on Harmonics in
Power Systems (ICHPS IV), pp.
436–444.
Zhong, S. &
Abur, A.
(2002).
Effects of non-transposed lines and unbalanced loads on state
estimation. In
Power Engineering Society Winter Meeting, vol 2, pp.
975–979.
Actual three-phase voltages and currents in the FRASER substation.
Typical transmission line construction.
Line asymmetry indices (line of Fig. 2).
Components of a typical voltage and current instrumentation channel.
Magnitude and phase of frequency response of a 200-kV/115 potential transformer.
Magnitude and phase of frequency response of the PMU-1620 unit.
Pi-equivalent transmission line model.

Transformer model.
Two-bus test system.
Four-bus test system.
Transmission line pole structure.
Maximum absolute errors versus system size for (a) voltage magnitude, (b) active power flow, and (c) reactive power flow.
Confidence level of estimation versus system size for different values of the standard deviation for scenario 1.
Confidence level of estimation versus system size for different values of the standard deviation for scenario 3.
 You have
Access
- 14
- Cited by